

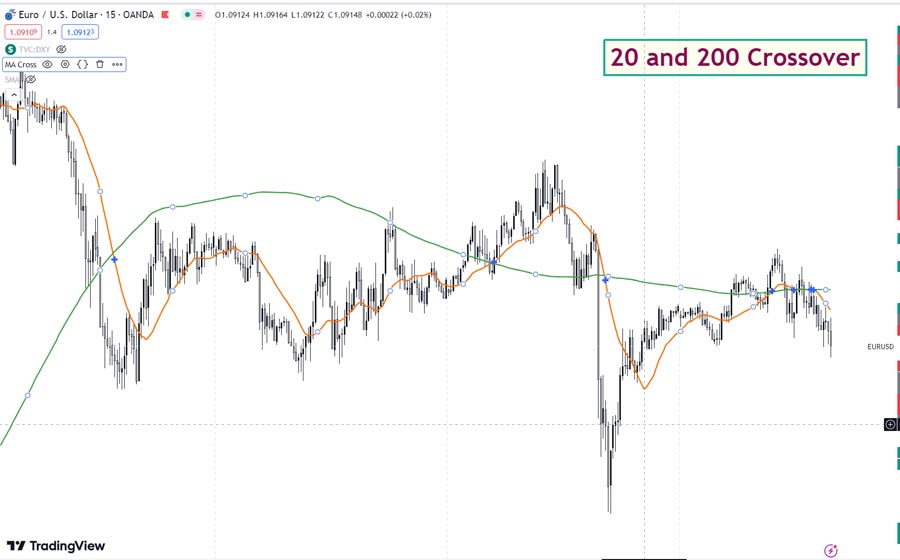
The 20, 50, and 200 day moving average crossover strategy is an exceptionally effective method for recognizing market trends and making informed trading decisions. This strategy entails monitoring the interactions among short-term (20-day), medium-term (50-day), and long-term (200-day) moving averages. For instance, when the 20-day moving average crosses above the 50-day moving average or the 50-day crosses above the 200-day moving average, it often signals potential trend reversals. A well-known case is the Golden Cross, where the 50-day moving average crosses above the 200-day moving average, typically marking the beginning of a strong bullish trend. By leveraging such insights, traders, including those utilizing an online forex broker, can improve their timing for entries and exits, manage risks more effectively, and refine their trading strategies. In this article, we will delve into how the 20, 50, and 200 day moving average crossovers function, their importance, and how you can apply them to enhance your trading decisions.

What is a Moving Average Crossover?
A moving average crossover occurs when two or more moving averages (MAs) of different time periods intersect. This event is a significant indicator for traders, signaling potential changes in market trends. In essence, it is a visual cue that suggests the market’s direction might be shifting, which can be a precursor to either a bullish (upward) or bearish (downward) trend.
The Key Moving Averages: 20, 50, and 200 Days
When it comes to moving averages, the 20, 50, and 200 day periods are among the most commonly used. Here’s why each is important:
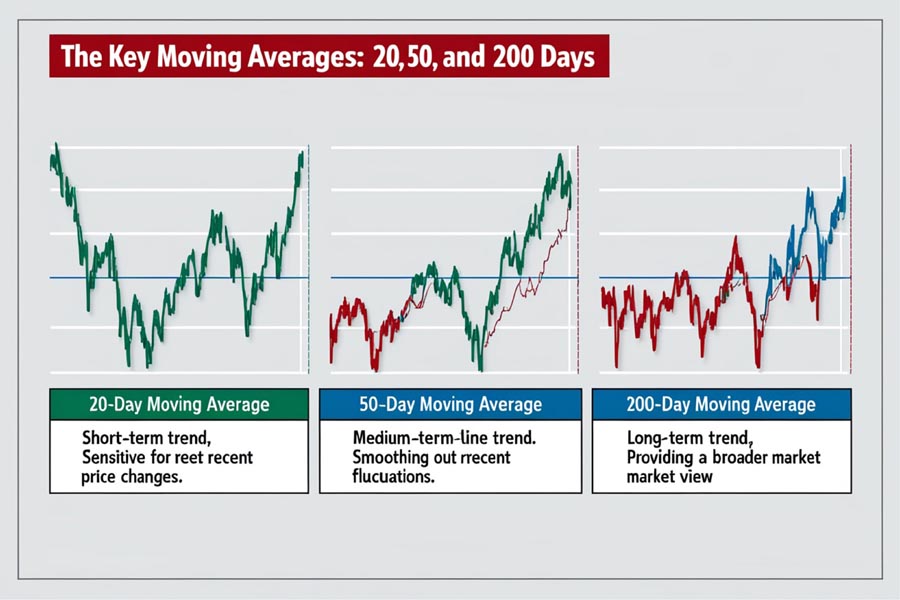
- 20-Day Moving Average: This short-term indicator is sensitive to price changes and helps traders identify recent trends. It’s particularly useful for spotting early trend reversals.
- 50-Day Moving Average: Serving as a mid-term indicator, the 50-day moving average smooths out fluctuations, providing a more stable view of the trend. It’s often used to confirm the signals given by the 20-day moving average.
- 200-Day Moving Average: This long-term indicator is less reactive to daily price movements, offering a broader view of the market’s overall direction. It’s typically used to identify the primary trend.
Read More: 50 200 day moving average crossover strategy
Understanding the 20, 50, and 200 Day Moving Average Crossover
The 20, 50, and 200 day moving average crossover strategy is a foundational concept in technical analysis used by traders to identify and act on market trends. By examining how different moving averages intersect, traders can gain insights into potential market shifts and make informed trading decisions. Here’s a deeper look at each type of crossover and their significance.
1. 20-Day and 50-Day Moving Average Crossover
The 20-day moving average (MA) is a short-term indicator that reflects recent price trends, while the 50-day moving average is a medium-term indicator that smooths out these trends over a slightly longer period. The crossover between these two moving averages can provide critical signals:
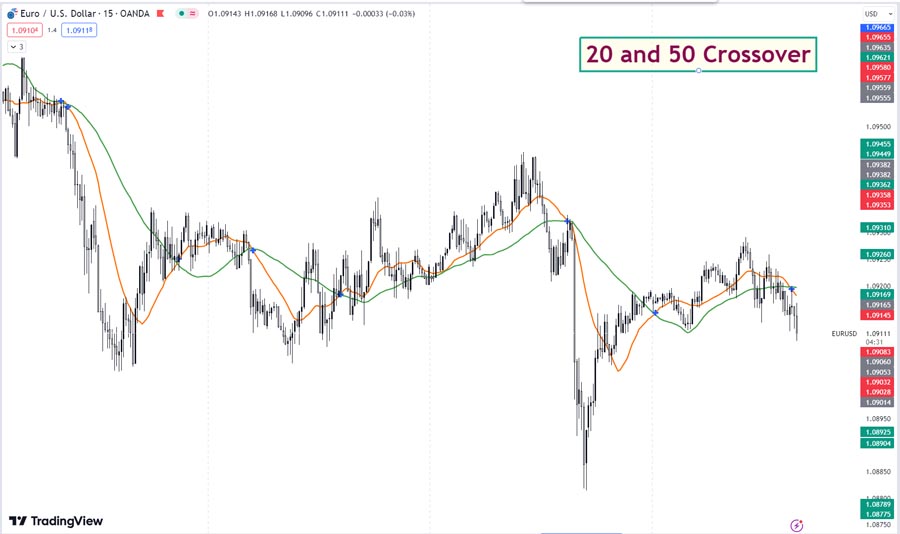
- Bullish Signal (Golden Cross): When the 20-day MA crosses above the 50-day MA, it suggests that recent prices are gaining strength relative to the longer-term trend. This crossover often signals the beginning of a short-term uptrend, providing a potential buying opportunity for traders looking to capitalize on an anticipated rise in price. Traders might interpret this as a confirmation of positive momentum and a possible signal to enter long positions.
- Bearish Signal (Death Cross): Conversely, when the 20-day MA crosses below the 50-day MA, it indicates that recent price movements are weakening relative to the longer-term trend. This bearish crossover can be a signal of a short-term downtrend, suggesting that traders may want to consider exiting long positions or exploring short positions.
2. 50-Day and 200-Day Moving Average Crossover
The 50-day moving average is often used in conjunction with the 200-day moving average, which is a long-term indicator that represents a broader view of market trends. The interaction between these two moving averages can offer powerful insights:
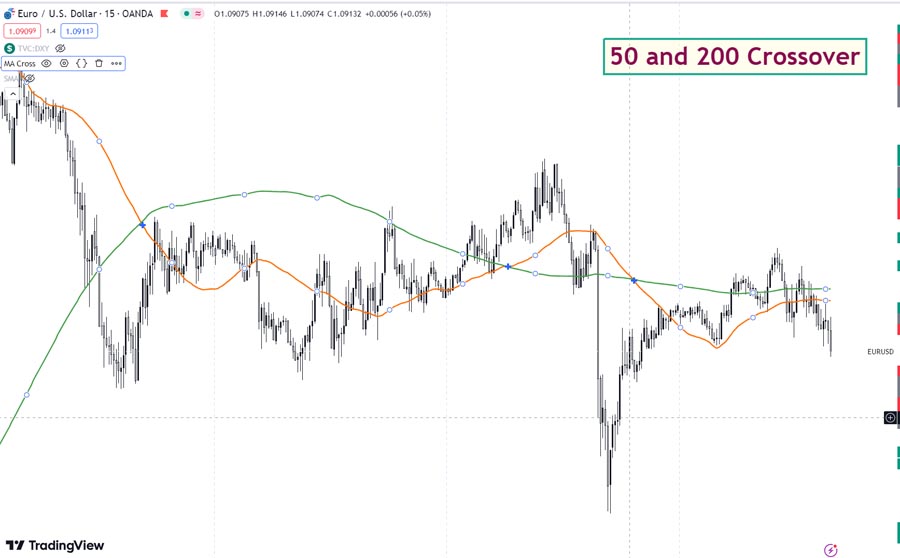
- Golden Cross: When the 50-day MA crosses above the 200-day MA, it is known as a Golden Cross. This is a highly regarded bullish signal indicating a strong upward trend. The Golden Cross suggests that the short-term momentum has overcome the long-term trend, often leading to a significant and sustained rally. Traders may view this as a strong buy signal, anticipating continued upward movement in the market.
- Death Cross: When the 50-day MA crosses below the 200-day MA, it creates a Death Cross. This bearish signal indicates that the short-term trend is declining relative to the long-term trend, suggesting a potential downturn. A Death Cross is often associated with market corrections or prolonged downtrends, prompting traders to consider selling or shorting positions to mitigate losses.
Practical Application and Strategy
Understanding these moving average crossovers can help traders make more informed decisions. Here are a few practical tips for applying this strategy:
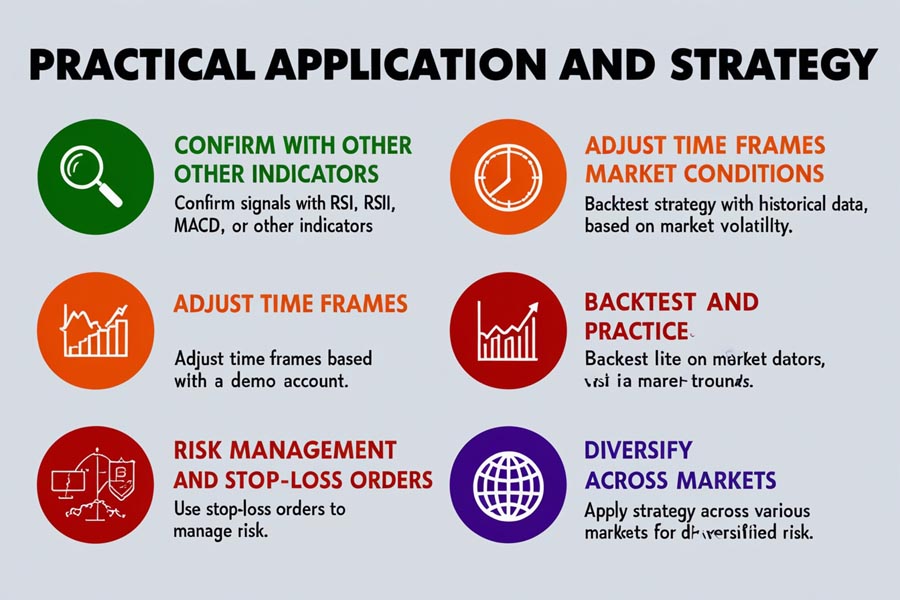
- Confirm with Other Indicators: While moving average crossovers are powerful, they should be used in conjunction with other technical indicators, such as the Relative Strength Index (RSI) or Moving Average Convergence Divergence (MACD), to confirm signals and reduce the likelihood of false positives.
- Adjust Time Frames Based on Market Conditions: Different market conditions may require adjustments to the time frames used. For instance, in a highly volatile market, shorter time frames (like the 10-day and 20-day moving averages) may be more effective, while in a stable market, longer time frames (like the 50-day and 200-day moving averages) might provide more reliable signals.
- Backtest and Practice: Before using moving average crossovers in live trading, backtest the strategy using historical data to see how it would have performed in the past. Additionally, consider practicing with a demo account to refine your strategy and gain confidence.
By thoroughly understanding and applying the 20, 50, and 200 day moving average crossover strategy, traders can better navigate market trends and enhance their trading effectiveness.
3. 20-Day and 200-Day Moving Average Crossover
The crossover between the 20-day moving average and the 200-day moving average can also provide valuable insights, although it is less commonly discussed compared to other crossovers:
- Bullish Signal: When the 20-day MA crosses above the 200-day MA, it indicates that short-term price movements are gaining strength relative to the long-term trend. This crossover can be an early signal of a potential bullish trend, suggesting that a new uptrend might be starting. Traders might use this signal to enter long positions, anticipating future gains.
- Bearish Signal: Conversely, when the 20-day MA crosses below the 200-day MA, it signals a weakening short-term trend relative to the long-term trend. This bearish crossover may indicate the beginning of a significant downtrend, prompting traders to exit long positions or look for shorting opportunities.
Read More: 20 day moving average crosses 200 day moving average
Why Moving Average Crossovers Matter in Trading
Moving average crossovers are highly regarded in trading because they simplify complex market movements into clear, actionable signals. Here’s why they are essential:
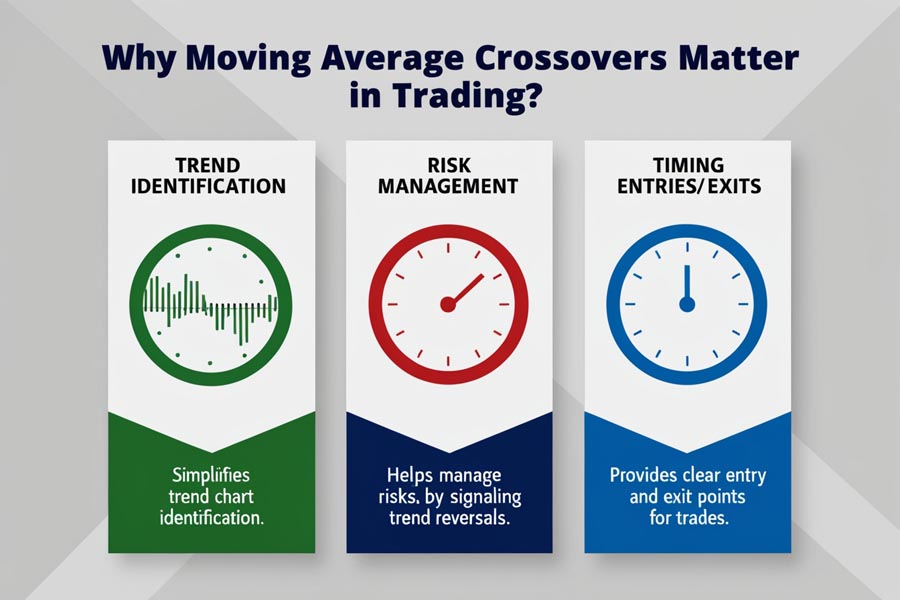
1. Trend Identification
One of the primary benefits of using moving averages is trend identification. By smoothing out price data, moving averages help traders see the bigger picture. Crossovers, in particular, offer straightforward signals for entering or exiting trades based on trend reversals.
2. Risk Management
Crossovers can also serve as a risk management tool. By acting on crossover signals, traders can minimize losses by exiting trades before a trend fully reverses. For example, spotting a death cross early can help a trader exit a losing position before the market downturn worsens.
3. Timing Entries and Exits
Proper timing is crucial in trading, and moving average crossovers provide clear points of entry and exit. When the shorter-term moving average crosses above the longer-term moving average, it often marks a favorable entry point for a long position. Conversely, when the shorter-term MA crosses below the longer-term MA, it can signal the right time to sell.
Strategies to Optimize Your Trading with Moving Average Crossovers
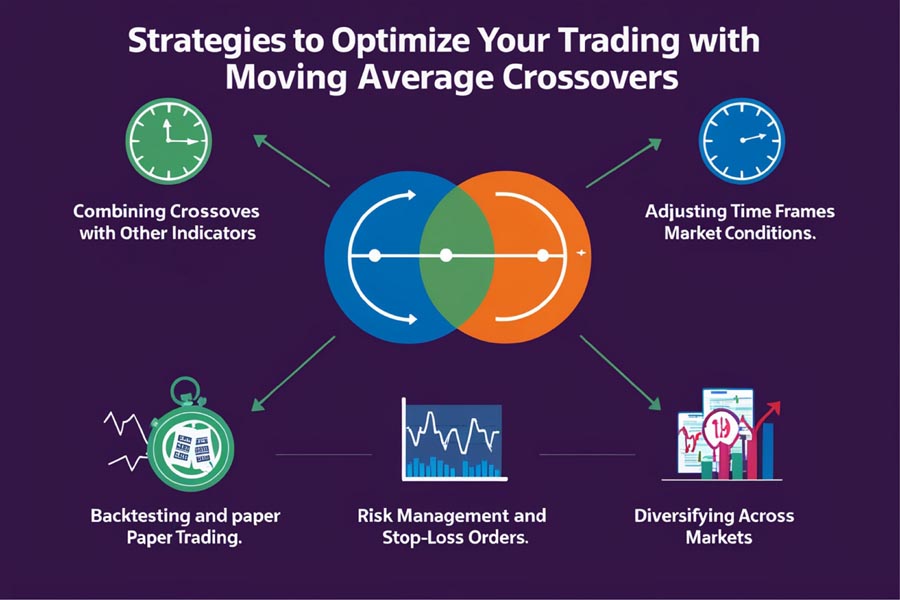
1. Combining Crossovers with Other Indicators
To increase the reliability of crossover signals, consider combining them with other technical indicators such as the Relative Strength Index (RSI), Moving Average Convergence Divergence (MACD), or Bollinger Bands. This multi-faceted approach can help confirm signals and reduce the chances of false positives.
2. Adjusting Time Frames Based on Market Conditions
Different market conditions require different strategies. For instance, in a volatile market, shorter time frames (e.g., using a 10-day and 20-day moving average) might be more appropriate. In contrast, in a stable, trending market, longer time frames (e.g., 50-day and 200-day) could offer more reliable signals.
3. Backtesting and Paper Trading
Before committing real money, backtest your moving average crossover strategy against historical data. This allows you to see how well the strategy would have performed in the past, giving you confidence in its potential future success. Additionally, consider paper trading with your strategy in a simulated environment to fine-tune your approach without risking capital.
4. Risk Management and Stop-Loss Orders
Incorporate stop-loss orders in your strategy to manage risk effectively. For example, if you’re trading based on a Golden Cross signal, place a stop-loss below the recent low. This approach ensures that even if the market reverses, your losses are limited.
5. Diversifying Across Markets
Moving average crossovers are not limited to a single market. They work across various asset classes, including stocks, forex, commodities, and cryptocurrencies. Diversifying your crossover strategy across different markets can spread risk and increase your chances of capturing profitable trends.
Read More: 200 day moving average trading strategies
Optimizing Your Trading Experience with ASIC Regulated OpoFinance Broker
When trading using strategies like the 20, 50, and 200 day moving average crossover, the right broker can make all the difference. OpoFinance stands out as a reliable choice for traders seeking an ASIC-regulated platform with top-tier services.
Why Choose OpoFinance?
- Regulation and Security: OpoFinance is regulated by the Australian Securities and Investments Commission (ASIC), ensuring a high standard of security and transparency. This regulation provides traders with peace of mind, knowing their investments are protected under stringent regulatory standards.
- User-Friendly Platform: The OpoFinance trading platform is designed to cater to both beginners and experienced traders. It offers intuitive tools and features that simplify the implementation of strategies like moving average crossovers, making your trading experience smoother and more efficient.
- Competitive Spreads and Fees: OpoFinance is known for its competitive spreads and low trading fees, which can significantly impact your overall profitability. With their transparent fee structure, you can avoid hidden costs and maintain control over your trading expenses.
- Social Trading Features: For those who prefer a more hands-off approach, OpoFinance’s social trading service is an excellent option. This feature allows you to follow and copy the strategies of successful traders, making it easier to implement complex strategies like moving average crossovers without extensive experience.
- Advanced Charting Tools: OpoFinance offers advanced charting tools that can help you analyze moving average crossovers and other indicators with greater precision. These tools are essential for conducting thorough technical analysis and making informed trading decisions.
Conclusion
The 20, 50, and 200 day moving average crossover is a powerful tool in any trader’s arsenal, providing clear and actionable signals that can guide your trading decisions. By understanding how these crossovers work and applying them effectively, you can enhance your ability to identify trends, manage risks, and time your trades more accurately.
Incorporate these moving average strategies into your trading plan, and consider utilizing a reliable broker like OpoFinance to optimize your trading experience. With its ASIC regulation, user-friendly platform, and advanced features, OpoFinance is well-equipped to support your trading endeavors.
Whether you’re a seasoned trader or just starting, mastering the moving average crossover strategy can significantly impact your trading success. Start exploring these techniques today and see how they can help you navigate the markets more effectively.
How does the 20-day moving average crossover with the 200-day moving average compare to the 50-day and 200-day crossover in terms of reliability?
The 20-day and 200-day moving average crossover can offer early signals of trend changes but may be less reliable compared to the 50-day and 200-day crossover. The 50-day and 200-day crossover is generally considered more reliable due to its longer-term perspective, providing stronger signals of long-term trends.
Can moving average crossovers be used in combination with other indicators to improve their effectiveness?
Yes, combining moving average crossovers with other technical indicators, such as the RSI or MACD, can enhance their effectiveness. This approach helps confirm signals and reduce the likelihood of false positives, leading to more informed trading decisions.
What are some common pitfalls to avoid when using moving average crossovers in trading?
Common pitfalls include relying solely on crossover signals without considering the overall market context and ignoring other indicators. Additionally, traders may encounter issues with lagging signals, as moving averages are based on past price data and may not always reflect current market conditions accurately.


3 Responses
Your style is so unique compared to many other people. Thank you for publishing when you have the opportunity,Guess I will just make this bookmarked.2
Good news for all us
from a printed book, reproduction