

When the 20-day moving average crosses above the 200-day moving average, it forms a Golden Cross, signaling a potential long-term bullish trend in an asset’s price. This crossover typically indicates that short-term momentum is outpacing the long-term trend, often marking the beginning of a significant uptrend. Working with a trusted forex trading broker can help you effectively capitalize on such market opportunities.
The Golden Cross is a powerful tool for unlocking profits because it combines short-term momentum with long-term trend confirmation. Traders can potentially capitalize on this signal by entering long positions or holding existing ones, as it often precedes extended periods of price appreciation. However, like all technical indicators, it’s not foolproof and should be used in conjunction with other analysis tools and risk management strategies.
In this comprehensive guide, we’ll explore how to master the Golden Cross, detailing its mechanics, significance, and practical applications. We’ll delve into strategies for leveraging this indicator in your trading, discuss its limitations, and provide real-world examples of its effectiveness. By understanding the nuances of the Golden Cross, traders can enhance their market analysis toolkit and potentially improve their ability to identify and profit from major trend changes in various financial markets.
Read More: 20, 50 and 200 day moving average crossover
Understanding Moving Averages
What are Moving Averages?
Moving averages are essential tools in technical analysis that smooth out price data over a specified period, creating a single flowing line. This line helps traders identify trends and potential support or resistance levels. By eliminating short-term fluctuations, moving averages provide a clearer picture of the overall price trend, making it easier for traders to make informed decisions.
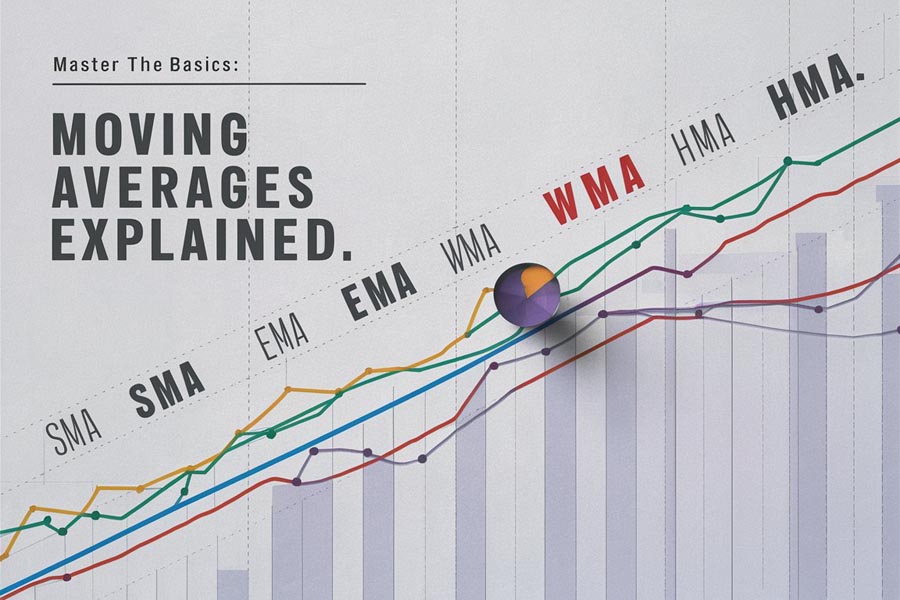
Types of Moving Averages
- Simple Moving Average (SMA): Calculates the average price over a specific number of periods. It’s straightforward and widely used, giving equal weight to all price points within the selected timeframe.
- Exponential Moving Average (EMA): Gives more weight to recent prices, making it more responsive to new information. This characteristic allows EMAs to react faster to price changes, potentially providing earlier signals than SMAs.
- Weighted Moving Average (WMA): Assigns higher weights to more recent data points, falling between SMA and EMA in terms of responsiveness.
- Hull Moving Average (HMA): A relatively new type that aims to reduce lag while maintaining smoothness, potentially offering faster and more accurate signals.
The 20-Day and 200-Day Moving Averages
- 20-Day Moving Average: Represents short-term trends and is more sensitive to recent price changes. It’s often used by traders to identify short-term momentum and potential entry or exit points.
- 200-Day Moving Average: Reflects long-term trends and is less affected by short-term price fluctuations. Institutional investors and long-term traders often use this as a key indicator of overall market health and trend direction.
Significance in Different Time Frames
Understanding how these moving averages behave across different time frames is crucial:
- Intraday Trading: Shorter moving averages (e.g., 5-day and 20-day) might be more relevant.
- Swing Trading: The 20-day and 50-day moving averages often come into play.
- Long-term Investing: The 50-day and 200-day moving averages are commonly used benchmarks.
Read More: 50 200 day moving average crossover strategy
The Golden Cross: When 20-Day MA Crosses 200-Day MA
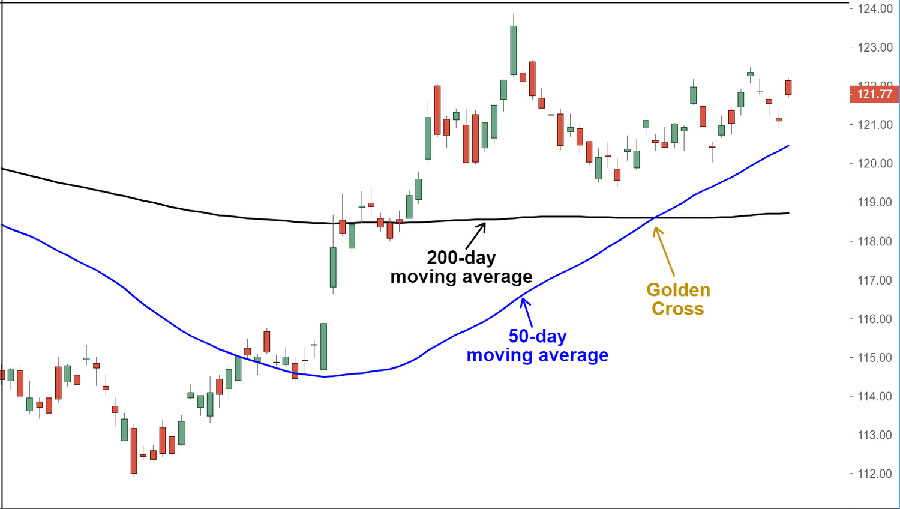
What is a Golden Cross?
A Golden Cross occurs when the shorter-term 20-day moving average crosses above the longer-term 200-day moving average. This event is often interpreted as a bullish signal, indicating a potential uptrend in the asset’s price. The term “Golden Cross” reflects the perceived value and importance of this signal in technical analysis.
The Mechanics Behind the Cross
- Trend Confirmation: The cross suggests that short-term momentum is outpacing long-term momentum, potentially indicating a shift in market sentiment and direction.
- Psychological Impact: Many traders view this as a buy signal, potentially creating a self-fulfilling prophecy. As more traders act on the signal, it can reinforce the upward price movement.
- Institutional Interest: Large institutions often use this indicator, adding to its significance. When major players in the market act on these signals, it can lead to substantial price movements.
- Lagging vs. Leading Indicator: While the Golden Cross is technically a lagging indicator (as it’s based on past price data), its ability to confirm trend changes gives it some predictive qualities.
Historical Significance
The Golden Cross has been a part of technical analysis for decades. Its popularity grew significantly in the mid-20th century as more traders gained access to charting tools and data. Notable historical instances where the Golden Cross accurately predicted major bull markets include:
- The start of the bull market in 1950 that lasted until the 1970s.
- The beginning of the 1980s bull market that culminated in the dot-com boom.
- The recovery from the 2008 financial crisis, signaling the start of the longest bull market in U.S. history.
Read More: 200 day moving average trading strategies
Interpreting the 20-Day MA Crossing the 200-Day MA
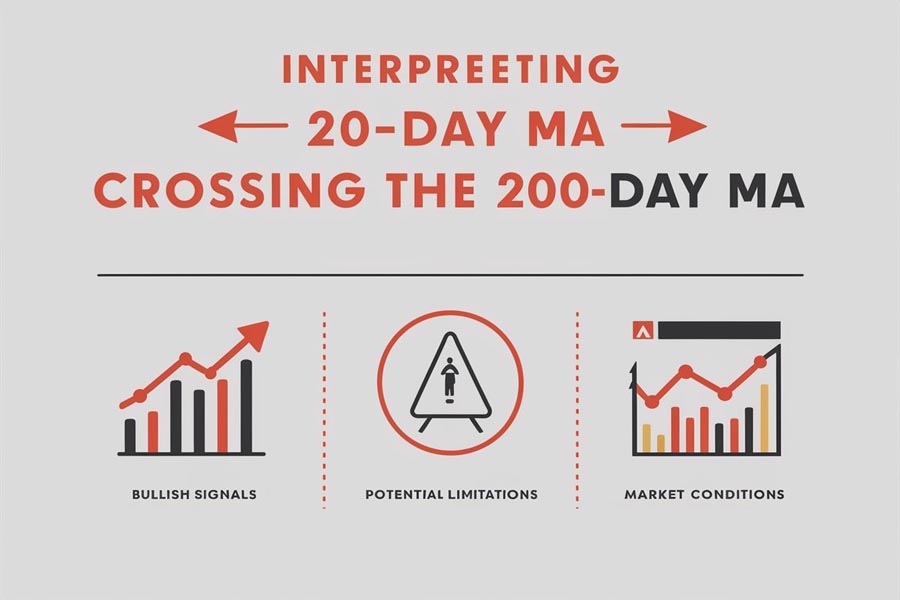
Bullish Signals
- Trend Reversal: Can indicate the end of a downtrend and the beginning of an uptrend. This is particularly significant when it occurs after a prolonged bearish period.
- Momentum Confirmation: Reinforces existing bullish momentum, potentially signaling the continuation of an uptrend.
- Support Level: The 200-day MA often becomes a support level after the cross, providing a potential “floor” for future price movements.
- Volume Confirmation: A Golden Cross accompanied by increasing trading volume can be a stronger indicator of a genuine trend change.
Potential Limitations
- False Signals: Not all crosses result in significant trend changes. Market noise or short-term volatility can sometimes create false signals.
- Lagging Indicator: Based on historical data, which may not predict future movements accurately. By the time the cross occurs, a significant portion of the price move may have already happened.
- Market Context: Should be used in conjunction with other indicators and market analysis. Factors such as overall market conditions, sector trends, and fundamental analysis should be considered.
- Whipsaws: In choppy or sideways markets, the 20-day and 200-day MAs may cross frequently, leading to multiple false signals.
Interpreting in Different Market Conditions
- Bull Markets: Golden Crosses may be more reliable and indicate stronger continuation signals.
- Bear Markets: While less common, Golden Crosses can signal potential trend reversals or significant relief rallies.
- Sideways Markets: Crosses may be less reliable and require additional confirmation from other indicators.
Strategies for Trading the Golden Cross
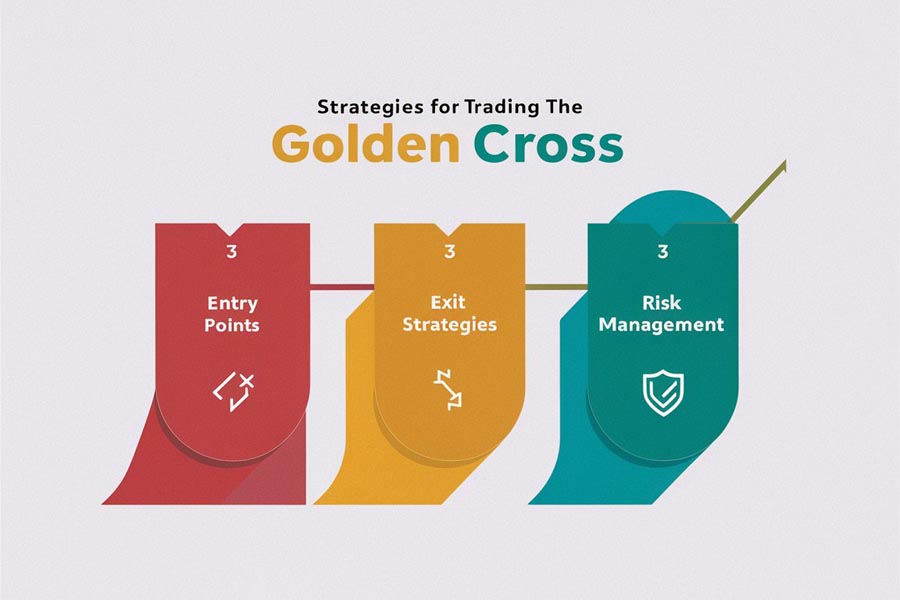
Entry Points
- Immediate Entry: Enter a long position as soon as the cross occurs. This approach aims to capture the full potential of the trend but may expose traders to false signals.
- Pullback Entry: Wait for a price pullback to the 20-day MA before entering. This strategy aims to enter at a more favorable price but risks missing part of the move if the pullback doesn’t occur.
- Volume Confirmation: Look for increased volume to confirm the strength of the signal. Higher volume during the cross can indicate stronger conviction in the trend change.
- Breakout Confirmation: Wait for the price to break above a key resistance level following the Golden Cross before entering.
Exit Strategies
- Death Cross: Exit when the 20-day MA crosses below the 200-day MA, signaling a potential trend reversal.
- Trailing Stop: Use a trailing stop to lock in profits as the trend continues. This can be based on a fixed percentage or a technical indicator like the Average True Range (ATR).
- Time-Based Exit: Set a predetermined holding period based on your trading style. This could range from several weeks for swing traders to months or years for long-term investors.
- Profit Target: Set a specific profit target based on historical price movements or key resistance levels.
Adapting to Different Asset Classes
- Stocks: The Golden Cross can be particularly effective for individual stocks, especially when combined with sector analysis and overall market trends.
- Indices: Often provides reliable signals for major market indices, reflecting broader economic trends.
- Forex: Can be adapted to currency pairs, though it’s important to consider interest rate differentials and economic factors.
- Commodities: May work well for trending commodities but should be used cautiously in cyclical or seasonally affected markets.
Risk Management When Trading the Golden Cross
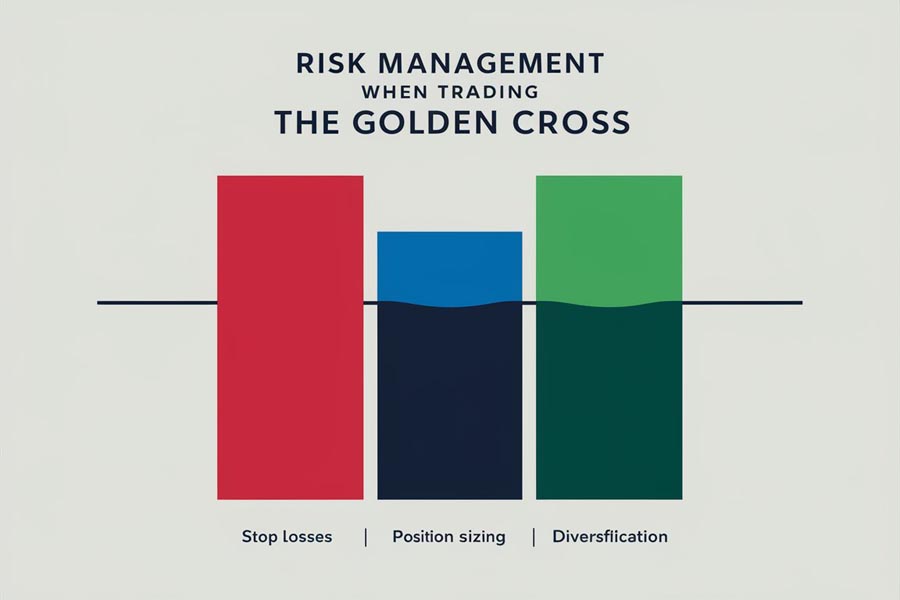
Setting Stop Losses
- Below the 200-Day MA: Place stops slightly below the 200-day MA for trend-following trades. This allows for some price fluctuation while still protecting against significant reversals.
- Volatility-Based Stops: Use indicators like Average True Range (ATR) to set dynamic stop losses. This approach adapts to the asset’s current volatility levels.
- Percentage-Based Stops: Set stops at a fixed percentage below the entry point, based on your risk tolerance and the asset’s typical price movements.
- Support Level Stops: Place stops below key support levels identified through other technical analysis methods.
Position Sizing
- Fixed Percentage: Risk a fixed percentage of your trading capital on each trade. This helps maintain consistent risk across different trades.
- Scaled Entries: Enter positions in stages to average your entry price and reduce risk. This can be particularly useful in volatile markets.
- Risk-Reward Ratio: Size positions based on the potential reward relative to the risk, aiming for a favorable ratio (e.g., 1:2 or 1:3).
- Volatility-Adjusted Sizing: Adjust position sizes based on the asset’s current volatility, taking smaller positions in highly volatile conditions.
Managing Multiple Positions
- Correlation Analysis: Be aware of correlations between different assets to avoid overexposure to a single trend.
- Portfolio Heat: Monitor the overall risk of your portfolio, ensuring that no single trade or correlated group of trades poses excessive risk.
Opofinance Services: Empowering Your Trading Journey
Opofinance, an ASIC-regulated broker, offers a comprehensive suite of tools and services to help traders capitalize on powerful signals like the Golden Cross. With their advanced trading platforms, educational resources, and expert support, Opofinance empowers traders to make informed decisions and execute strategies with confidence.
Their innovative social trading feature allows you to follow and copy successful traders, potentially benefiting from their expertise in identifying and trading Golden Cross opportunities. This can be particularly valuable for newer traders looking to learn from experienced market participants.

Opofinance provides:
- Advanced charting tools with customizable moving averages and other technical indicators
- Real-time market data and analysis
- Risk management features to help implement stop-loss and take-profit strategies
- Educational webinars and tutorials on technical analysis, including moving average strategies
- 24/7 customer support to assist with platform navigation and trading queries
Whether you’re a novice or an experienced trader, Opofinance provides the resources and support you need to navigate the complexities of the financial markets and potentially profit from strategies like the Golden Cross.
Conclusion
The 20-day moving average crossing the 200-day moving average, known as the Golden Cross, is a powerful technical indicator that has stood the test of time. By understanding its mechanics, interpreting its signals, and implementing sound risk management strategies, traders can harness the potential of this indicator to identify significant trend changes and potentially profitable trading opportunities.
Remember, while the Golden Cross can be a valuable tool in your trading arsenal, it should always be used in conjunction with other forms of analysis and within the context of a well-rounded trading strategy. The financial markets are complex and influenced by a multitude of factors, so relying on any single indicator alone is rarely advisable.
As you incorporate the Golden Cross into your trading approach, keep these key points in mind:
- Context is crucial: Always consider the broader market environment, sector trends, and fundamental factors alongside the Golden Cross signal.
- Risk management is non-negotiable: No matter how strong a Golden Cross signal appears, always adhere to sound risk management principles to protect your capital.
- Continuous learning: The markets are ever-evolving, so stay informed about new techniques, variations, and applications of the Golden Cross strategy.
- Personalization is key: Adapt the Golden Cross strategy to fit your trading style, risk tolerance, and the specific characteristics of the assets you trade.
- Patience and discipline: Successful trading with the Golden Cross often requires the patience to wait for clear signals and the discipline to stick to your trading plan.
By mastering the nuances of the Golden Cross and integrating it thoughtfully into your trading strategy, you can potentially enhance your ability to identify and capitalize on significant market trends. Whether you’re a day trader looking for short-term opportunities or a long-term investor seeking to optimize entry and exit points, the Golden Cross remains a valuable tool in the modern trader’s toolkit.
How reliable is the Golden Cross as a trading signal?
The Golden Cross is generally considered reliable, but its effectiveness varies depending on market conditions and the specific asset. It’s most reliable in trending markets and when used with other indicators. No signal is 100% accurate, so always use proper risk management.
Can the Golden Cross be used for short-term trading?
While traditionally used for longer-term trends, the Golden Cross can be adapted for shorter timeframes. Short-term traders might use faster moving averages (e.g., 5-day and 50-day) for more frequent signals. However, this may increase false positives, so additional confirmation becomes crucial.
In which markets is the Golden Cross most effective?
The Golden Cross is applicable across various markets, including stocks, indices, commodities, and cryptocurrencies. It’s particularly effective in trending equity markets and for major stock indices. Its effectiveness can vary, so it’s important to test and adapt the strategy for each specific market or asset you’re trading.


