

In the dynamic world of financial markets, traders are constantly seeking reliable tools to guide their investment decisions. Among these, the 200-day moving average stands out as a cornerstone of technical analysis. This powerful indicator has been a staple for both novice and seasoned traders, offering valuable insights into long-term market trends and potential turning points. By working with a regulated forex broker, traders can confidently apply this trusted tool, ensuring a secure and transparent environment for executing their strategies.

The 200 day moving average trading strategies are a set of techniques that use this key indicator to identify optimal entry and exit points, manage risk, and capitalize on market momentum. By smoothing out price fluctuations over a substantial period, these strategies provide a clear picture of the overall market direction, helping traders make informed decisions in various market conditions.
In this comprehensive guide, we’ll delve deep into seven proven 200 day moving average trading strategies that can potentially boost your trading performance. Whether you’re a day trader looking for additional confirmation or a long-term investor seeking to ride major trends, these strategies offer valuable tools to enhance your trading arsenal.
Understanding the 200 Day Moving Average
Before we dive into specific strategies, let’s establish a solid foundation by understanding what the 200 day moving average is and why it’s so significant in trading.
What is the 200 Day Moving Average?
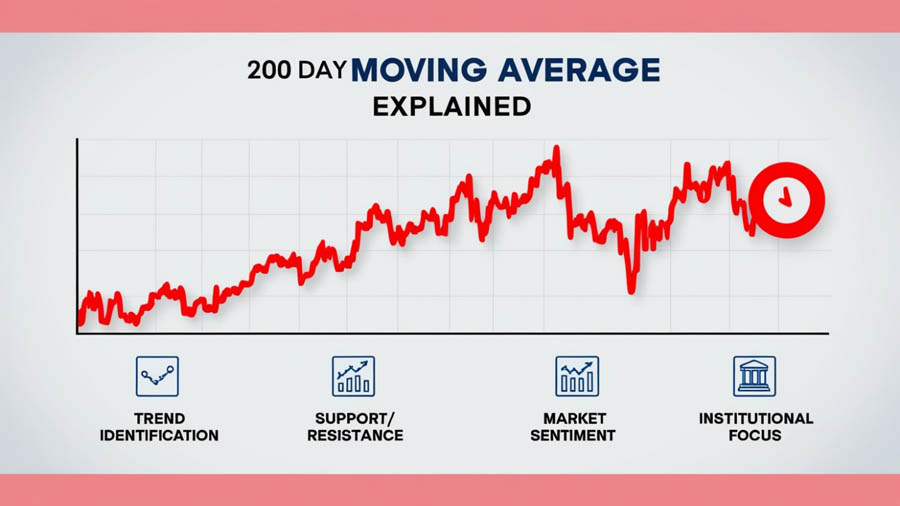
The 200 day moving average (200 DMA) is a technical indicator that calculates the average closing price of an asset over the past 200 trading days. This long-term moving average is widely regarded as a key indicator of overall market trends and sentiment.
Why is it Important?
The 200 DMA is crucial for several reasons:
- Trend Identification: It helps traders identify the long-term trend of an asset.
- Support and Resistance: Often acts as a dynamic support or resistance level.
- Market Sentiment: Crossing above or below the 200 DMA can signal shifts in market sentiment.
- Institutional Focus: Many large institutions and fund managers use the 200 DMA in their decision-making process.
Now that we’ve covered the basics, let’s explore seven powerful 200 day moving average trading strategies that can potentially elevate your trading game.
Strategy 1: The Golden Cross
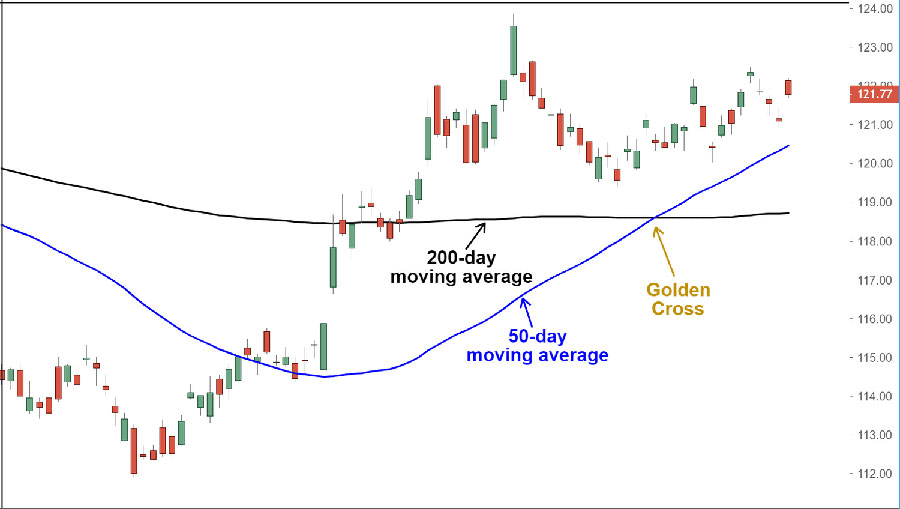
The Golden Cross is one of the most popular and widely recognized 200 day moving average trading strategies. This strategy involves watching for the intersection of a shorter-term moving average, typically the 50-day moving average, with the 200 DMA.
How it Works:
- When the 50-day moving average crosses above the 200 DMA, it signals a potential bullish trend. This is known as the Golden Cross.
- Conversely, when the 50-day moving average crosses below the 200 DMA (known as a Death Cross), it indicates a potential bearish trend.
- Traders often use these crossovers as signals to enter or exit positions, or to adjust their overall market bias.
Why it’s Effective:
The Golden Cross strategy is particularly effective because it combines short-term momentum (represented by the 50-day moving average) with long-term trend confirmation (the 200 DMA). This confluence of indicators can provide strong signals for potential trend reversals or continuations.
Moreover, the Golden Cross often attracts significant attention from traders and investors, potentially leading to increased buying pressure and a self-fulfilling prophecy. However, it’s important to note that like all technical indicators, it’s not foolproof and should be used in conjunction with other forms of analysis.
Read More: The Ultimate Guide to 20 50 and 200 Day Moving Average Crossover
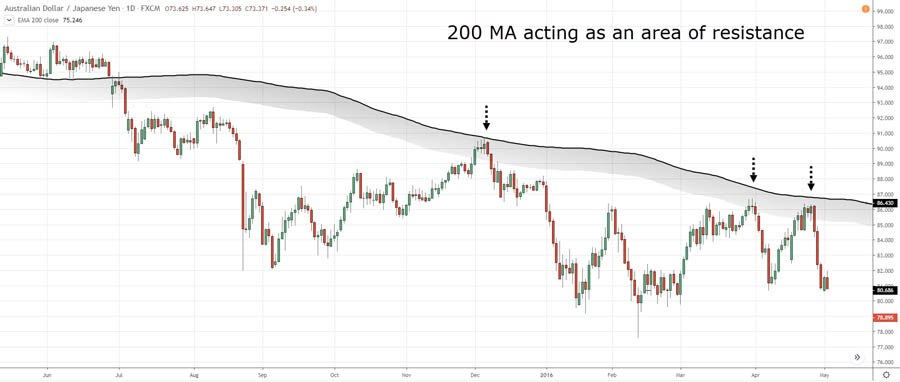
Strategy 2: The Bounce Play
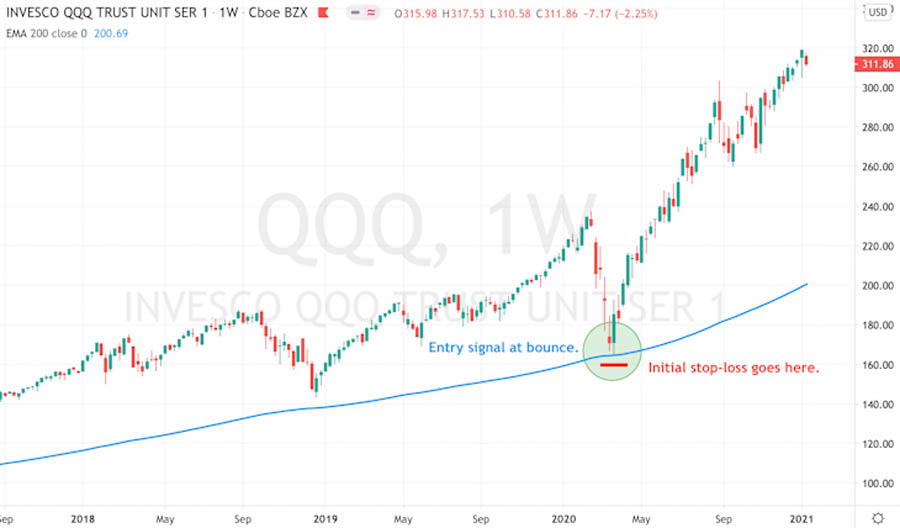
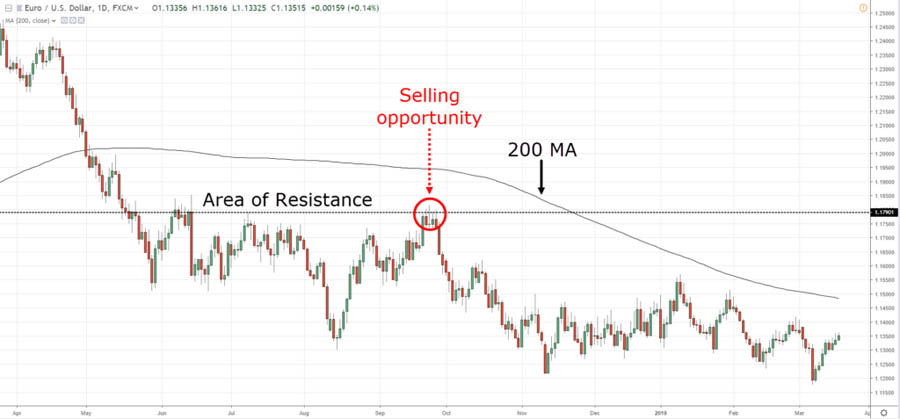
The Bounce Play strategy capitalizes on the tendency of prices to “bounce” off the 200 DMA when it acts as a support or resistance level.
How it Works:
- Identify when the price of an asset approaches the 200 DMA from above or below.
- Look for signs of price rejection or “bouncing” off this level. This could include candlestick patterns like hammers or shooting stars, or other technical indicators showing oversold or overbought conditions.
- Enter a trade in the direction of the bounce, with a stop-loss just beyond the 200 DMA.
- Set a profit target based on previous swing highs or lows, or use a trailing stop to capture potential trend continuation.
Why it’s Effective:
This strategy takes advantage of the psychological importance many traders place on the 200 DMA. The level often acts as a self-fulfilling prophecy, with enough traders expecting a bounce to actually create one.
The Bounce Play can be particularly effective in strong trending markets, where the 200 DMA acts as a dynamic support or resistance level. It allows traders to enter with the trend at a potentially advantageous price point, offering a favorable risk-to-reward ratio.
Strategy 3: The Trend Confirmation
The Trend Confirmation strategy uses the 200 DMA as a filter to ensure you’re trading in the direction of the long-term trend.
How it Works:
- Only take long positions when the price is above the 200 DMA.
- Only take short positions when the price is below the 200 DMA.
- Use other indicators or chart patterns for specific entry signals, such as breakouts, pullbacks, or momentum indicators.
- Adjust your position sizing based on the strength of the trend (e.g., how far the price is from the 200 DMA).
Why it’s Effective:
By aligning your trades with the long-term trend indicated by the 200 DMA, you increase the probability of successful trades. This strategy helps avoid the pitfall of fighting against the overall market direction.
The Trend Confirmation strategy can be particularly useful for swing traders and position traders who aim to capture larger market moves. It helps filter out noise and keeps traders focused on the bigger picture, potentially leading to more consistent results over time.
Strategy 4: The Breakout Confirmation
The Breakout Confirmation strategy uses the 200 DMA to validate potential breakouts from key chart patterns or price levels.
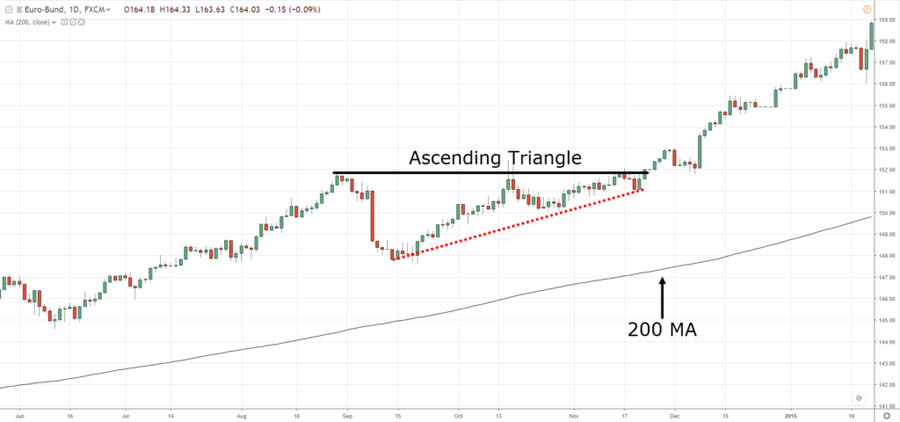
How it Works:
- Identify a potential breakout setup (e.g., from a triangle pattern, a key resistance level, or a long-term range).
- Confirm that the breakout occurs in the same direction as the 200 DMA trend. For example, an upside breakout is more likely to succeed if the price is already above the 200 DMA.
- Enter the trade if the breakout is confirmed and aligns with the 200 DMA trend.
- Set a stop-loss below the breakout level for long trades, or above it for short trades.
- Consider using the distance of the pattern for setting profit targets, or use a trailing stop to capture extended moves.
Why it’s Effective:
By combining chart pattern analysis with the long-term trend indicated by the 200 DMA, this strategy helps filter out false breakouts and increases the probability of successful trades.
Breakouts that occur in the direction of the long-term trend (as indicated by the 200 DMA) are more likely to result in sustained moves. This strategy helps traders focus on high-probability setups and avoid getting caught in false breakouts or range-bound markets.
Strategy 5: The Moving Average Convergence Divergence (MACD) Crossover
This strategy combines the power of the 200 DMA with the popular MACD indicator for enhanced trend confirmation.
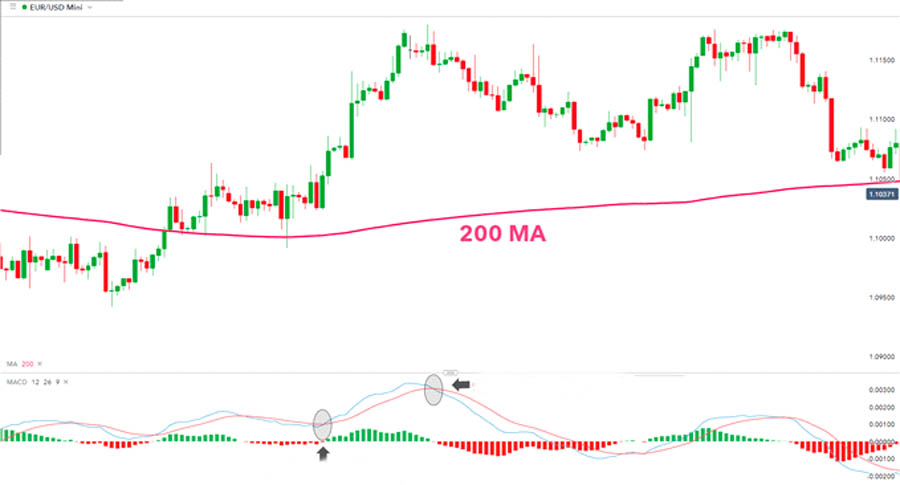
How it Works:
- Ensure the price is above the 200 DMA for long trades (or below for short trades).
- Wait for a bullish MACD crossover (MACD line crosses above the signal line) for long trades.
- For short trades, look for a bearish MACD crossover when price is below the 200 DMA.
- Enter the trade when both conditions are met (price position relative to 200 DMA and MACD crossover).
- Set stop-losses based on recent swing lows for long trades, or swing highs for short trades.
- Consider using the MACD histogram for exit signals, such as when it starts to decrease in a long trade.
Read More: Trading the Golden Cross: 20 day moving average crosses 200 day moving average
Why it’s Effective:
The MACD Crossover strategy provides an additional layer of confirmation to the trend indicated by the 200 DMA. This combination of indicators can help identify high-probability trade setups with strong momentum.
By using the MACD, which is a trend-following momentum indicator, in conjunction with the 200 DMA, traders can potentially identify not just the direction of the trend, but also its strength and potential turning points.
Strategy 6: The Pullback Strategy
The Pullback Strategy aims to capitalize on temporary price retracements within a strong trend.
How it Works:
- Identify a strong trend using the 200 DMA (price well above or below the average).
- Wait for a pullback towards the 200 DMA. This could be a direct move towards the average, or a series of lower highs in an uptrend (or higher lows in a downtrend).
- Look for signs of the pullback ending and the main trend resuming. This could include candlestick patterns, oversold/overbought indicators, or volume analysis.
- Enter a trade in the direction of the original trend when the price shows signs of resuming that trend.
- Place a stop-loss below the recent low for long trades, or above the recent high for short trades.
- Set profit targets based on previous swing points or use a trailing stop to capture extended moves.
Why it’s Effective:
This strategy allows traders to enter strong trends at more favorable price levels. By waiting for pullbacks to the 200 DMA, traders can potentially achieve better risk-to-reward ratios on their trades.
The Pullback Strategy is based on the principle that trends often move in a series of waves, with periods of retracement followed by continuation. By entering during these retracements, traders can position themselves advantageously for the next wave in the trend direction.
Strategy 7: The Volume-Confirmed Crossover
This strategy combines the 200 DMA crossover with volume analysis for increased reliability.
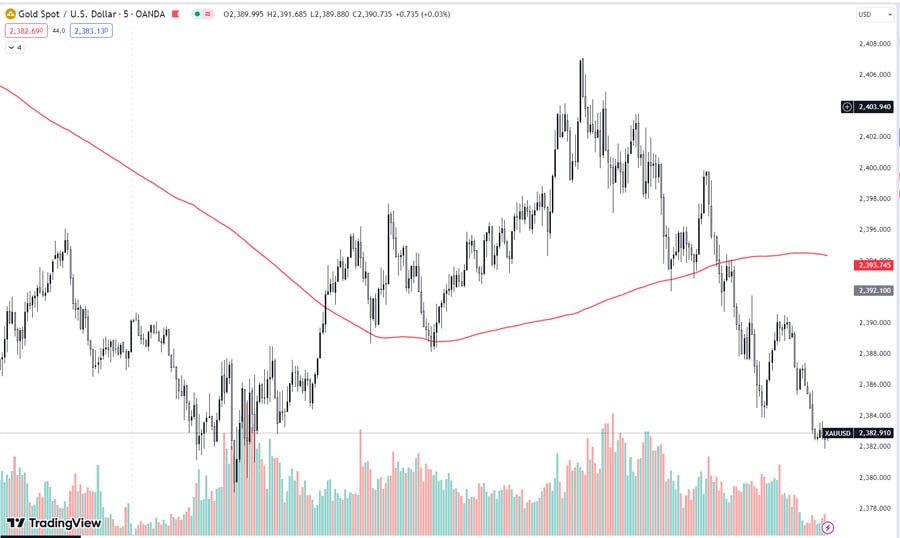
How it Works:
- Look for a crossover of the price or a shorter-term moving average with the 200 DMA.
- Confirm the crossover with a significant increase in trading volume. The volume should be noticeably higher than the average volume over the past several periods.
- Enter the trade in the direction of the crossover if volume confirms the move.
- Set a stop-loss below recent support for long trades, or above recent resistance for short trades.
- Consider using volume analysis for exit signals as well, such as a decrease in volume as the price approaches potential resistance or support levels.
Why it’s Effective:
Volume is a crucial indicator of the strength behind price movements. By incorporating volume analysis into 200 DMA crossover signals, traders can filter out weak or false signals and focus on high-probability setups.
The theory behind this strategy is that significant trend changes are often accompanied by increased trading activity. By confirming 200 DMA crossovers with volume, traders can have more confidence in the potential for a sustained move in the new direction.
Risk Management in 200 Day Moving Average Trading
While these strategies can be powerful tools, it’s crucial to implement proper risk management techniques:
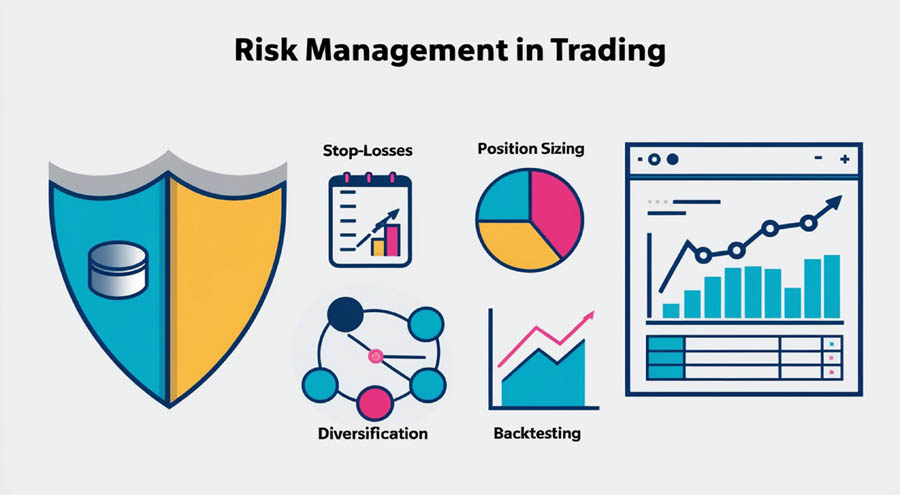
- Use Stop-Losses: Always set stop-loss orders to limit potential losses.
- Position Sizing: Never risk more than a small percentage of your trading capital on any single trade.
- Diversification: Don’t rely solely on 200 DMA strategies; diversify your approach.
- Backtesting: Test these strategies on historical data before implementing them with real money.
Common Pitfalls to Avoid
Even with solid strategies, traders can fall into common traps:
- Overtrading: Don’t force trades; wait for clear signals.
- Ignoring Fundamentals: While technical analysis is powerful, don’t completely ignore fundamental factors.
- Lack of Patience: The 200 DMA is a long-term indicator; give your trades time to develop.
- Failing to Adapt: Markets change; be prepared to adjust your strategies as needed.
Opofinance Services: Your Trusted ASIC-Regulated Broker
When implementing these 200 day moving average trading strategies, having a reliable and regulated broker is crucial. Opofinance, an ASIC-regulated broker, offers a comprehensive suite of services tailored to both novice and experienced traders. With advanced trading platforms, competitive spreads, and a wide range of tradable assets, Opofinance provides the tools and support you need to execute your 200 DMA strategies effectively.
Opofinance’s commitment to security, transparency, and customer service makes it an excellent choice for traders looking to capitalize on the power of 200 day moving average strategies. Their educational resources and expert market analysis can further enhance your trading journey, helping you make informed decisions in line with your chosen strategies.
Conclusion
The 200 day moving average is a powerful tool in any trader’s arsenal, offering valuable insights into long-term market trends and potential turning points. By incorporating these seven strategies into your trading approach, you can potentially enhance your ability to identify profitable opportunities and manage risk effectively.
Remember, successful trading is not just about having good strategies; it’s about consistent application, ongoing learning, and adapting to changing market conditions. As you implement these 200 day moving average trading strategies, continue to refine your approach, stay disciplined, and always prioritize risk management.
Read More: Unlock the Power of the 50 200 Day Moving Average Crossover Strategy
With practice and patience, these strategies can become valuable components of your overall trading plan, helping you navigate the complex world of financial markets with greater confidence and potential for success.
References:
- Murphy, John J. 2009 “Technical Analysis of the Financial Markets: A Comprehensive Guide to Trading Methods and Applications” New York Institute of Finance (Book – no direct link available) This source is valuable because John Murphy is a renowned expert in technical analysis, and his book provides comprehensive coverage of moving averages and their application in trading strategies.
- Investopedia 2021 “Golden Cross Definition” Investopedia https://www.investopedia.com/terms/g/goldencross.asp Investopedia is a reliable source for financial information and terminology. This article specifically discusses the Golden Cross strategy mentioned in your article, providing additional context and explanation.
- Brock, W., Lakonishok, J., & LeBaron, B. 1992 “Simple Technical Trading Rules and the Stochastic Properties of Stock Returns” The Journal of Finance https://onlinelibrary.wiley.com/doi/abs/10.1111/j.1540-6261.1992.tb04681.x This academic paper is a seminal work in the field of technical analysis, providing empirical evidence on the effectiveness of moving average strategies. It adds scientific credibility to the discussion of moving average trading strategies.
Can the 200 day moving average be used for short-term trading?
While the 200 day moving average is primarily a long-term indicator, it can still be valuable for short-term traders. It provides context for the overall market trend, which can be crucial even in shorter timeframes. Short-term traders can use the 200 DMA as a reference point for market sentiment and combine it with shorter-term indicators for more precise entry and exit points.
How often should I recalculate the 200 day moving average?
Most charting platforms and trading software automatically recalculate the 200 day moving average with each new price data point. If you’re calculating it manually, it’s best to update it daily for the most accurate representation of the current market trend. Remember, the 200 DMA is a dynamic indicator that changes over time, reflecting the most recent 200 days of price action.
Are there any specific markets where 200 day moving average strategies work best?
The 200 day moving average can be effective across various markets, including stocks, forex, commodities, and cryptocurrencies. However, it tends to be most reliable in markets with high liquidity and clear long-term trends. It’s particularly popular in stock market analysis, where institutional investors often use it as a key reference point. That said, the effectiveness can vary depending on the specific asset and market conditions, so it’s always important to backtest and adapt your strategies to the particular market you’re trading.


