Mastering the art of swing trading in 2024 requires a solid understanding of the support and resistance swing trading strategy. This strategy focuses on identifying key price levels where the market tends to reverse or consolidate, giving traders a higher probability of successful trades. Support and resistance levels represent areas where buying and selling pressures are at equilibrium, allowing traders to predict potential market movements. By learning how to effectively trade these levels, you can significantly improve your trading results, especially in volatile markets. This article covers 7 proven support and resistance swing trading strategies that have been consistently successful, whether you’re trading stocks, cryptocurrencies, or forex.

Swing trading stands out as an ideal approach for those who prefer a more calculated, less intense trading style, holding positions for days or weeks rather than minutes. When combined with support and resistance strategies, swing trading can maximize gains and minimize risk. These methods are highly relevant for traders in 2024, and with the right forex broker, you can ensure better execution and tools to refine your trading decisions. This guide will equip you with practical insights to enhance your swing trading skills and help you stay profitable in the ever-evolving financial markets.
What Are Support and Resistance Levels?
A Deeper Dive into Support and Resistance
At its core, support and resistance represents the psychological thresholds where market participants are likely to buy or sell an asset. When an asset’s price falls to a certain level and halts due to a surge in demand, this level is referred to as support. In contrast, when an asset’s price rises and meets significant selling pressure, it hits resistance.
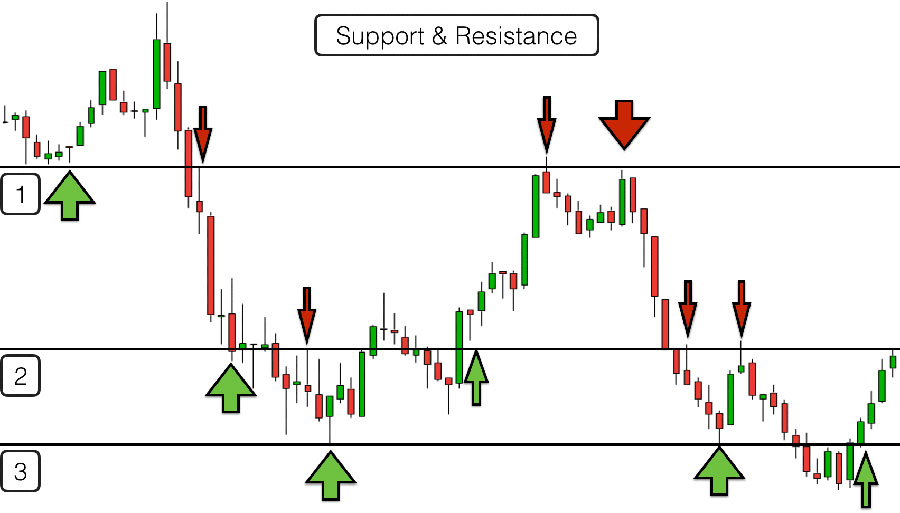
These levels are not just random points on a price chart. Instead, they reflect collective market sentiment, historical price behavior, and trader psychology. Understanding the intricacies of how prices react to support and resistance levels allows traders to anticipate market reversals, consolidations, and potential breakouts, all of which are critical for a successful support and resistance swing trading strategy.
Why Support and Resistance Matters in Swing Trading
In swing trading, timing is everything. Unlike day trading, which focuses on minute-by-minute fluctuations, or long-term investing, which looks at multi-year horizons, swing trading focuses on capitalizing on medium-term price movements, typically lasting from a few days to a few weeks.
By incorporating support and resistance into a swing trading strategy, traders can pinpoint the best moments to enter or exit trades based on the market’s behavior at these key levels. This ensures that trades are executed with a high probability of success, which ultimately increases the overall win rate.
Read More: highest win rate swing trading strategy
7 Essential Support & Resistance Swing Trading Strategies
1. The Bounce Strategy
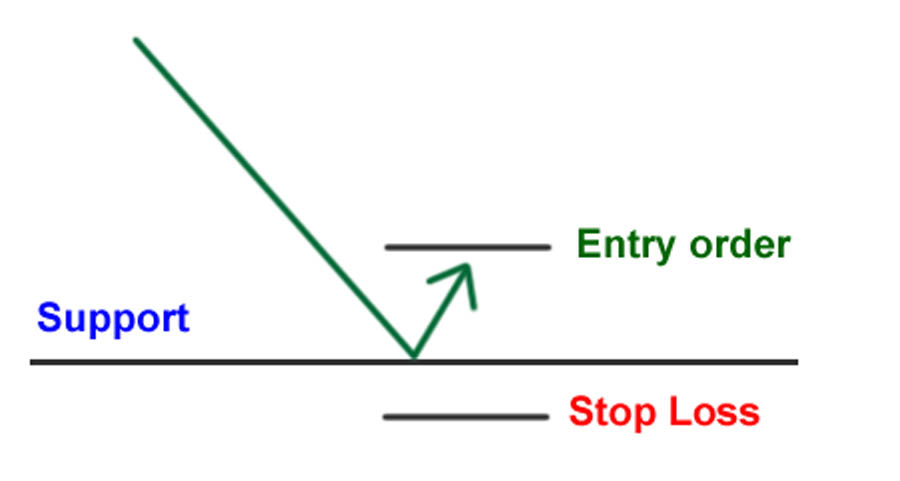
One of the simplest yet most effective ways to trade support and resistance levels is by using the bounce strategy. This approach is based on the premise that, after testing a support or resistance level, prices tend to “bounce” off these levels due to a shift in buying or selling pressure.
How to Execute the Bounce Strategy:
- First, identify key support and resistance levels on your chart. These can be drawn based on historical highs and lows.
- Wait for the price to approach these levels. Rather than entering the trade prematurely, patience is key. You want the price to either test or slightly penetrate the support or resistance level before it bounces back.
- Enter the trade as the price shows signs of reversing off the level. This ensures that the level is holding, increasing the likelihood of a successful trade.
Example: If you’re trading the EUR/USD pair and notice that the price has bounced off a key support level at 1.1800 multiple times, you might enter a buy trade when the price once again bounces off that level, placing a stop loss slightly below the support to minimize risk.
2. The Break and Retest Strategy
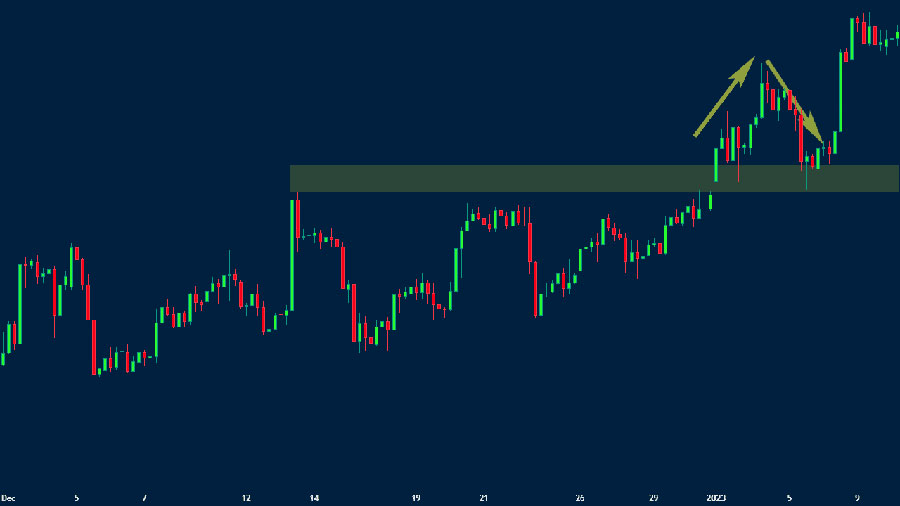
Breakouts are a frequent occurrence in trading, and they often signal the start of strong price trends. The break and retest strategy takes advantage of these breakouts by waiting for the price to retest the level it just broke, offering a more precise entry point.
Key Steps for the Break and Retest Strategy:
- First, watch for a breakout. When the price breaks through a support or resistance level, it can signal the start of a new trend.
- Once the breakout occurs, be patient. The price often retests the level it just broke, giving traders a second chance to enter the trade at a better price.
- Enter the trade as the price retests and begins to move in the direction of the breakout.
This strategy works well in both trending and range-bound markets. In trending markets, breakouts tend to occur more frequently, while in range-bound markets, breakouts often signal a shift in market sentiment.
3. Multiple Timeframe Analysis
Using multiple timeframe analysis allows traders to better understand the broader market context and identify more accurate entry and exit points. This strategy involves analyzing the price action on different timeframes to spot high-probability setups.
Steps for Multiple Timeframe Analysis:
- Start by analyzing support and resistance levels on higher timeframes like the daily or weekly chart. These levels carry more weight as they represent long-term market sentiment.
- Next, move to a lower timeframe, such as the 4-hour or 1-hour chart, to find precise entry points. For example, if you spot a strong resistance level on the daily chart, wait for the price to approach that level on the 1-hour chart, and look for signs of reversal.
- By aligning your trades with key levels on multiple timeframes, you increase the probability of success, as you’re trading in the direction of the broader market trend.
4. Range Trading Strategy
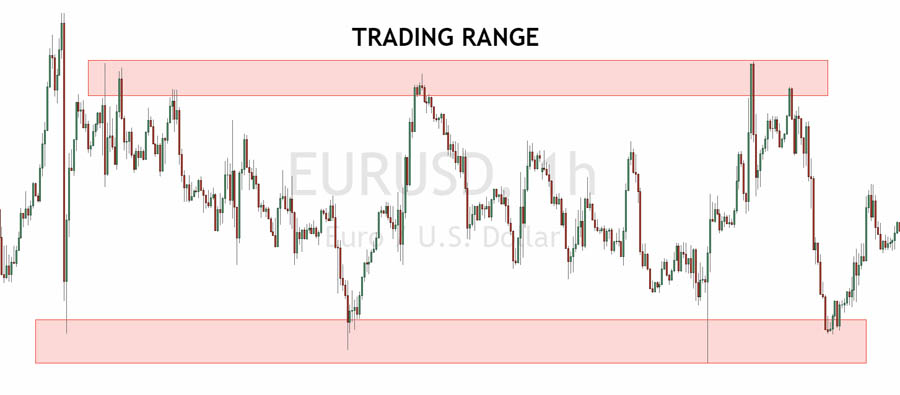
In many cases, markets will consolidate and trade within a defined range, making the range trading strategy a valuable approach for swing traders. This strategy involves buying at support and selling at resistance within the range.
Steps to Trade a Range Market:
- First, identify the range. Look for markets where prices are oscillating between clear support and resistance levels.
- Buy near the support level and sell near the resistance level, capturing profits as the price swings between the two.
- Use oscillators like the RSI or stochastic indicators to confirm overbought or oversold conditions. These indicators can help confirm whether the price is likely to reverse within the range.
Example: In a sideways-moving market like USD/JPY, where the price oscillates between 110.50 (support) and 112.00 (resistance), traders can profit by buying at the lower end of the range and selling at the upper end.
5. Trend Line Strategy
Trend lines are an essential tool for identifying dynamic support and resistance levels in a trending market. By drawing lines connecting higher lows in an uptrend or lower highs in a downtrend, traders can use these lines as guidelines for entering and exiting trades.
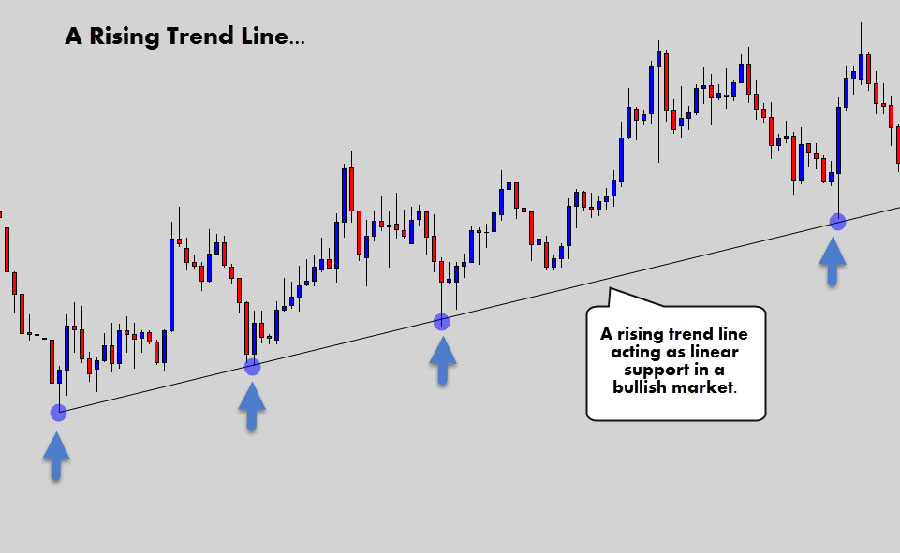
Steps to Implement the Trend Line Strategy:
- Draw trend lines connecting at least two price points on the chart. These points should align with either higher lows (for uptrends) or lower highs (for downtrends).
- When the price approaches the trend line, look for signs of a reversal or continuation. A bounce off the trend line often signals that the trend is likely to continue.
- Combine trend lines with horizontal support and resistance levels to increase the accuracy of your trades. When trend lines converge with horizontal levels, it often indicates a strong price reaction point.
Pro Tip: Use volume analysis alongside trend lines to gauge the strength of the trend. Increasing volume as the price touches the trend line can confirm a strong move.
6. Moving Average Support/Resistance
Moving averages provide dynamic support and resistance levels that change as the price moves. Many traders use moving averages like the 50-day, 100-day, or 200-day to determine key areas where the price is likely to react.
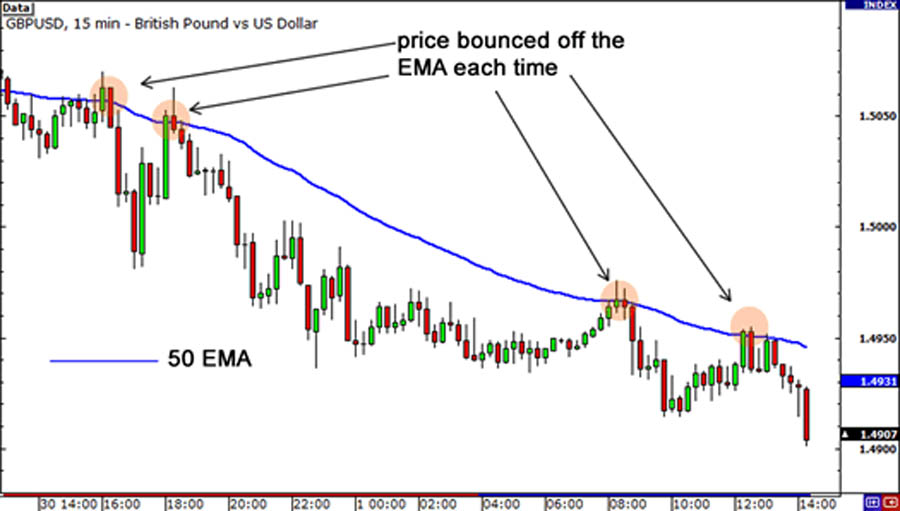
How to Trade with Moving Averages:
- Identify key moving averages on your chart. These can act as support or resistance, depending on the price’s position relative to the moving average.
- Look for bounces off the moving average as potential entry points. For example, if the price is above the 200-day moving average and bounces off of it, this could signal a continuation of the uptrend.
- In a downtrend, the moving average often acts as resistance, and a break below it could signal further downside momentum.
Example: In the GBP/USD pair, the 50-day moving average might act as support during an uptrend. Traders could enter buy trades when the price bounces off the moving average, placing stops just below it to manage risk.
7. Volume-Confirmed Breakouts
Volume plays a crucial role in confirming breakouts at support and resistance levels. When price breaks a key level with high volume, it indicates strong conviction among traders, increasing the likelihood of a sustained move.
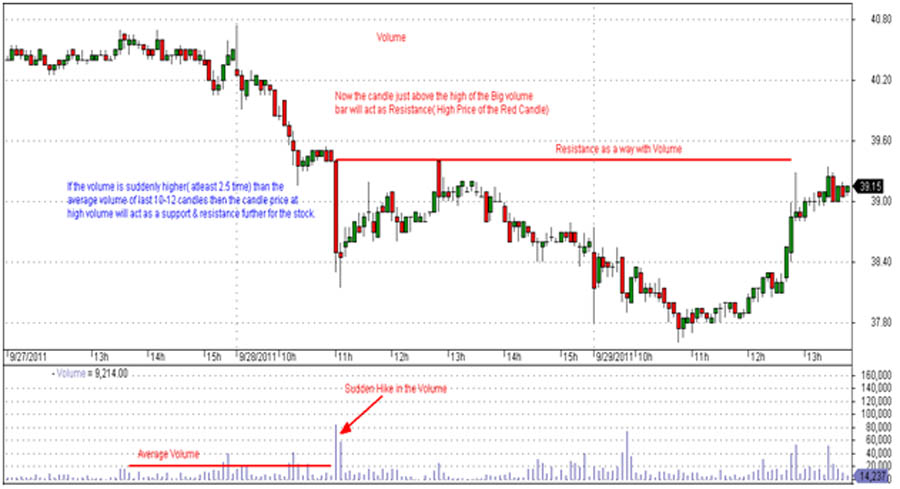
How to Trade Volume-Confirmed Breakouts:
- Monitor price action near major support or resistance levels. When a breakout occurs, check the volume. If the volume is significantly higher than average, it suggests that the breakout is valid and more likely to continue.
- Avoid breakouts with low volume. These are often “false breakouts” that fail to gain momentum and may result in a price reversal.
- Combine volume analysis with other technical indicators, like moving averages or RSI, for added confirmation.
Read More: ichimoku cloud swing trading strategy
Risk Management in Support and Resistance Swing Trading
Effective risk management is essential to long-term trading success. While support and resistance swing trading strategies offer high-probability setups, no trade is without risk. Proper risk management helps traders protect their capital and minimize losses during unfavorable market conditions.
Position Sizing
- Risk only 1-2% of your total capital on any given trade. This ensures that even if the trade fails, your account will not be significantly impacted.
- Adjust your position size based on market volatility. In highly volatile markets, consider reducing your position size to account for larger price swings.
Stop Loss Placement
- Place stop losses just below support levels or above resistance levels to limit your downside risk. This way, if the price breaks through these levels, you’ll automatically exit the trade.
- In volatile markets, use a wider stop loss to accommodate larger price fluctuations, but ensure that it remains within your risk tolerance.
Take Profit Targets
- Aim for a risk-to-reward ratio of at least 1:2 or higher. This means that for every dollar you risk, you should aim to make two dollars in profit.
- Use multiple take-profit targets to scale out of trades. By taking partial profits at different stages, you lock in gains while allowing the remaining position to run.
Common Mistakes to Avoid in Support and Resistance Swing Trading
Overtrading
One of the biggest pitfalls for traders is overtrading. The temptation to be constantly active in the markets can lead to poor decision-making and emotional trading. Stick to your strategy and avoid entering trades that don’t align with your support and resistance setup.
Ignoring Market Conditions
Always pay attention to the broader market context. For example, during major news events or times of high volatility, support and resistance levels may not hold as expected. Stay informed about economic reports, central bank announcements, and geopolitical developments that could impact the market.
Poor Risk Management
Even the best support and resistance swing trading strategy will fail without proper risk management. Always use stop losses, and never risk more than you can afford to lose.
Read More: stochastic swing trading strategy
Opofinance: Your Trusted Broker for Swing Trading
To execute a successful support and resistance swing trading strategy, it’s important to choose a reliable broker that offers a solid platform, advanced charting tools, and competitive spreads. Opofinance is a trusted name in the industry, known for its ASIC regulation and access to the MetaTrader 5 (MT5) platform, which is ideal for swing traders. With Opofinance, you can take advantage of social trading services, enabling you to follow and learn from professional traders, while also benefiting from secure deposit and withdrawal methods.

Conclusion
Mastering the support and resistance swing trading strategy can significantly improve your trading outcomes, especially in the evolving markets of 2024. By incorporating these 7 proven swing trading strategies, you can better anticipate market movements, execute more precise trades, and manage your risk more effectively. Whether you’re trading stocks, cryptocurrencies, or forex, understanding key support and resistance levels allows you to enter and exit trades with a higher probability of success.
For swing traders, having the right tools and resources is just as important as strategy. Using a regulated forex broker or an online forex broker with advanced charting tools and competitive spreads can make all the difference. A reliable broker for forex trading provides the platform and features necessary to execute these strategies seamlessly, enabling you to capitalize on market opportunities without unnecessary risks.
As you continue refining your trading approach, remember that consistency and disciplined risk management are essential to long-term success. With the knowledge gained from this guide and a solid trading plan, you’ll be well-equipped to navigate the markets confidently and profitably in 2024 and beyond.
How Can I Tell the Difference Between a False Breakout and a Real Breakout?
To distinguish between a false and real breakout when trading support and resistance levels, look for these indicators:
Volume: A genuine breakout usually happens with higher trading volume, signaling market conviction. Low volume breakouts often lead to quick reversals.
Retest: A real breakout is often followed by a retest of the broken level, confirming it as a valid support or resistance area.
Multiple Timeframes: Analyze breakouts across different timeframes to verify if the breakout holds on both lower and higher timeframes.
Do Support and Resistance Levels Change Over Time?
Answer: Yes, support and resistance levels change as the market evolves. As price trends upward or downward, old support levels may turn into new resistance, and vice versa. Market volatility can also cause more frequent shifts in these levels. To adjust your strategy:
Update Charts: Regularly redraw support and resistance lines based on recent highs and lows.
Use Indicators: Moving averages can act as dynamic support or resistance, adjusting to price changes over time.
Adapt Stop Losses: In volatile markets, widen your stop-loss orders to accommodate larger price swings.
How Important Is Volume in Support and Resistance Swing Trading?
Volume plays a critical role in validating support and resistance levels. When prices break through a key level, higher-than-average volume indicates strong market commitment and increases the likelihood of the breakout holding. On the other hand, low volume during a breakout could signal a lack of conviction, leading to a potential reversal or false breakout. Always consider volume as a confirmation tool when making entry and exit decisions in your swing trading strategy.


