The trend reversal trading strategy is a powerful approach used by traders to identify and profit from market shifts. In simple terms, it involves spotting the moment when a current market trend is about to reverse, allowing traders to capitalize on the price movement in the opposite direction. This strategy is essential for maximizing profits, especially in volatile markets like forex, stocks, and cryptocurrencies.

Identifying trend reversals is crucial for traders because it enables them to enter trades at the most advantageous points, just as a new trend is emerging. Unlike trend-following strategies, which focus on continuing an existing trend, a trend reversal strategy allows traders to get in early, often leading to larger profits. Using key indicators and technical analysis, traders can spot these pivotal moments and execute well-timed trades.
To succeed with this approach, traders must understand the core concepts, apply the right tools, and maintain patience and discipline. Whether you’re trading with a regulated forex broker or focusing on other markets, mastering the trend reversal strategy can significantly enhance your trading results.
What Is a Trend Reversal and Why Is It Important?

A trend reversal occurs when the price of an asset changes direction from its previous trend whether bullish or bearish and starts moving in the opposite direction. The ability to accurately identify a reversal is critical for traders aiming to capture profits before a trend fully materializes.
Trend-Following vs. Trend Reversal Trading
- Trend-Following Strategy: Traders follow the current direction of the market, buying during uptrends and selling during downtrends.
- Trend Reversal Strategy: Instead of following the existing trend, a trend reversal strategy focuses on predicting when the current trend will end and a new one will begin, giving traders an advantage by entering or exiting positions early.
The most experienced traders aim to catch reversals because these points often signal major market shifts, which can lead to significant profit opportunities.
Key Indicators for Spotting Reversals

Identifying a trend reversal relies heavily on technical analysis and various tools that provide insights into price momentum. Here are the most commonly used indicators that help traders pinpoint reversals:
1. RSI (Relative Strength Index)
The RSI is a leading momentum oscillator that measures the speed and change of price movements. It ranges from 0 to 100 and is used to identify overbought (above 70) or oversold (below 30) conditions in the market. When the RSI hits these extremes, it suggests a potential reversal may be near.
2. Moving Averages and Crossovers
Moving averages smooth out price data and provide insights into the trend’s direction. When a shorter moving average (e.g., 50-day) crosses below a longer moving average (e.g., 200-day), this crossover signals a possible reversal from bullish to bearish. The reverse is true for a bullish reversal.
3. Support and Resistance Levels
Support and resistance are pivotal levels where price struggles to move past. A break below support often signals the end of a bullish trend, while a break above resistance can mark the end of a bearish trend. Traders rely on these levels to identify potential reversal points.
4. Candlestick Patterns
Certain candlestick formations, such as Doji and Pin Bar, are strong indicators of impending reversals. A Doji signifies market indecision, which often precedes a reversal, while a Pin Bar indicates strong rejection of a price level, signaling a potential trend change.
5. Fibonacci Retracements and Bollinger Bands
- Fibonacci retracements are used to predict areas where the market might reverse by identifying retracement levels (38.2%, 50%, and 61.8% are the most common).
- Bollinger Bands measure market volatility, and when the price moves outside the bands, it often signals an overextended trend, indicating a potential reversal.
Combining these technical tools increases the likelihood of correctly identifying trend reversals, which in turn leads to better trading decisions and higher profitability.
Read More: Trend-Following Strategy
Effective Trend Reversal Strategies: Mastering the Art of Timing

To successfully implement a trend reversal trading strategy, traders need a deep understanding of market signals, technical indicators, and trading patterns that provide reliable signs of potential reversals. Let’s dive deeper into some of the most effective trend reversal strategies that traders can use to enhance their trading accuracy and profitability.
1. Pin Bar Reversal Strategy
The Pin Bar Reversal Strategy is one of the most popular and straightforward methods for detecting reversals. A Pin Bar is a candlestick pattern characterized by a small body and a long wick or shadow on one side. This pattern forms when the market rejects a certain price level, signaling a potential reversal of the current trend.
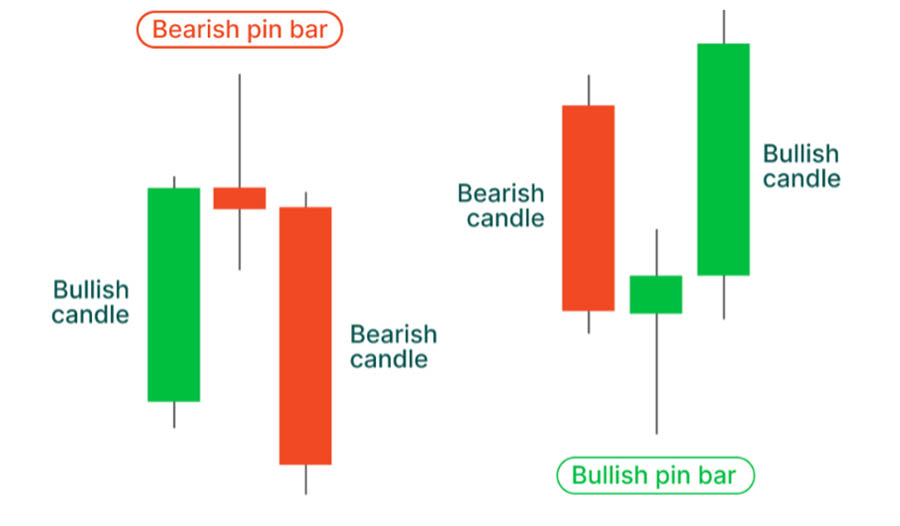
- How It Works: When a Pin Bar forms at a key level of support or resistance, it signals that the market is about to reverse direction. The long wick shows that the market tried to push in one direction but failed, indicating that the buyers or sellers are losing control.
- When to Enter a Trade: To confirm the validity of a Pin Bar, traders often wait for a second candlestick to form, confirming the reversal. If the second candle moves in the opposite direction of the long wick, it’s considered a strong reversal signal. Traders can then enter a position in the direction of the new trend.
Example: Imagine you are watching a forex pair, and you notice a Pin Bar forming near a strong resistance level. The long upper wick suggests that buyers attempted to push the price higher but failed. If the next candle is bearish, you could enter a short position, anticipating a downward reversal.
Key takeaway: The Pin Bar Reversal Strategy is effective when combined with support and resistance levels, providing high-probability entry points in both bullish and bearish reversals.
2. Double Top and Double Bottom Patterns
The Double Top and Double Bottom patterns are among the most reliable chart patterns for identifying trend reversals. These patterns occur when the market makes two attempts to breach a price level, fails, and then reverses direction.
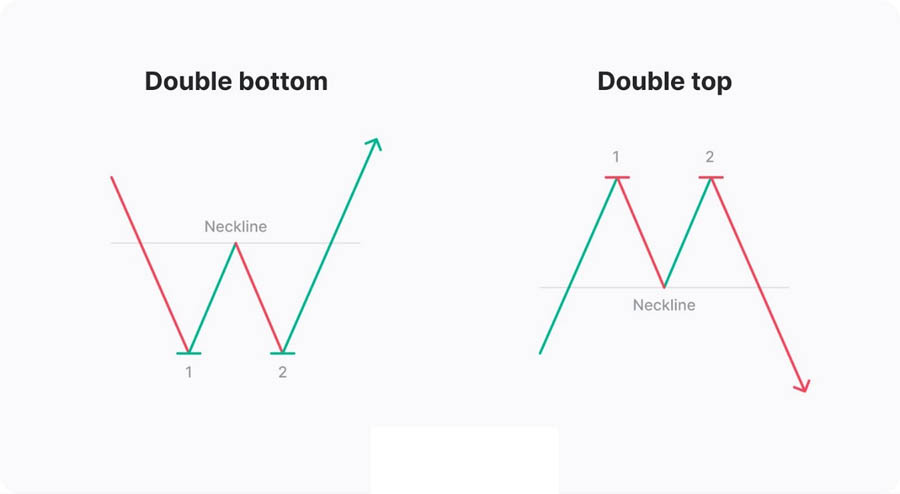
- Double Top: This pattern signals a bearish reversal after the market attempts to break a resistance level twice and fails. The two peaks resemble the shape of an “M,” indicating that buyers are losing momentum.
- Double Bottom: In contrast, a Double Bottom forms after two failed attempts to break through a support level. The pattern looks like a “W,” signaling that sellers are losing strength and the market is likely to reverse upwards.
How to Trade Double Tops and Bottoms:
- Entry Point: The entry point for both patterns is usually after the second peak or bottom has formed, and the price has broken through the neckline (the low point between the two peaks in a Double Top or the high point in a Double Bottom).
- Confirmation: To ensure that the reversal is genuine, wait for a retest of the neckline. If the price bounces off the neckline in the opposite direction, it’s a strong confirmation of the reversal, and you can enter the trade confidently.
Key takeaway: Double Tops and Bottoms are highly effective reversal patterns that work across multiple asset classes, including stocks, forex, and commodities.
3. Head and Shoulders Pattern
The Head and Shoulders Pattern is a widely used technical pattern for spotting market reversals. It consists of three peaks: a higher middle peak (the “head”) between two lower peaks (the “shoulders”). This pattern suggests a trend reversal from bullish to bearish.
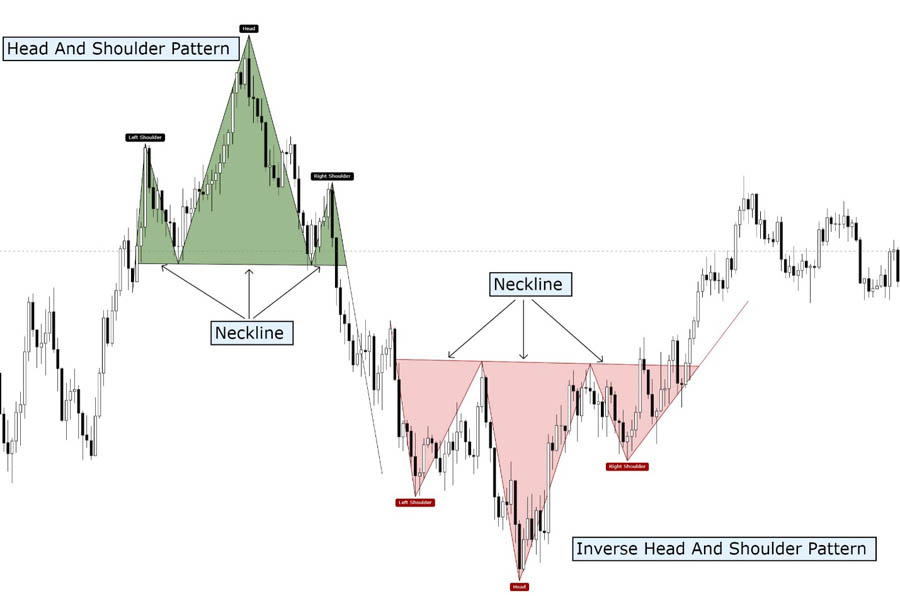
- Bearish Head and Shoulders: This occurs in an uptrend when the market makes a higher high (the head) followed by a lower high (the right shoulder). The trend then reverses downward after breaking the “neckline,” which connects the two low points of the shoulders.
- Inverse Head and Shoulders: In this bullish variation, the pattern forms in a downtrend and signals a reversal to the upside. The price makes a lower low (the head), followed by two higher lows (the shoulders), indicating that selling pressure is diminishing, and a bullish reversal is likely.
How to Trade Head and Shoulders:
- Entry Point: The entry point is when the price breaks below (or above, in the case of an inverse pattern) the neckline. It’s essential to wait for the breakout and, ideally, a retest of the neckline before entering the trade.
- Stop Loss and Take Profit: Place your stop-loss order above the right shoulder for a bearish Head and Shoulders or below the right shoulder for the bullish Inverse Head and Shoulders. Target a profit equal to the distance between the head and the neckline.
Key takeaway: The Head and Shoulders pattern is one of the most reliable chart formations for predicting major trend reversals.
4. Divergence Trading: Using RSI Divergence for Reversal Confirmation
Divergence Trading is a popular method for identifying trend reversals using oscillators like the Relative Strength Index (RSI). Divergence occurs when the price is making new highs or lows, but the oscillator (in this case, RSI) fails to mirror this movement, signaling that the trend is losing momentum and a reversal could be imminent.
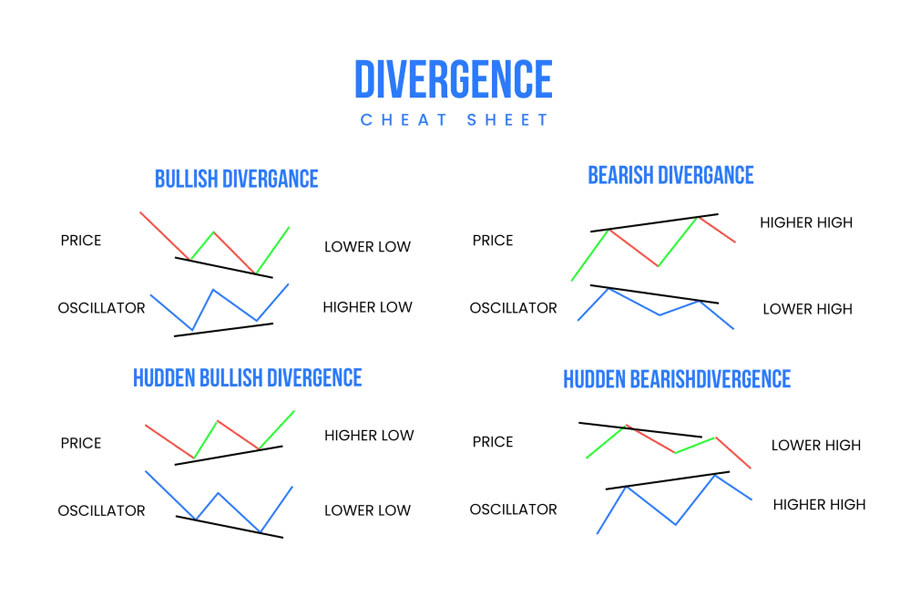
- Bullish Divergence: Occurs when the price makes a lower low, but the RSI makes a higher low. This signals that selling pressure is weakening, and a bullish reversal may occur soon.
- Bearish Divergence: Happens when the price makes a higher high, but the RSI forms a lower high. This indicates that buying pressure is fading, and a bearish reversal could be on the horizon.
How to Use Divergence in Trading:
- Entry Point: Once you identify a divergence between the price and the RSI, look for additional confirmation from other indicators like support and resistance levels or candlestick patterns before entering the trade.
- Confirmation: For stronger signals, use moving averages or Fibonacci retracements alongside RSI divergence to validate the potential reversal.
Example: If a stock price is forming higher highs, but the RSI is making lower highs, this could indicate that the uptrend is losing momentum. By combining this observation with a resistance level or candlestick reversal pattern, you can time your entry into a short position for maximum accuracy.
Key takeaway: RSI divergence is a powerful tool for confirming trend reversals, helping traders enter trades at optimal points.
5. Fibonacci Retracement for Reversal Signals
Fibonacci retracement levels are another effective tool for spotting reversals. This technical analysis tool is based on the idea that prices often retrace a predictable portion of a move, after which they continue in the original direction.
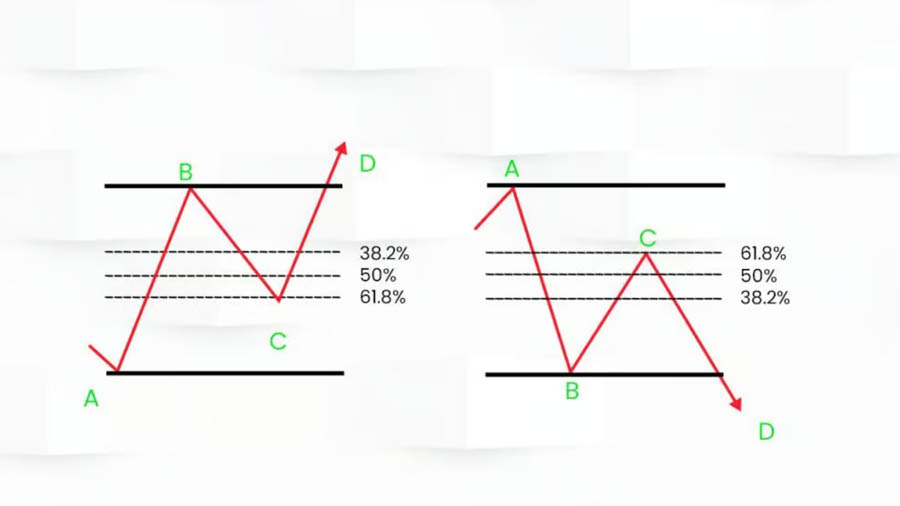
- Key Levels: Traders commonly watch for reversals at the 38.2%, 50%, and 61.8% Fibonacci retracement levels. When the price retraces to one of these levels and then resumes its previous trend, it often signals the end of a correction and the start of a new move in the opposite direction.
How to Use Fibonacci Retracements in Trend Reversal Trading:
- Entry Point: After a price retraces to one of the Fibonacci levels, look for confirmation of the reversal with other tools like moving averages, RSI, or candlestick patterns before entering the trade.
- Targeting and Stop Loss: Set your stop loss just beyond the Fibonacci level to minimize risk. Your profit target can be set at the next Fibonacci level or based on the previous high or low.
Key takeaway: Fibonacci retracement levels are excellent for pinpointing potential reversal points and can be used in combination with other indicators for more reliable signals.
These effective trend reversal strategies can significantly improve your ability to spot market reversals and trade them profitably. Each of these strategies requires a solid understanding of technical analysis and a keen eye for market signals. By combining these strategies with proper risk management and discipline, you can increase your chances of capturing profitable reversals in any market.
Risk Management in Reversal Trading

Risk management is essential in any trading strategy, but especially in reversal trading, where volatility is common. Here are key ways to protect your capital:
1. Setting Stop-Loss Orders
Using stop-loss orders at critical levels can protect you from unexpected market movements. Always place stop-losses beyond the key support or resistance levels to avoid being prematurely stopped out.
2. Position Sizing
Never risk more than 1-2% of your total capital on a single trade. Proper position sizing prevents devastating losses, even if the market moves against your position.
3. Managing Risk in Choppy Markets
Markets often become volatile during reversals. It’s important to reduce exposure during such times by avoiding overleveraging and sticking to well-defined risk parameters.
Risk management is the cornerstone of successful trading, as no strategy—no matter how effective—guarantees success.
Common Mistakes in Trading Reversals

While the potential rewards from reversal trading are significant, many traders fall into avoidable traps. Below are some common mistakes that can derail even the most seasoned traders:
1. Misinterpreting Retracements as Reversals
One of the biggest errors traders make is confusing a temporary retracement for a full reversal. A retracement is a minor pullback within an ongoing trend, while a reversal is a complete shift in trend direction. Failing to differentiate the two can lead to premature exits or ill-timed entries.
2. Entering Without Confirmation
Entering a trade too early, without waiting for confirmation, is risky. Traders often refer to this as “catching a falling knife.” Always use multiple indicators, such as moving average crossovers or candlestick patterns, to confirm the reversal before placing a trade.
3. Overleveraging in Volatile Markets
High volatility can trigger significant price swings, especially during reversals. Overleveraging during such conditions can magnify losses. It’s critical to manage position sizes carefully and avoid using excessive leverage during potential reversals.
Patience, discipline, and confirmation are key in avoiding these mistakes. Trading without confirmation and overleveraging are surefire ways to experience significant losses.
The Psychology Behind Market Reversals
Understanding market psychology is crucial in reversal trading because emotions often drive price movements. Traders who grasp these psychological aspects have an edge in predicting when the market will change direction.
1. Fear and Greed in Market Dynamics
Fear and greed are the two dominant emotions driving market participants. During a bull market, greed can push prices higher, but when prices reach unsustainable levels, fear of loss can trigger a sudden reversal. In a bear market, the opposite happens—fear drives prices down, and greed kicks in when traders believe the market has bottomed out.
2. Behavioral Patterns During Trend Shifts
When a trend is about to reverse, behavioral patterns emerge. Traders who have ridden a trend for a long time may become complacent, while new entrants may ignore warning signs and buy near the top. Conversely, panic selling near market bottoms often leads to sharp reversals.
Recognizing these patterns enables traders to stay calm and make data-driven decisions during emotional market conditions.
Opofinance: A Reliable Partner in Your Trading Journey
When selecting a broker for forex trading, Opofinance stands out for several reasons:
- ASIC-regulated forex broker, ensuring high standards of security and transparency.
- Featured on the MT5 brokers list, offering a versatile and robust trading platform.
- Provides social trading services, allowing traders to follow and copy the strategies of experienced traders.
- Offers safe and convenient deposit and withdrawal methods, ensuring secure financial transactions.
- Ideal for both beginner and experienced traders looking to apply strategies like trend reversal trading effectively.

With these features, Opofinance remains a trusted choice for traders seeking a reliable and efficient trading platform.
Conclusion: Is Trend Reversal Trading Strategy Right for You?
Mastering the trend reversal trading strategy can unlock significant profit potential, but it requires skill, discipline, and patience. Throughout this guide, we have explored the most effective indicators and strategies that traders use to identify market reversals, such as RSI divergence, candlestick patterns, and Fibonacci retracements.
For traders looking to capture the beginning of a new trend, the trend reversal strategy offers high-profit opportunities. However, this approach is not without its challenges. Mistiming a reversal or failing to confirm signals can lead to losses. That’s why combining multiple indicators, staying patient, and practicing strong risk management are crucial for long-term success.
Ultimately, the trend reversal trading strategy can be highly rewarding, but it’s not suitable for every trader. If you prefer a more active approach to trading and enjoy predicting shifts in market sentiment, this strategy might be ideal for you. However, if you’re more risk-averse, you may want to explore trend-following strategies instead.
By combining technical analysis, market psychology, and robust risk management, you can make the most of reversal opportunities. Whether you’re trading forex, stocks, or cryptocurrencies, applying these strategies in the right way can improve your trading results.
What are the best tools for confirming a trend reversal?
The most effective tools include RSI divergence, moving average crossovers, and key candlestick patterns like Doji and Pin Bars. These indicators provide confirmation when used together.
How can I avoid false signals in trend reversal trading?
To avoid false signals, wait for multiple confirmations before entering a trade. For example, look for a combination of candlestick patterns, RSI divergence, and a break of support or resistance.
Is trend reversal trading suitable for beginners?
Trend reversal trading can be challenging for beginners due to the level of skill required to spot reversals accurately. However, with proper education and practice, new traders can gradually develop the ability to trade reversals successfully.


