In the dynamic and fast-paced world of Forex trading, moving average indicators in Forex serve as essential tools for traders aiming to analyze market trends and make informed trading decisions. A moving average (MA) is a statistical calculation that smooths out price data by creating a constantly updated average price over a specific period. This smoothing process eliminates the “noise” from random short-term price fluctuations, allowing traders to focus on the underlying trend and make strategic decisions based on clearer signals.
Understanding how to use moving average indicators in Forex trading is crucial for both novice and experienced traders. These indicators help in identifying potential entry and exit points, determining support and resistance levels, and enhancing overall trading strategies. By providing a visual representation of price trends, moving averages facilitate a better understanding of market dynamics, enabling traders to anticipate future price movements with greater confidence.
Choosing a regulated forex broker is paramount for implementing moving average strategies effectively. A reliable broker ensures that traders have access to robust platforms and advanced tools necessary for accurate analysis and execution of trades. Additionally, regulated brokers adhere to strict financial standards, providing a secure trading environment that protects traders’ investments and personal information.
This comprehensive article delves into the intricacies of moving average indicators in Forex, exploring various types, calculation methods, practical applications, and advanced trading strategies. By the end of this guide, you will have a thorough understanding of how to leverage moving averages to enhance your Forex trading performance.
Read More: Zigzag Indicator in Forex
Types of Moving Averages
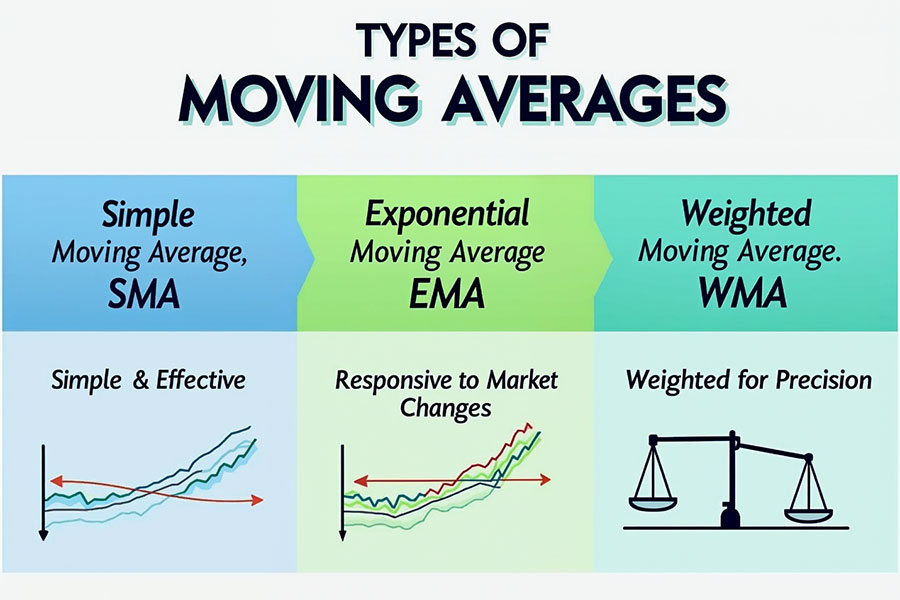
Moving averages come in various forms, each with its unique calculation method and application in Forex trading. Understanding the differences between these types is essential for selecting the most appropriate indicator for your trading strategy.
Simple Moving Average (SMA)
The Simple Moving Average (SMA) is the most straightforward and widely used type of moving average. It is calculated by adding the closing prices of a currency pair over a specific number of periods and then dividing the total by the number of periods. For example, a 50-day SMA adds the closing prices of the last 50 days and divides the sum by 50.
Usage: The SMA is primarily used to identify long-term trends. When the price consistently remains above the SMA, it indicates an uptrend, suggesting that the market is experiencing sustained buying pressure. Conversely, when the price stays below the SMA, it signifies a downtrend, indicating persistent selling pressure. The SMA is favored for its simplicity and effectiveness in providing clear trend signals, making it a staple in many trading strategies.
Exponential Moving Average (EMA)
The Exponential Moving Average (EMA) differs from the SMA by giving more weight to recent prices. This weighting makes the EMA more responsive to new information and recent price changes, reducing the lag associated with the SMA. The EMA is calculated using a formula that applies a multiplier to the most recent price, ensuring that the indicator reflects the latest market conditions more accurately.
Applications: The EMA is particularly useful for short-term trading strategies where timely signals are crucial. Its responsiveness allows traders to quickly identify trend changes and potential reversal points. The EMA is often preferred by day traders and scalpers who need to react swiftly to market movements. Additionally, the EMA is integral to various technical indicators, such as the Moving Average Convergence Divergence (MACD), enhancing its versatility in trading applications.
Weighted Moving Average (WMA)
The Weighted Moving Average (WMA) assigns different weights to each period’s price, with the most recent prices typically given more significance. This weighting system allows the WMA to react more swiftly to price changes than the SMA, making it a valuable tool for traders seeking a balance between responsiveness and trend identification.
Explanation of Weighting: In WMA calculations, each price is multiplied by a predetermined weight, and the sum of these weighted prices is divided by the total of the weights. For example, in a 5-day WMA, the most recent day might be given a weight of 5, the previous day a weight of 4, and so on, down to the oldest day with a weight of 1. This method emphasizes recent price movements, ensuring that the WMA closely follows the current market trend. The WMA is particularly useful in volatile markets where timely adjustments to trend indicators are necessary.
Read More: MACD Indicator in Forex Trading
Calculation Methods
Accurately calculating moving averages is fundamental to their effective use in Forex trading. Below is a detailed guide on calculating both Simple Moving Averages (SMA) and Exponential Moving Averages (EMA), complete with step-by-step instructions and example calculations for clarity.

Calculating Simple Moving Average (SMA)
Step-by-Step Guide:
- Select the Time Period: Determine the number of periods (e.g., 20 days) for which you want to calculate the SMA. The choice of period depends on your trading strategy and the timeframe you are analyzing.
- Sum the Closing Prices: Add the closing prices of the selected periods. For instance, if you are calculating a 20-day SMA, sum the closing prices of the last 20 days.
- Divide by the Number of Periods: Divide the total sum by the number of periods to obtain the SMA.
Example Calculation:
Suppose you want to calculate a 5-day SMA with the following closing prices: 1.1000, 1.1050, 1.1020, 1.1080, and 1.1070.
- Sum of Closing Prices: 1.1000 + 1.1050 + 1.1020 + 1.1080 + 1.1070 = 5.5220
- Number of Periods: 5
- SMA: 5.5220 / 5 = 1.1044
This means the 5-day SMA is 1.1044, providing a smoothed average price over the last five days.
Calculating Exponential Moving Average (EMA)
Step-by-Step Guide:
- Select the Time Period: Choose the number of periods for the EMA (e.g., 10 days). The period selection should align with your trading objectives.
- Calculate the SMA for the Initial EMA Value: For the first EMA calculation, use the SMA as the initial EMA value. For example, calculate the 10-day SMA to serve as the starting point for the EMA.
- Determine the Multiplier: The multiplier is calculated using the formula:
Multiplier = 2 / (Number of periods + 1)
For a 10-day EMA, the multiplier would be 2 / (10 + 1) = 0.1818. - Apply the EMA Formula:
EMA_today = (Closing Price_today – EMA_yesterday) * Multiplier + EMA_yesterday
Example Calculation:
For a 10-day EMA, assume the SMA (initial EMA) is 1.1500, and the closing price today is 1.1550.
- Multiplier: 2 / (10 + 1) = 0.1818
- EMA Calculation:
EMA_today = (1.1550 – 1.1500) * 0.1818 + 1.1500
EMA_today = (0.0050) * 0.1818 + 1.1500
EMA_today = 0.000909 + 1.1500
EMA_today = 1.1509
Thus, the 10-day EMA for today is 1.1509, reflecting a slight adjustment based on the latest closing price.
Application in Forex Trading

Moving averages are versatile tools in Forex trading, offering insights into market trends, identifying support and resistance levels, and aiding in the development of robust trading strategies. Understanding their practical applications can significantly enhance your trading effectiveness.
Identifying Trends
Uptrends and Downtrends: One of the primary uses of moving averages is to identify the direction of the market trend.
- Uptrend: When the price consistently stays above the moving average, it indicates an uptrend. This suggests that buyers are in control, and the market is experiencing sustained upward momentum. Traders may consider taking long positions or holding existing ones to capitalize on the trend.
- Downtrend: Conversely, when the price remains below the moving average, it signifies a downtrend. This indicates that sellers are dominant, and the market is experiencing sustained downward pressure. Traders may consider taking short positions or avoiding long trades during such periods.
For example, a 200-day SMA is often used to identify long-term trends. If the EUR/USD pair is trading above its 200-day SMA, traders may consider it to be in an uptrend, potentially looking for buying opportunities. On the other hand, if the EUR/USD is below the 200-day SMA, it may be deemed to be in a downtrend, prompting traders to consider selling or shorting the pair.
Trend Strength: The angle and slope of the moving average also provide insights into the strength of the trend. A steep slope indicates a strong trend, while a flat or gently sloping MA suggests a weak or consolidating trend.
Support and Resistance Levels
Role in Market Dynamics: Moving averages can act as dynamic support and resistance levels, which are key concepts in technical analysis.
- Support Level: During an uptrend, the moving average often serves as a support level. When the price pulls back towards the MA, it may find support and bounce back upwards, continuing the trend. Traders use this as an opportunity to enter or add to long positions.
- Resistance Level: In a downtrend, the moving average can act as a resistance level. When the price rallies towards the MA, it may encounter resistance and reverse direction downward, continuing the downtrend. Traders may use this as an opportunity to enter or add to short positions.
For instance, if the GBP/USD pair approaches its 50-day EMA from above, the EMA might act as a support level, prompting traders to consider buying if the price bounces off the EMA. Conversely, if the GBP/USD approaches the 50-day EMA from below, the EMA may act as a resistance level, suggesting a potential selling opportunity if the price fails to break above the MA.
Dynamic Nature: Unlike static support and resistance levels, which are fixed price points, moving averages are dynamic and adjust as new price data becomes available. This adaptability makes MAs valuable for capturing the evolving nature of market trends and price movements.
Read More: CCI Indicator in Forex
Trading Strategies Using Moving Averages

Moving averages are integral to various trading strategies that help traders capitalize on market trends and momentum. Below are some of the most effective strategies that incorporate moving averages.
Crossover Strategies
Golden Cross and Death Cross: Crossover strategies involve using two moving averages of different periods to generate trading signals.
- Golden Cross: A Golden Cross occurs when a shorter-term MA crosses above a longer-term MA, signaling a potential bullish trend. This crossover suggests that the recent price action is strong enough to sustain an upward movement, making it a signal to enter a long position.
- Death Cross: A Death Cross happens when a shorter-term MA crosses below a longer-term MA, indicating a potential bearish trend. This crossover suggests that the recent price action is weakening, signaling a good time to enter a short position or exit long positions.
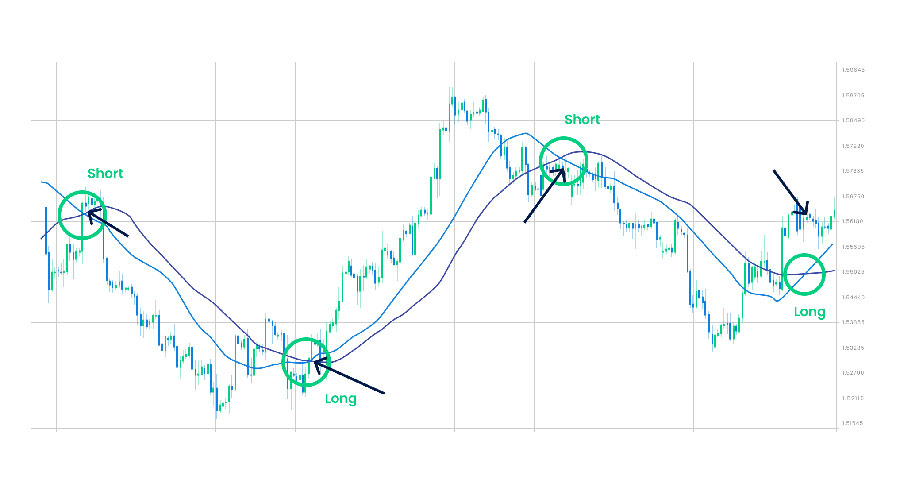
For example, a 50-day SMA crossing above a 200-day SMA (Golden Cross) might suggest a good time to enter a long position, while the opposite (Death Cross) could signal a sell opportunity. These crossovers are considered significant because they reflect a change in the overall market sentiment and trend direction.
Confirmation: Traders often seek confirmation from other indicators or price action to validate crossover signals, reducing the likelihood of false signals and enhancing the reliability of the strategy.
Moving Average Ribbon
Trend Analysis with Multiple MAs: A Moving Average Ribbon involves plotting multiple moving averages of varying lengths on the same chart. This ribbon provides a more comprehensive view of the trend’s strength and direction by displaying the convergence and divergence of different MAs.
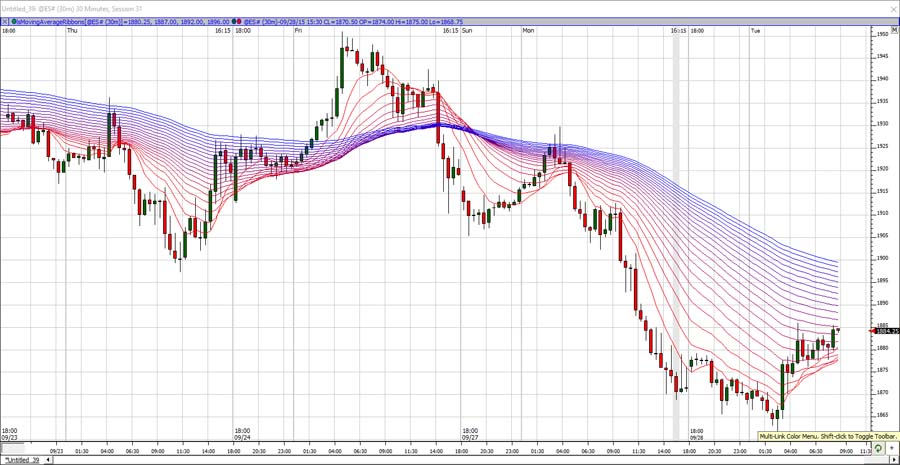
How It Works: When all the moving averages in the ribbon are aligned and moving in the same direction, it indicates a strong and consistent trend. If the MAs start to fan out or diverge, it may signal a weakening trend or a potential reversal.
For example, using a combination of 10, 20, 50, and 100-day EMAs can help traders assess the trend’s momentum. If the 10-day EMA is above the 20-day EMA, which in turn is above the 50-day EMA, and so on, it suggests a strong uptrend. Conversely, if the shorter-term MAs are crossing below the longer-term MAs, it may indicate an impending downtrend.
Advantages: The ribbon approach provides multiple data points, offering a nuanced understanding of market trends. It helps in identifying the duration and intensity of trends, enabling traders to make more informed decisions.
MACD Indicator
Integration with Moving Averages for Momentum Trading: The Moving Average Convergence Divergence (MACD) indicator combines two EMAs (typically 12-day and 26-day) and plots the difference between them. The MACD also includes a signal line, which is a 9-day EMA of the MACD line itself.
How It Works: The MACD helps traders identify momentum changes and potential trend reversals by analyzing the convergence and divergence of the two EMAs.
- Bullish Signal: When the MACD line crosses above the signal line, it may indicate bullish momentum, suggesting a buying opportunity.
- Bearish Signal: When the MACD line crosses below the signal line, it may indicate bearish momentum, suggesting a selling opportunity.
For instance, when the MACD line crosses above the signal line, it may confirm a bullish trend identified by other moving average signals, strengthening the case for a long position. Conversely, when the MACD line crosses below the signal line, it may confirm a bearish trend, supporting a short position.
Divergence: Additionally, divergence between the MACD and price action can signal potential reversals. For example, if the price is making higher highs while the MACD is making lower highs, it may indicate weakening momentum and a possible trend reversal.
Common Mistakes to Avoid
Choosing the Wrong Type of Moving Average
Impact on Analysis: Selecting an inappropriate moving average type can lead to misleading signals. For example, using an SMA in a highly volatile market may result in delayed signals, while an EMA might be more suitable for capturing quick price movements.
Traders should evaluate market conditions and choose the moving average type that aligns best with their trading style and objectives.
Relying Solely on Moving Averages
Importance of Additional Indicators: While moving averages are powerful tools, relying exclusively on them can be risky. They should be used in conjunction with other technical indicators, such as the Relative Strength Index (RSI) or Bollinger Bands, to confirm signals and enhance trading accuracy.
For example, combining moving averages with volume indicators can provide deeper insights into market strength and potential reversals.
Ignoring the Impact of Time Frames
Effect on Analysis: The choice of time frame significantly influences moving average analysis. Shorter time frames (e.g., 5-minute charts) may produce more signals but can also lead to more false alarms. Longer time frames (e.g., daily charts) offer more reliable trends but fewer trading opportunities.
Traders should consider their trading style—whether day trading or swing trading—and select time frames that complement their strategies.
Opofinance Services
When it comes to executing effective moving average strategies, partnering with a reliable broker is essential. Opofinance, an ASIC-regulated broker, offers exceptional services tailored for Forex traders. Known for its robust social trading platform, Opofinance enables traders to connect, share strategies, and replicate successful trades, enhancing the overall trading experience. Additionally, Opofinance is officially featured on the MT5 brokers list, providing access to advanced trading tools and features. With safe and convenient deposit and withdrawal methods, Opofinance ensures that your trading funds are managed securely and efficiently, allowing you to focus on leveraging moving average indicators for optimal trading outcomes.

Conclusion
In summary, the moving average indicator in Forex is an indispensable tool for traders aiming to navigate the complexities of the Forex market. By smoothing out price data, moving averages help identify trends, support and resistance levels, and potential trading opportunities. Understanding the different types of moving averages—SMA, EMA, and WMA—and their respective calculation methods empowers traders to tailor their strategies effectively. Incorporating moving averages into various trading strategies, such as crossover strategies and MACD integration, can significantly enhance trading precision and profitability.
However, it’s crucial to avoid common pitfalls, such as selecting the wrong type of moving average, relying solely on moving averages without additional indicators, and neglecting the impact of time frames. By integrating moving averages with other technical tools and maintaining a disciplined approach, traders can make more informed decisions and achieve better trading outcomes.
Incorporating a regulated forex broker like Opofinance can further enhance your trading experience, providing the necessary tools and support to maximize the potential of moving average indicators in Forex trading.
How do moving averages differ between various currency pairs?
Moving averages can behave differently across currency pairs due to varying volatility and market dynamics. Traders should adjust the moving average periods and types based on the specific characteristics of each currency pair to optimize their trading strategies.
Can moving averages predict future price movements accurately?
While moving averages are effective in identifying trends and potential reversal points, they are not foolproof predictors of future price movements. It’s essential to use them in conjunction with other indicators and analysis methods to enhance prediction accuracy.
How often should I adjust my moving average settings?
The frequency of adjusting moving average settings depends on your trading strategy and market conditions. Regularly reviewing and tweaking your settings based on performance and changing market dynamics can help maintain their effectiveness.


