In the fast-paced realm of forex trading, having a reliable and effective strategy is essential for achieving consistent success. The Parabolic SAR Indicator Strategy emerges as a standout method for traders aiming to pinpoint trend reversals and make informed trading decisions. Whether you’re new to trading or a seasoned professional, understanding how to use the Parabolic SAR Indicator can significantly enhance your trading performance. This comprehensive guide delves into the intricacies of the Parabolic SAR Indicator Strategy, providing actionable insights, advanced tips, and strategies to help you navigate the complexities of the forex market. Partnering with a regulated forex broker like Opofinance ensures you have the optimal platform to implement these strategies effectively, paving the way for a smoother and more profitable trading journey.

Introduction to Parabolic SAR
What is Parabolic SAR?
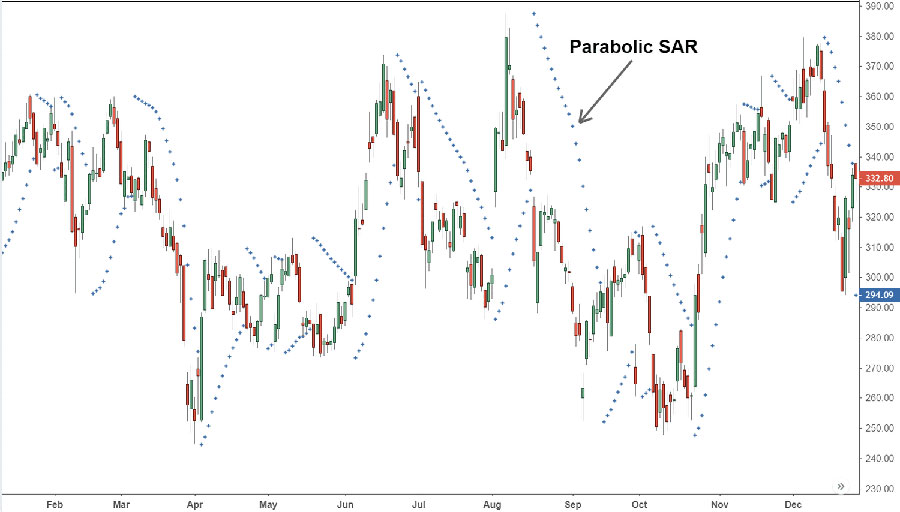
The Parabolic Stop and Reverse (SAR) indicator is a trend-following technical analysis tool developed by J. Welles Wilder. Designed to identify potential reversals in price movements, the Parabolic SAR plots a series of dots above or below the price chart, signaling the direction of the trend. When the dots are below the price, it indicates a bullish trend, suggesting potential buying opportunities. Conversely, when the dots appear above the price, it signals a bearish trend, indicating possible selling opportunities.
Read More: Parabolic SAR scalping strategy
The Parabolic SAR is a versatile tool that aids traders in making timely and informed decisions by highlighting potential trend changes.
Key Features of Parabolic SAR
- Trail Stop-Losses and Generate Entry/Exit Signals: The Parabolic SAR not only signals potential entry and exit points but also helps in setting trailing stop-loss orders to manage risk effectively.
- Dot Position Relative to Price Indicating Bullish or Bearish Trends: The position of the dots relative to the price chart serves as a clear indicator of the prevailing market trend, making it easier for traders to decide on their trades.
These key features make the Parabolic SAR an indispensable tool for traders seeking to enhance their trading strategies.
How to Calculate Parabolic SAR
Formula and Definitions
Understanding the calculation of the Parabolic SAR is crucial for leveraging its full potential. The indicator uses several key components:
- Extreme Point (EP): The highest price in a bullish trend or the lowest price in a bearish trend.
- Acceleration Factor (AF): A constant that increases with each price extreme, enhancing the indicator’s sensitivity to price changes.
The formula for the Parabolic SAR differs based on the trend direction:
Rising Trends:

Falling Trends:

- These calculations adjust the SAR dots dynamically, ensuring they respond to changing market conditions.
Basic Trading Strategy with Parabolic SAR
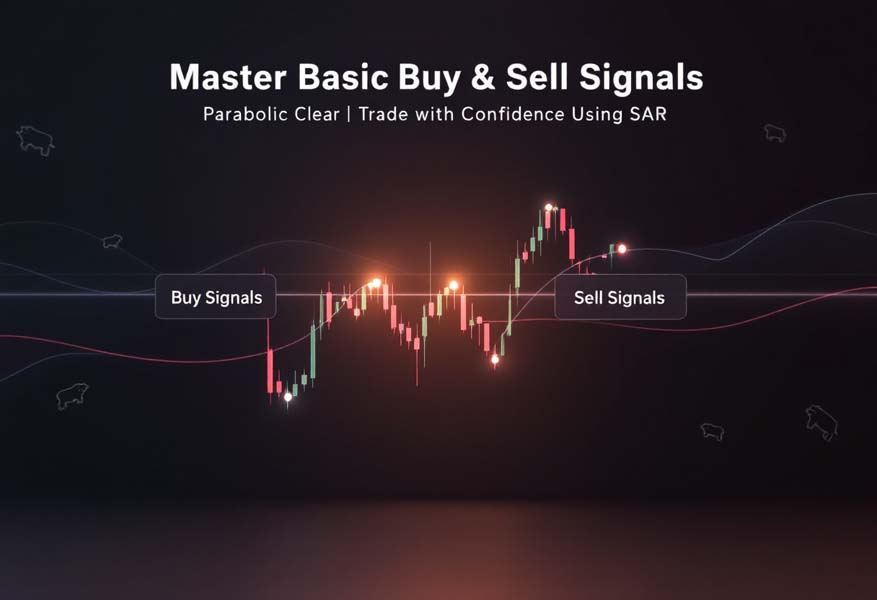
Implementing a basic Parabolic SAR Indicator Strategy involves recognizing clear buy and sell signals and managing risk effectively through stop-loss orders.
Basic Buy and Sell Signals
The Parabolic SAR generates straightforward buy and sell signals based on the position of the SAR dots relative to the price:
- Buy Signal: When the SAR dots shift from above the price to below, it signals a potential upward trend reversal. This is an opportune moment to enter a long (buy) position, anticipating that the price will continue to rise.
- Sell Signal: Conversely, when the SAR dots move from below the price to above, it indicates a potential downward trend reversal. This signals a good time to enter a short (sell) position, expecting that the price will continue to decline.
These straightforward signals allow traders to make quick and informed trading decisions.
Managing Stop-Losses
Effective risk management is paramount in trading. The Parabolic SAR assists in this by providing dynamic stop-loss levels that adjust with the trend:
- Using SAR Dots as Trailing Stops: In an uptrend, place the stop-loss below the SAR dots. As the trend progresses and the dots move upward, the stop-loss adjusts accordingly, locking in profits and minimizing potential losses if the trend reverses. In a downtrend, place the stop-loss above the SAR dots, and as the dots move downward, adjust the stop-loss to protect profits.
- Locking in Profits: By trailing the stop-loss with the SAR dots, traders can secure profits as the trend continues. This method ensures that gains are protected while allowing the trade to remain open as long as the trend is favorable.
- Minimizing Losses: If the trend reverses and the SAR dots flip position, the trailing stop-loss is triggered, closing the trade and limiting losses. This automatic adjustment helps in maintaining disciplined trading practices without emotional interference.
Strategically managing stop-losses using the Parabolic SAR ensures that traders can protect their investments while maximizing gains.
Example Scenario
Imagine a trader enters a long position at 1.2000 after the SAR shifts below the price. The SAR sets a trailing stop at 1.2000. As the price rises to 1.2200, the SAR adjusts to 1.2020, moving the stop-loss up to 1.2020. If the price continues to rise to 1.2500, the SAR moves to 1.2200, trailing the stop-loss upwards. If the price then reverses and drops below the SAR level, the trailing stop-loss at 1.2200 is triggered, securing a profit.
This example demonstrates how the Parabolic SAR facilitates effective risk management and profit protection.
Advanced Parabolic SAR Strategies
For traders seeking to enhance the effectiveness of the Parabolic SAR Indicator Strategy, integrating it with other technical indicators and employing advanced techniques can provide more robust trading signals and improved performance.
Combining Parabolic SAR with Other Indicators
Enhancing the effectiveness of the Parabolic SAR Indicator Strategy can be achieved by integrating it with other technical indicators. This combination helps in confirming signals and filtering out false positives, leading to more reliable trading decisions.
Moving Average Crossover Strategy
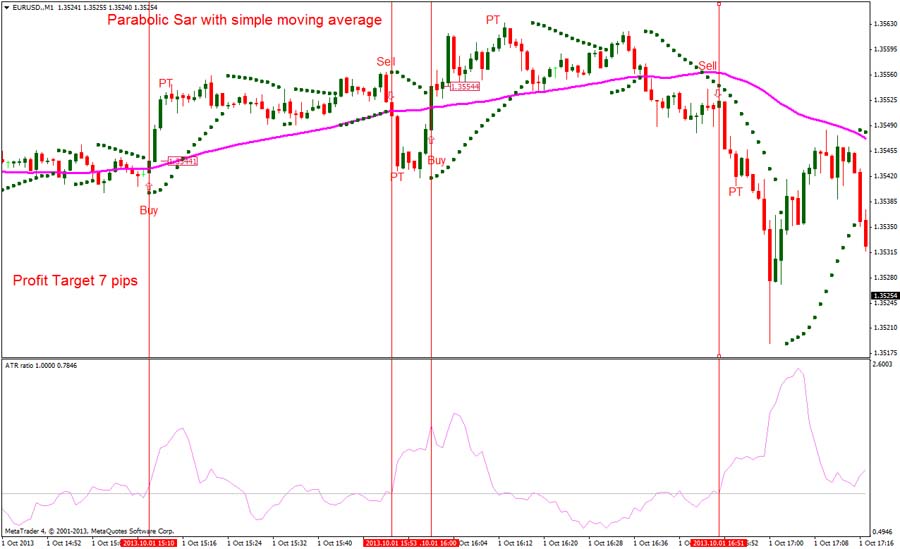
By combining the Parabolic SAR with moving averages, traders can confirm trend directions and enhance signal reliability:
- 20-Period and 40-Period Moving Averages: Implementing a short-term moving average (e.g., 20-period) alongside a long-term moving average (e.g., 40-period) provides a clearer picture of the trend’s direction and strength.
- Bullish Confirmation: When the 20-period moving average crosses above the 40-period moving average, it confirms an uptrend. If the Parabolic SAR also signals a buy (dots below the price), the trader gains additional confidence to enter a long position.
- Bearish Confirmation: Conversely, when the 20-period moving average crosses below the 40-period moving average, it confirms a downtrend. If the Parabolic SAR signals a sell (dots above the price), the trader can confidently enter a short position.
This combination enhances the reliability of trading signals, reducing the likelihood of false signals.
Double Parabolic SAR Strategy
Utilizing two Parabolic SAR indicators with different settings can fine-tune trade entries and exits, especially in volatile markets:
- Fast and Slow SAR Settings: Implement one SAR with a higher sensitivity (e.g., AF of 0.02) and another with lower sensitivity (e.g., AF of 0.04). The fast SAR reacts more quickly to price changes, while the slow SAR provides smoother signals.
- Trade Confirmation: A buy signal is considered stronger if both SAR indicators confirm the trend. For example, both SAR dots shift below the price, reinforcing the bullish signal.
- Volatility Management: In volatile markets, the double SAR approach helps in capturing both quick market moves and longer-term trends, providing a balanced strategy that adapts to changing conditions.
This dual approach provides a more nuanced view of market trends, improving trading accuracy.
Parabolic SAR + MACD
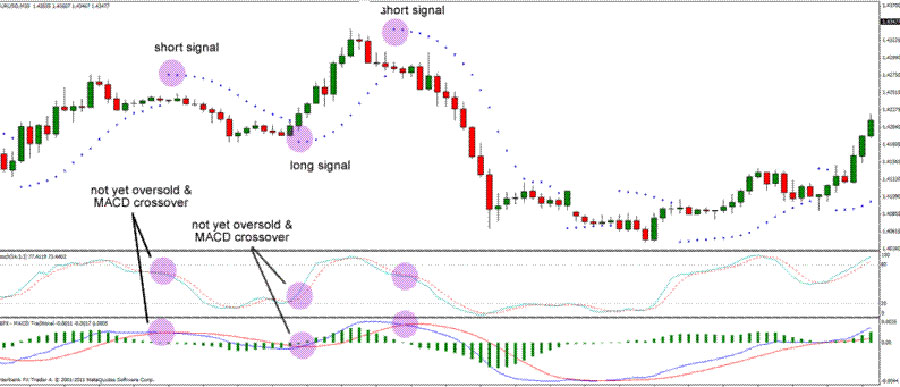
Integrating the Parabolic SAR with the Moving Average Convergence Divergence (MACD) helps filter out false signals by adding a momentum component to the strategy:
- MACD Confirmation: Use the MACD to confirm the momentum behind the SAR signals. For instance, a buy signal from the SAR is more reliable if the MACD is also indicating bullish momentum (e.g., MACD line is above the signal line).
- Divergence Filtering: If the SAR signals a buy but the MACD shows bearish momentum, the signal might be a false positive, prompting the trader to wait for further confirmation.
This strategy combines trend and momentum indicators, enhancing signal reliability and trading confidence.
Incorporating Volume Indicators
Volume indicators can provide additional insights into the strength of a trend, further refining the Parabolic SAR signals:
- On-Balance Volume (OBV): By analyzing the OBV alongside the SAR, traders can assess whether the volume supports the price movement. A rising OBV confirms a bullish trend, while a declining OBV confirms a bearish trend.
- Volume Weighted Average Price (VWAP): Using VWAP in conjunction with the SAR can help in identifying significant price levels, enhancing the accuracy of entry and exit points.
Incorporating volume indicators adds another layer of confirmation, reducing the likelihood of false signals.
Read More: Best Indicator to Use with Parabolic SAR
Example of an Advanced Strategy
Consider a trader using the Parabolic SAR in combination with the MACD and 20-period moving average:
- Signal Generation:
- The SAR signals a buy when dots shift below the price.
- The 20-period moving average crosses above the 40-period moving average.
- The MACD line is above the signal line, indicating bullish momentum.
- Trade Execution:
- Upon confirmation from all three indicators, the trader enters a long position.
- Risk Management:
- A trailing stop-loss is set using the SAR dots.
- The trader monitors the MACD for any signs of momentum reversal.
- Exit Strategy:
- If the SAR signals a reversal by shifting above the price, the trader exits the position.
- Alternatively, if the MACD indicates bearish momentum, the trader may also choose to exit early.
This multi-indicator approach ensures that trades are backed by both trend and momentum confirmations, enhancing overall strategy reliability.
Timeframe-Specific Strategies
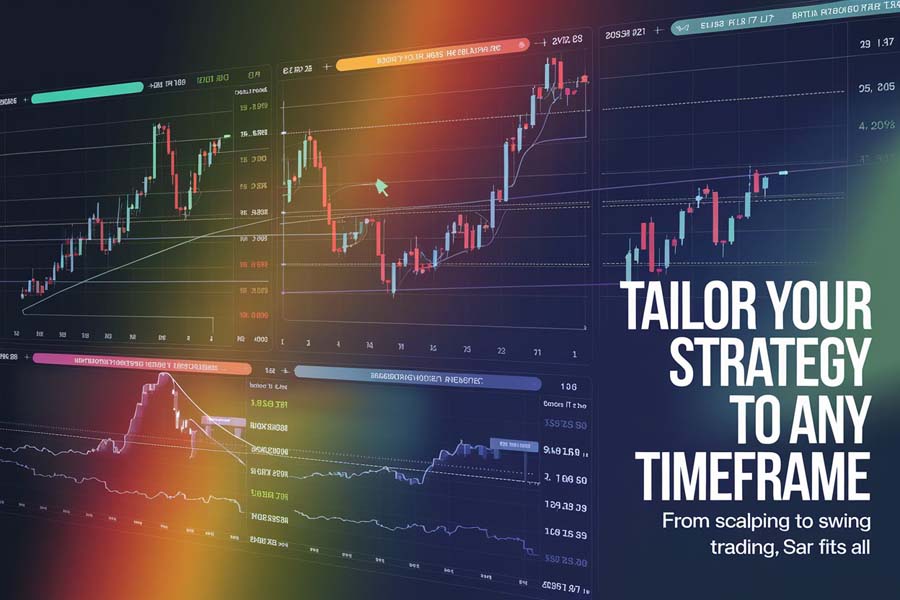
Different trading timeframes require tailored strategies to maximize the effectiveness of the Parabolic SAR Indicator. Whether you’re an intraday trader or prefer longer-term trades, adjusting the SAR settings to suit your trading style is essential.
Intraday Trading with Parabolic SAR
For traders focusing on short-term trades, adjusting the Parabolic SAR settings to suit intraday timeframes is crucial for capturing quick market moves.
- M5 or M15 Timeframes: Setting the acceleration factor higher (e.g., AF of 0.04) increases the indicator’s sensitivity, allowing for quicker responses to price movements. This heightened sensitivity is beneficial for capturing rapid trends within a single trading day.
- Scalping Strategies: Utilize the adjusted SAR to capture small price movements, enabling traders to execute multiple trades within a single trading session. Scalping relies on high-frequency trades, making the responsiveness of the SAR indicator particularly advantageous.
- Example Setup:
- Timeframe: 5-minute charts
- SAR Settings: AF of 0.04, Maximum AF of 0.2
- Strategy: Enter long positions when SAR dots shift below the price and short positions when SAR dots shift above. Use SAR dots as trailing stops to lock in profits quickly.
Intraday strategies with the Parabolic SAR offer opportunities for quick profits by capitalizing on short-term price fluctuations.
Higher Timeframe Strategy
Long-term traders can benefit from adapting the Parabolic SAR for higher timeframes, focusing on major trend movements and reducing trading frequency.
- H1 and H4 Timeframes: Lowering the acceleration factor (e.g., AF of 0.02) reduces the indicator’s sensitivity, filtering out minor price movements and focusing on significant trend changes. This adjustment helps in maintaining a clear view of the overarching market trend.
- Longer-Term Trades: Suitable for trading major indices and currencies, this approach aligns with broader market trends, providing a stable framework for sustained trading. By focusing on higher timeframes, traders can avoid the noise and volatility inherent in shorter periods.
- Example Setup:
- Timeframe: 1-hour or 4-hour charts
- SAR Settings: AF of 0.02, Maximum AF of 0.2
- Strategy: Enter long positions when SAR dots shift below the price on the higher timeframe charts and short positions when SAR dots shift above. Use SAR dots as trailing stops to manage long-term trades effectively.
Higher timeframe strategies with the Parabolic SAR cater to traders seeking long-term gains and reduced trading frequency.
Swing Trading with Parabolic SAR
Swing traders, who aim to capture larger price movements over several days or weeks, can also benefit from the Parabolic SAR by adjusting settings to balance sensitivity and reliability.
- D1 and D4 Timeframes: Using daily or weekly charts with moderate SAR settings (e.g., AF of 0.03) can help in identifying medium-term trend reversals and entry points.
- Trade Duration: Swing trades typically last from a few days to several weeks, allowing traders to ride substantial market moves while avoiding the noise of shorter timeframes.
- Example Setup:
- Timeframe: Daily charts
- SAR Settings: AF of 0.03, Maximum AF of 0.2
- Strategy: Enter positions based on SAR signals confirmed by swing patterns and other indicators like RSI or Stochastic Oscillator. Use SAR dots to trail stop-loss levels, adjusting them as the trend progresses.
Swing trading with the Parabolic SAR provides a balanced approach, capturing significant market moves while maintaining manageable trade durations.
Common Pitfalls and Tips
Avoiding Sideways Markets
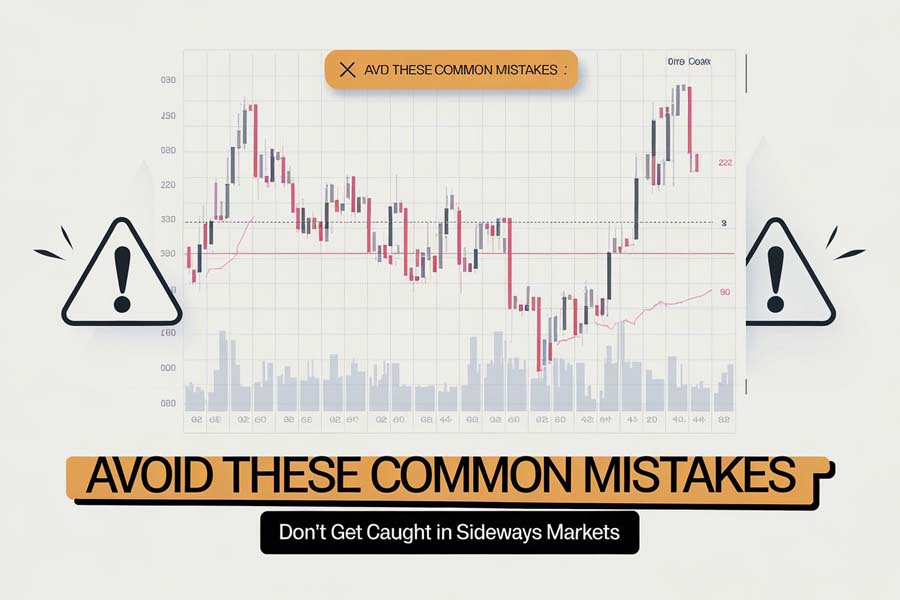
The Parabolic SAR thrives in trending markets but can falter in consolidating or sideways markets:
- SAR’s Weaknesses: In non-trending environments, the indicator may produce false signals, leading to potential losses.
- Mitigation Strategies: Combine the Parabolic SAR with the Directional Movement Index (DMI) to confirm trend strength and filter out signals during sideways movements.
By recognizing and addressing market conditions, traders can maintain the effectiveness of the Parabolic SAR Indicator Strategy.
Trade Management
Effective trade management is crucial for maximizing profits and minimizing losses:
- Exiting Trades: Use SAR dot reversals as signals to exit trades, ensuring timely responses to trend changes.
- Risk/Reward Targets: Establish predefined risk/reward ratios to guide exit decisions, maintaining discipline and consistency in trading.
Proper trade management enhances overall trading performance and safeguards against unexpected market shifts.
Pro Tips for Advanced Traders

For those looking to elevate their trading strategies, here are some advanced tips using the Parabolic SAR Indicator:
1. Combine with Moving Averages
Integrate the Parabolic SAR with multiple moving averages to confirm trend directions and enhance signal reliability. For example, using a 50-period and 200-period moving average alongside the SAR can provide deeper insights into long-term trends.
2. Use Multiple Timeframes
Analyzing different timeframes simultaneously can offer a comprehensive view of market trends. For instance, aligning signals from both daily and hourly charts ensures that trades are supported by broader market movements.
3. Implement Trailing Stops
Leverage the Parabolic SAR as a dynamic trailing stop to lock in profits as trends develop. Adjusting the trailing stop based on the indicator’s signals ensures that profits are maximized while minimizing potential losses.
4. Divergence Analysis
Identify divergences between the Parabolic SAR and price movements to anticipate potential trend reversals. Divergences can serve as early warning signals, allowing traders to adjust their positions proactively.
Incorporating these advanced techniques can significantly enhance the effectiveness and profitability of the Parabolic SAR Indicator Strategy.
Opofinance Services: Your Trusted Partner in Forex Trading
When implementing the Parabolic SAR Indicator Strategy, having a reliable broker is essential. Opofinance, an ASIC-regulated forex broker, offers exceptional services tailored to meet the needs of traders. Their social trading service allows you to connect with experienced traders and replicate their strategies effortlessly. As a feature on the MT5 brokers list, Opofinance provides a robust trading platform with safe and convenient deposit and withdrawal methods. Partnering with Opofinance ensures you have the right tools and support to execute your Parabolic SAR Indicator Strategy effectively and securely.

Choose Opofinance for a seamless and profitable trading experience.
Key Takeaways
- The Parabolic SAR Indicator Strategy is a potent tool for identifying trends and potential reversal points in the forex market.
- Effective Implementation involves recognizing trends, spotting buy and sell signals, setting stop-loss orders, and confirming signals with other indicators.
- Advantages include clear trading signals, effective risk management, versatility across different timeframes, and enhanced trading discipline.
- Common Mistakes to Avoid include overreliance on the indicator, ignoring market volatility, poor stop-loss management, and neglecting backtesting.
- Advanced Strategies such as combining the Parabolic SAR with other indicators, using multiple timeframes, implementing trailing stops, and conducting divergence analysis can significantly boost trading performance.
- Choosing a Reliable Broker like Opofinance, which is ASIC-regulated and offers robust trading services, is crucial for successful strategy implementation.
Harness the power of the Parabolic SAR Indicator Strategy to transform your trading outcomes today!
Conclusion
The Parabolic SAR Indicator Strategy is a valuable asset for forex traders, particularly in trending markets where it excels in identifying trend reversals and guiding entry and exit points. However, its effectiveness can be limited in sideways or highly volatile markets, necessitating the use of complementary indicators and robust risk management practices. To maximize its potential, traders should invest time in backtesting the strategy and combining it with other tools to enhance accuracy and reliability. With the right approach and a trusted broker like Opofinance, the Parabolic SAR Indicator Strategy can significantly contribute to your trading success.
Can the Parabolic SAR Indicator be adapted for cryptocurrency trading?
Yes, the Parabolic SAR Indicator can be effectively used in cryptocurrency trading. Given the high volatility and dynamic nature of crypto markets, combining the SAR with other volatility indicators like Bollinger Bands or the Average True Range (ATR) can help filter out false signals and improve trading accuracy.
How does market news impact the effectiveness of the Parabolic SAR Strategy?
Market news can significantly influence price movements, potentially causing rapid trend reversals. During major news releases, the increased volatility may lead to false signals from the Parabolic SAR. It’s advisable to be cautious and possibly avoid trading during high-impact news events or use additional confirmation tools to validate SAR signals.
What customization options are available for the Parabolic SAR Indicator?
Traders can customize the Parabolic SAR by adjusting the acceleration factor (AF) and the maximum step value. Increasing the AF makes the indicator more sensitive to price changes, providing earlier signals but potentially more false alarms. Conversely, decreasing the AF reduces sensitivity, leading to fewer but more reliable signals. Customizing these settings based on the specific market and trading style can enhance the indicator’s effectiveness.


