Trade with standard conditions for all experience levels
Access deep liquidity and tighter spreads for fast trades
Professional-grade ECN with lower spreads for expert traders
Copy top traders or share strategies with the community
Boost your trading with funded accounts
Advanced ECN with cTrader platform for fast execution
Upgraded ECN features for high-volume and active traders
Easily copy successful traders on the cTrader platform
Compare account features to find the right trading option
Explore deposit and withdrawal options for your transactions
Classic platform with fast execution and essential tools
Multi-asset platform with advanced features for smooth trading
Innovative platform with powerful tools and charting features
Compare trading Platforms to find the best fit for you.
Access TradingView’s charts, real-time data, and tools, all in one platform.
Copy and follow top traders for proven strategies
Join our partnership program to expand your trading opportunities
Trade with funded accounts and increase your profit potential
Use our app for quick, efficient, and accessible trading tools
Our promise of compliance and fund security
Access agreements that support transparent trading operations.
Access our dedicated support for any assistance
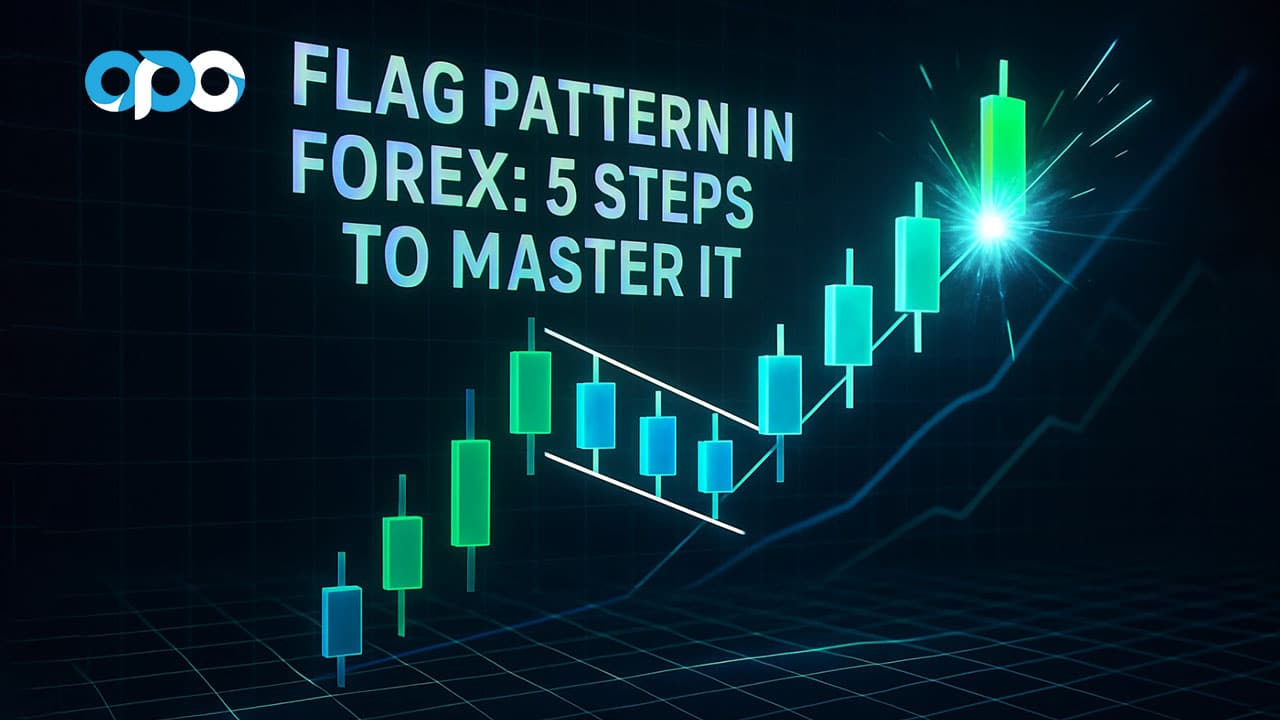
The flag pattern in forex is a powerful continuation signal indicating that a market’s prevailing trend is likely to resume after a brief pause. For any trader working with a
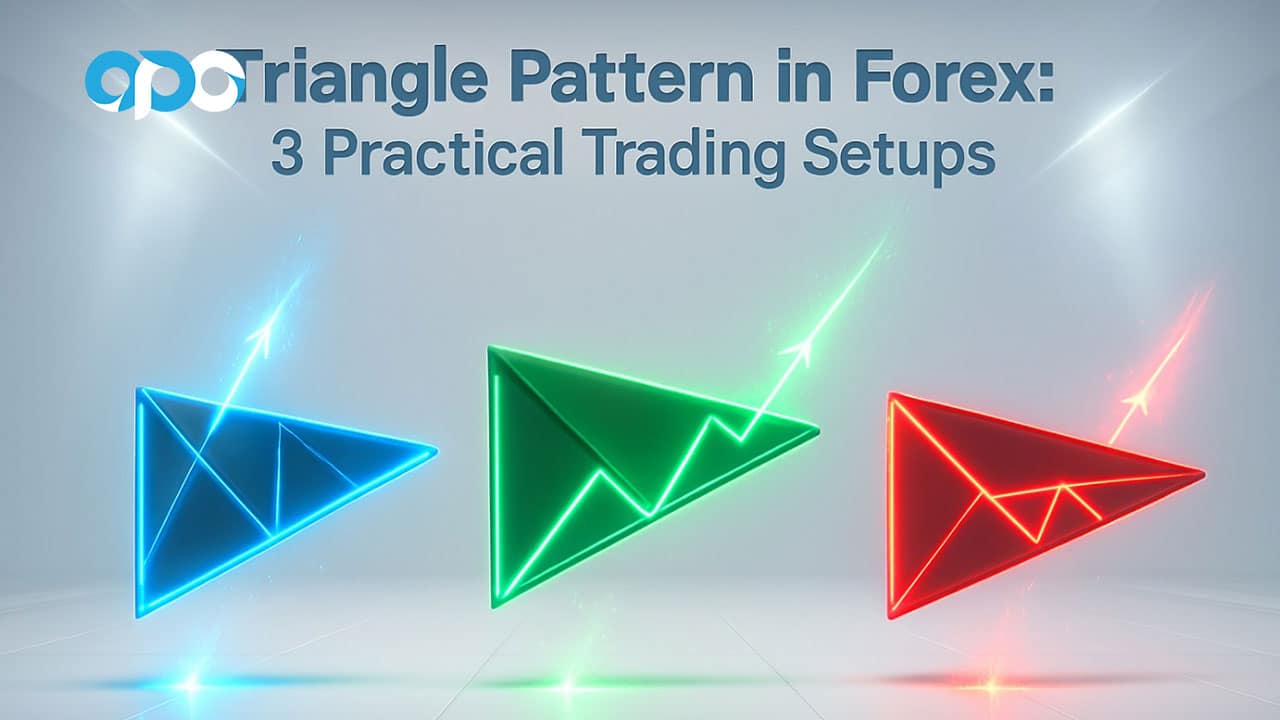
A triangle pattern in forex is a consolidation chart formation where price action becomes increasingly compressed between two converging trendlines. It signals a temporary pause in the market before a
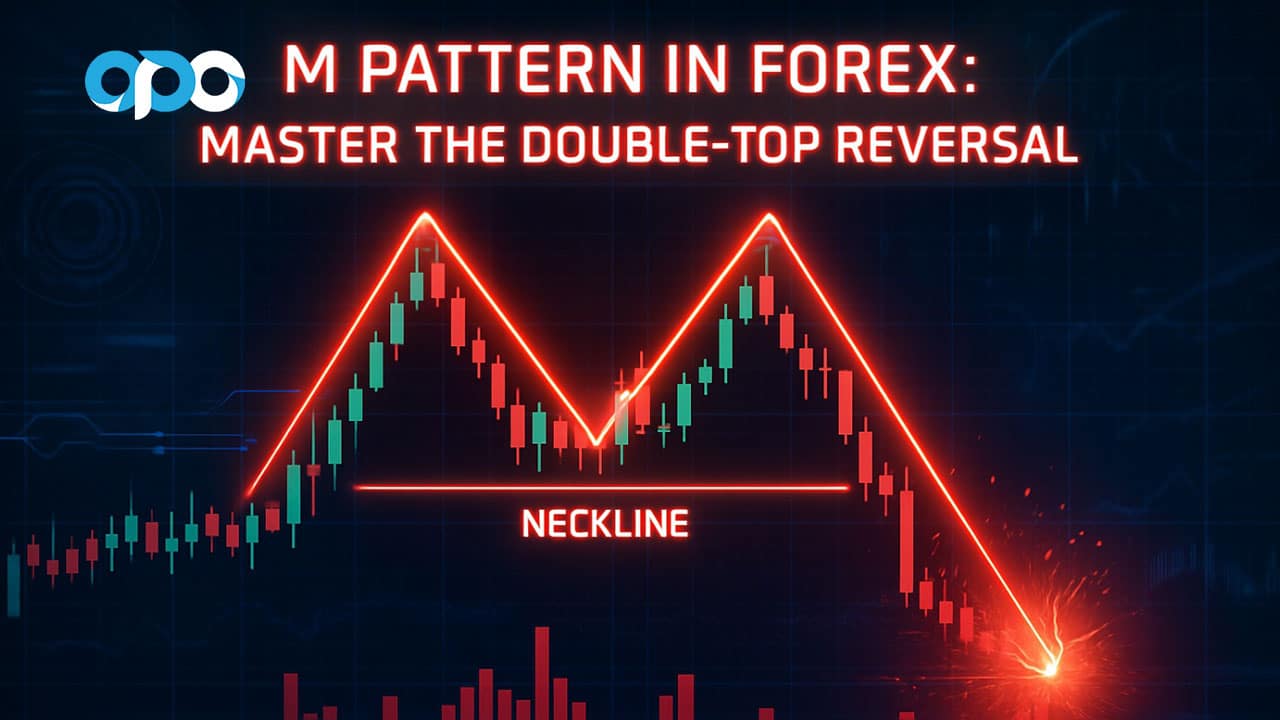
M Pattern in Forex: Spot, Trade & Master the Double-Top Reversal The m pattern in forex is a powerful bearish reversal signal that appears as two consecutive peaks of roughly
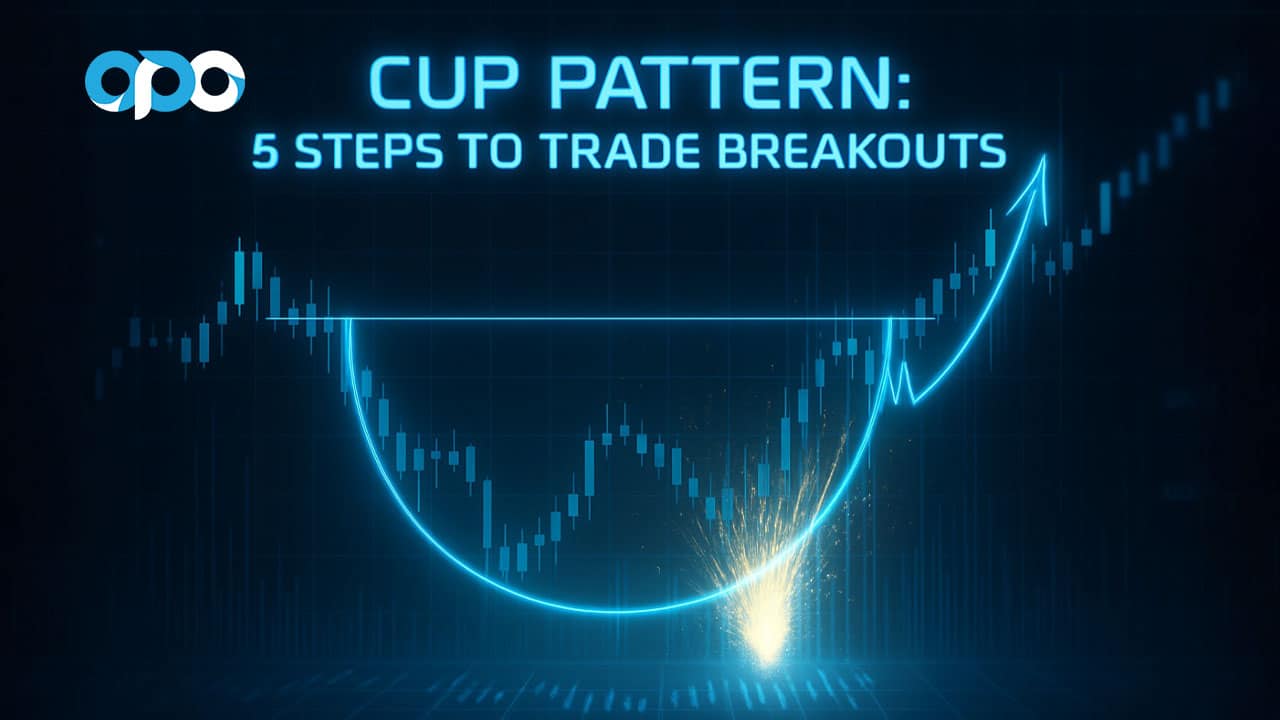
The cup pattern in forex is a powerful bullish signal that can precede significant upward moves, making it a favorite among technical traders. Mastering the cup and handle pattern in
Are you tired of watching a currency pair bottom out and then rally aggressively without you? Spotting a true market bottom before it takes off is one of the most
In the perennial debate of heikin ashi vs candlestick charts, the answer depends entirely on your trading objective. For traders seeking to identify and ride strong trends with less market
The Gartley pattern is a five-point harmonic chart structure that helps traders identify potential price reversals with a high degree of accuracy. It uses specific Fibonacci ratios to pinpoint market
When navigating the markets, traders constantly seek clarity amidst the chaos of price fluctuations. The choice of charting tool is a pivotal decision in this quest. The debate over renko
The best Heikin Ashi strategy is a simple, trend-following system that enters on a candle color change confirmed by a momentum indicator like the RSI, MACD, or a moving average.
Drop your phone number below and take the first step today.🚀