

Feeling a bit adrift when trying to pinpoint solid entry and exit points in the dynamic world of swing trading? It’s a common challenge. Missing the optimal moment or entering a trade late can diminish potential profits and affect your confidence. Simply relying on instinct or overly complex charts often leads to more confusion than clarity. What’s truly beneficial is a clear, visual method to interpret market sentiment and anticipate potential price movements.
This is precisely where mastering the best candlestick patterns for swing trading becomes incredibly valuable. These visual formations offer potent insights, helping you make more informed decisions, perhaps aided by a reliable online forex broker. This article will serve as your guide to the most effective patterns and demonstrate how to utilize them in your trading.
What is Swing Trading?
Consider swing trading as aiming to capture the significant ‘waves’ or swings in market price. It’s a trading style where individuals seek to profit from price movements occurring over a few days to several weeks. Unlike day traders who finalize positions within the same day, swing traders maintain positions longer. The objective isn’t to catch every minor fluctuation but rather to identify a probable directional move, follow it for a period, and exit before a likely reversal. This involves careful analysis of price charts, typically on daily or 4-hour timeframes, to locate potential turning points or indications of trend continuation.
What are Candlestick Charts?
Candlestick charts provide a visual narrative of price action over time. With origins in 18th-century Japanese rice trading, they are now fundamental tools for technical analysts globally. Each ‘candlestick’ illustrates price activity during a defined period (e.g., one day, four hours). Let’s break down its components:
- The Real Body: This wider section displays the range between the opening and closing prices. Typically, green (or white) indicates the price closed higher than it opened (favorable for buyers), while red (or black) signifies it closed lower (favorable for sellers).
- The Wicks (Shadows): These are the thin lines extending above and below the real body. The upper wick marks the highest price reached, and the lower wick indicates the lowest price during that period.
The candle’s resultant shape and color offer an immediate visual summary of the balance of power between buyers (bulls) and sellers (bears) during that timeframe.
Why Candlesticks Crucial for Swing Traders
For anyone involved in swing trading, candlestick charts are indispensable. They offer immediate visual feedback on market psychology and potential shifts in momentum that might be slower to emerge using other indicators. Here’s why they are so vital:
- Market Sentiment Indicator: The size and color of the candle body, combined with the length of the wicks, quickly convey whether buyers or sellers dominated the period and the degree of their control.
- Identifying Potential Reversals: Specific candlestick patterns can signal that an existing trend may be losing strength and could reverse, presenting opportunities to enter new trades or exit current ones. Searching for the best candlestick patterns for swing trading often starts here.
- Confirming Trend Continuation: Other patterns suggest that a current trend is likely to persist, providing traders with the confidence to maintain a position or potentially add to it.
- Pinpointing Entry/Exit Points: Candlestick patterns, particularly when they manifest at significant technical levels (like support or resistance), can offer precise signals for initiating or concluding swing trades. Proficiency in interpreting these visual cues is fundamental to developing effective swing trading candlestick strategies.
How Candlesticks Signal Swings
Understanding individual patterns is the first step, but their true utility in swing trading emerges when interpreted within the broader market context. Candlesticks do more than just represent price; they articulate the ongoing struggle between buyers and sellers, offering clues about potential future movements ideal for capturing market swings.
Identifying Trend Reversals
One of the most valuable applications of candlestick analysis for swing traders is identifying potential trend reversals. Following a sustained uptrend or downtrend, specific patterns can emerge that signal exhaustion in the prevailing direction and the potential beginning of a move in the opposite direction. For example, a candle exhibiting a long upper wick after an uptrend might suggest sellers are beginning to exert more pressure, hinting at a possible pullback or reversal. Recognizing these reversal signals promptly allows swing traders to position themselves advantageously for the next anticipated swing, which is key when looking for the best candlestick patterns for swing trading opportunities.
Using Candlesticks for Continuation
Candlestick patterns aren’t solely about reversals; they can also signal the likelihood that a current trend will continue. During a robust uptrend, you might observe patterns indicating brief pauses or consolidation followed by renewed buying pressure. Conversely, within a downtrend, certain patterns might suggest that sellers remain firmly in control following a minor consolidation. These continuation patterns assist swing traders in deciding whether to hold an existing profitable position or even increase it, anticipating the current swing to extend. Effective use of candlestick patterns for swing trading involves recognizing both reversal and continuation signals.
The Importance of Context
Crucially, the reliability of a candlestick pattern is heavily influenced by where it forms on the price chart. A pattern appearing in isolation mid-trend might be insignificant market noise. However, the identical pattern forming at a significant technical level carries substantially more interpretive weight. Understanding context helps filter signals and identify the truly best candlestick patterns for swing trading setups. Key contextual factors include:
- Support and Resistance Levels: A bullish reversal pattern (like a Hammer) appearing at a known support level constitutes a much stronger buy signal than one appearing randomly. Similarly, a bearish pattern (like a Shooting Star) at a resistance level suggests a higher probability of a downward move.
- Trend Lines: Patterns forming near established trend lines can signal either a bounce off the line (trend continuation) or a break through it (potential trend reversal).
- Moving Averages: Candlesticks interacting with key moving averages (e.g., the 50-period or 200-period MA) can provide strong confirmation signals for swing trade entries or exits.
Always analyze patterns within the framework of the overall market structure and in conjunction with other technical indicators to enhance trade probability.
Top Bullish Candlestick Patterns
Bullish candlestick patterns indicate that buyers are gaining dominance over sellers, potentially signaling the commencement of an upward price swing. Recognizing these formations, especially near key support levels or following a downtrend, can provide valuable entry points for long swing trades. Let’s examine some of the best candlestick patterns for swing trading from a bullish perspective.
The Hammer Pattern
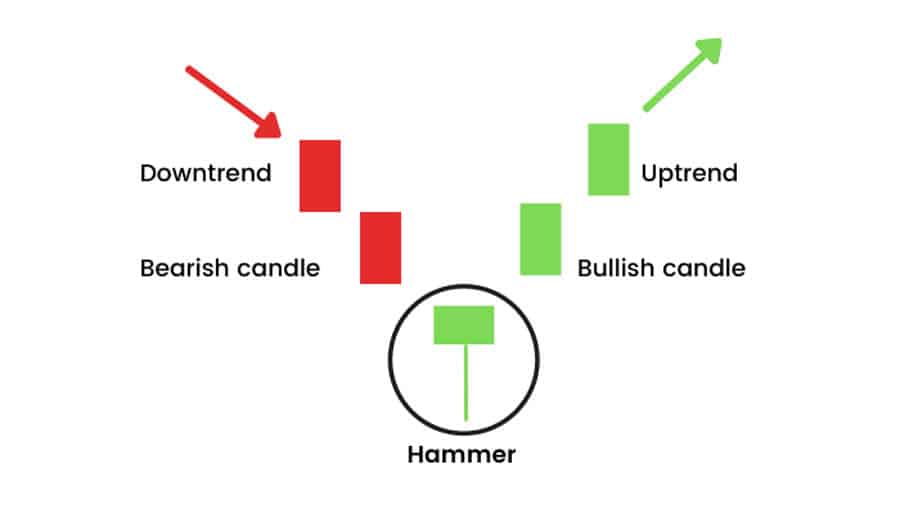
The Hammer is a single-candle bullish reversal pattern that typically forms after a price decline. It is characterized by a small real body situated near the top of the trading range and a long lower wick (at least twice the height of the body), with minimal or no upper wick. While the body’s color is not paramount, a green or white body is considered slightly more bullish.
The underlying psychology suggests that sellers significantly pushed the price down during the period, but strong buying pressure emerged to drive the price back up, closing near the opening level. For swing traders, a Hammer hints at potential seller capitulation and signals a possible market bottom, presenting a potential long entry point, ideally confirmed by the subsequent candle closing higher.
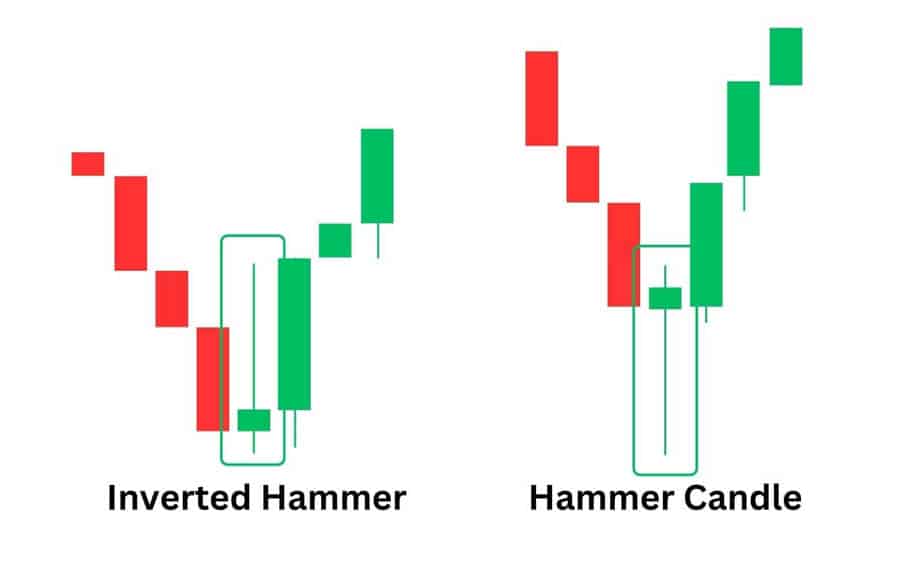
The Inverted Hammer
Similar to the Hammer, the Inverted Hammer is a single-candle pattern appearing after a downtrend, but its structure is reversed: it features a small real body at the lower end of the range and a long upper wick, with little or no lower wick. Although seemingly counterintuitive, the psychology suggests buyers attempted to propel prices higher during the period, even though sellers managed to push the price back down near the open by the period’s close.
Despite this seller pushback, the initial buying attempt can be an early indication of bullish potential. However, the Inverted Hammer generally requires stronger confirmation than the standard Hammer; traders typically await the next candle closing decisively above the Inverted Hammer’s high before considering a long entry.
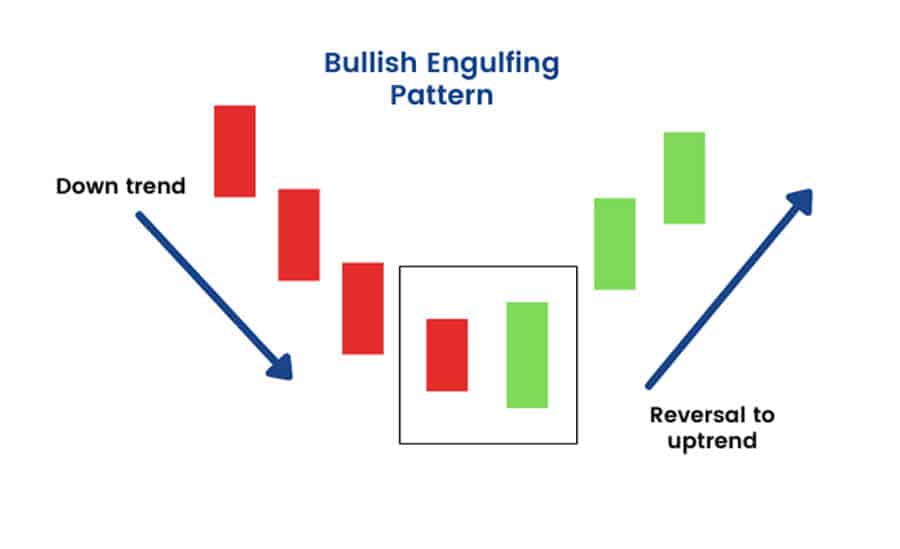
The Bullish Engulfing Pattern
This is a potent two-candle reversal pattern observed after a downtrend. The first candle is bearish (red/black). The subsequent candle is bullish (green/white), and its real body completely “engulfs” the real body of the preceding bearish candle (meaning it opens lower than the prior close but closes higher than the prior open). This pattern signifies a pronounced shift in market sentiment, where buyers have decisively overcome sellers. Increased trading volume on the engulfing candle adds further confirmation. Swing traders interpret this as a strong signal that the downtrend may have concluded, offering a compelling rationale for entering a long position, often with a stop-loss placed below the low of the engulfing pattern.
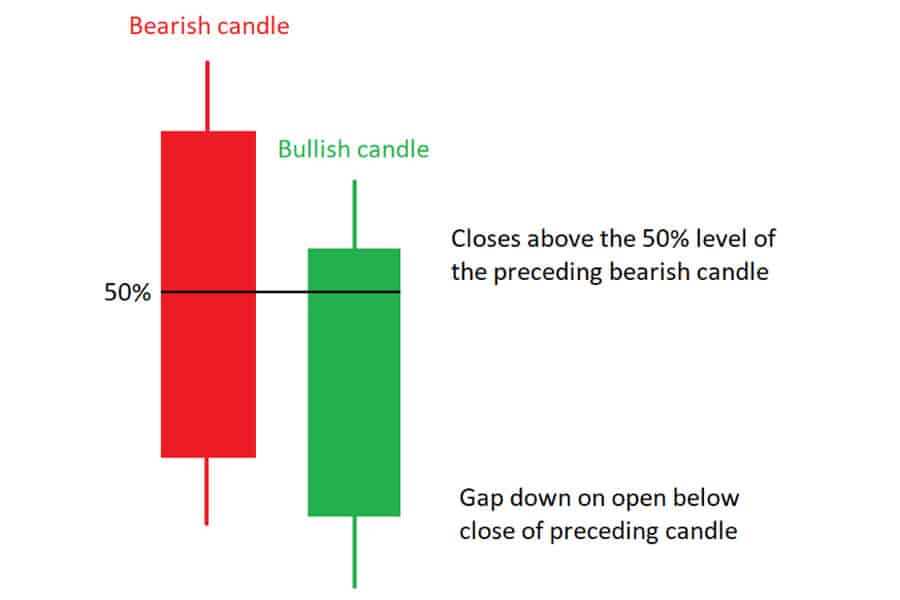
The Piercing Line
The Piercing Line is another two-candle bullish reversal pattern identified after a downtrend. The initial candle is a strong bearish one. The second candle opens below the low of the first candle (creating a gap down) but then rallies robustly, closing well within the body of the first candle – specifically, it must close above the midpoint of the first candle’s real body. While not as forceful as a Bullish Engulfing (as it doesn’t fully negate the prior candle’s loss), it demonstrates significant buying pressure emerging after an initial downward gap, suggesting bulls are actively countering sellers. Confirmation on the next candle is often advisable before entry.
The Morning Star
The Morning Star is a three-candle bullish reversal pattern suggesting a potential bottom following a downtrend. Its structure consists of:
- A large bearish candle reflecting the downtrend’s momentum.
- A small-bodied candle (which can be bullish, bearish, or a Doji) that typically gaps down from the first candle. This signifies market indecision.
- A large bullish candle that ideally gaps up on the open and closes significantly into the body of the first bearish candle (preferably closing above its midpoint).
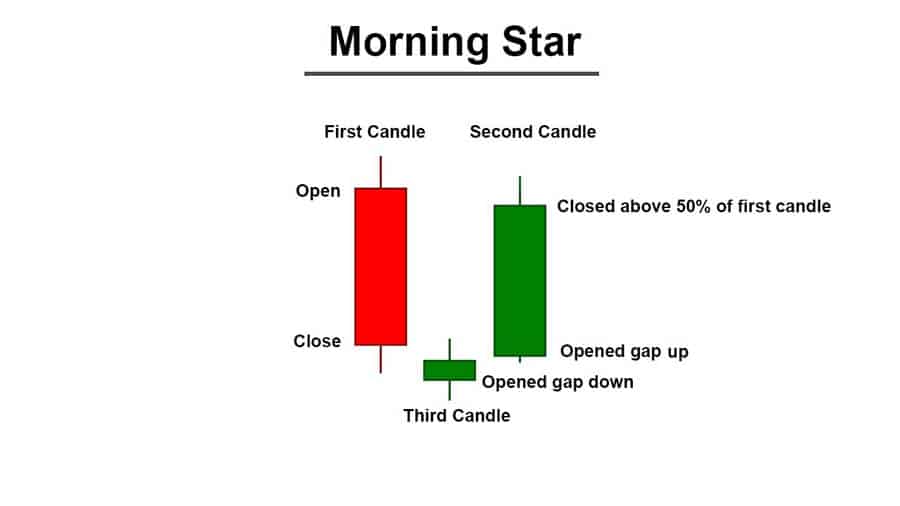
This pattern visually represents renewed hope (“morning star”) following a period of decline (“darkness”). The strong bullish third candle confirms that buyers have regained control. It is considered a reliable reversal signal and ranks among the best candlestick patterns for swing trading entries.
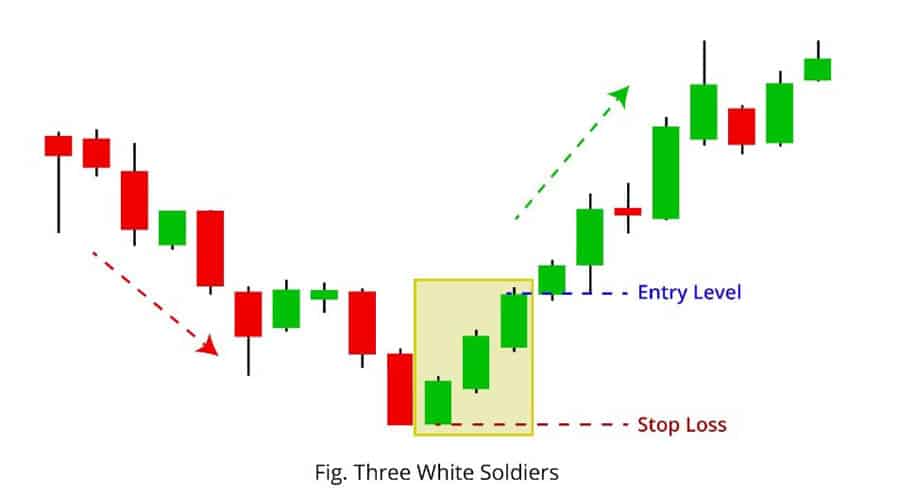
Three White Soldiers
This pattern typically signals a reversal of a downtrend but can also function as a strong bullish continuation pattern within an established uptrend. It comprises three consecutive long-bodied bullish candles. Each candle ideally opens within the real body of the previous candle and closes progressively higher, often near the high of its period. This demonstrates strong, sustained buying pressure over three trading periods. Swing traders view this as a high-probability signal that further upward momentum is likely, either confirming the start of a new uptrend or the continuation of an existing one. Its clarity makes it one of the favored candlestick patterns for swing trading.
Top Bearish Candlestick Patterns
Bearish candlestick patterns signal that sellers are gaining control over buyers, potentially indicating the beginning of a downward price swing or the conclusion of an uptrend. Identifying these patterns, particularly near resistance levels, can provide swing traders with opportunities to initiate short positions or exit existing long positions.
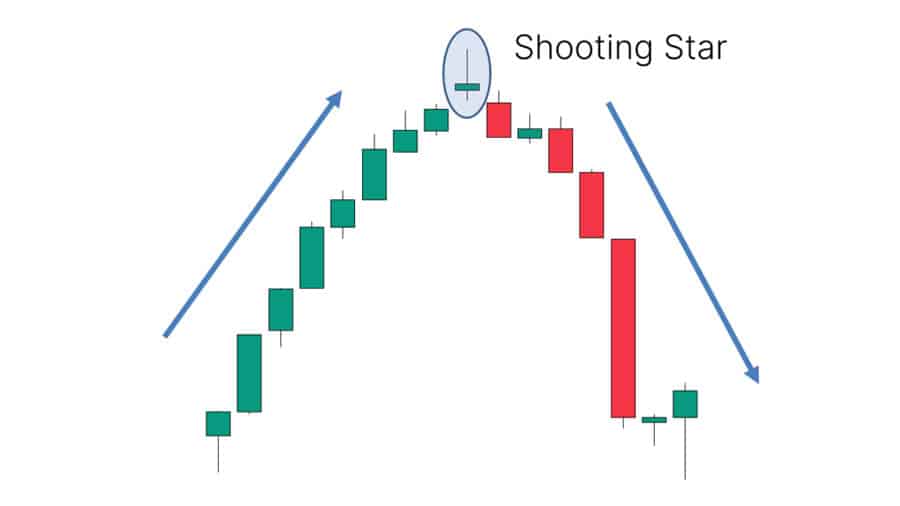
The Shooting Star
The Shooting Star is a single-candle bearish reversal pattern that appears after an uptrend. It resembles an Inverted Hammer but occurs at the peak of a move. It features a small real body at the lower end of the trading range, a long upper wick (at least twice the body size), and little or no lower wick. The psychology implies that buyers attempted to push the price higher, but sellers intervened forcefully, driving the price back down to close near the open. This failure to sustain higher prices suggests the uptrend might be faltering.
Swing traders typically look for confirmation (e.g., the next candle closing lower) before considering a short entry based on this signal, a common approach when evaluating candlestick patterns for swing trading.
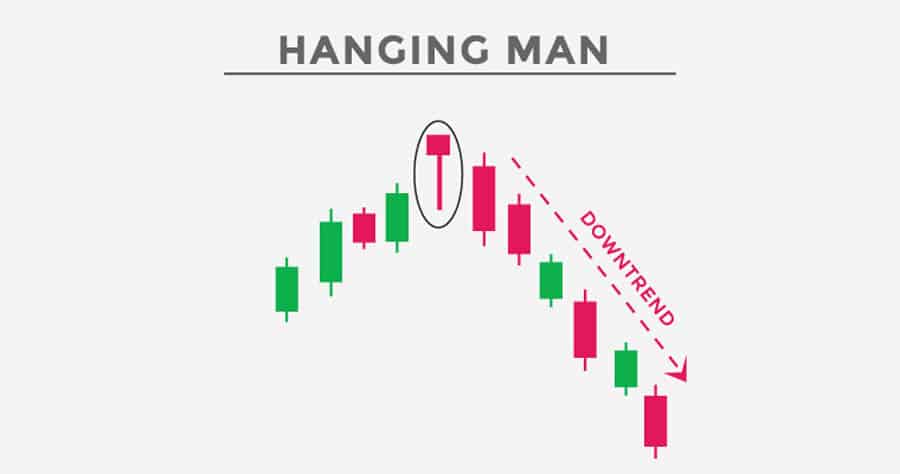
The Hanging Man
The Hanging Man is the bearish counterpart to the Hammer. It is a single-candle pattern appearing after an uptrend and possesses the same shape as a Hammer (small body near the top, long lower wick, minimal upper wick).
Although it might appear bullish initially due to its shape, its appearance following a price rise serves as a warning sign. It suggests that significant selling occurred during the period (creating the long lower wick), even though buyers managed to push the price back up near the open by the close. This underlying selling pressure hints at weakening bullish momentum. Like the Inverted Hammer, it necessitates bearish confirmation (the next candle closing lower) before being acted upon as a reliable short signal.
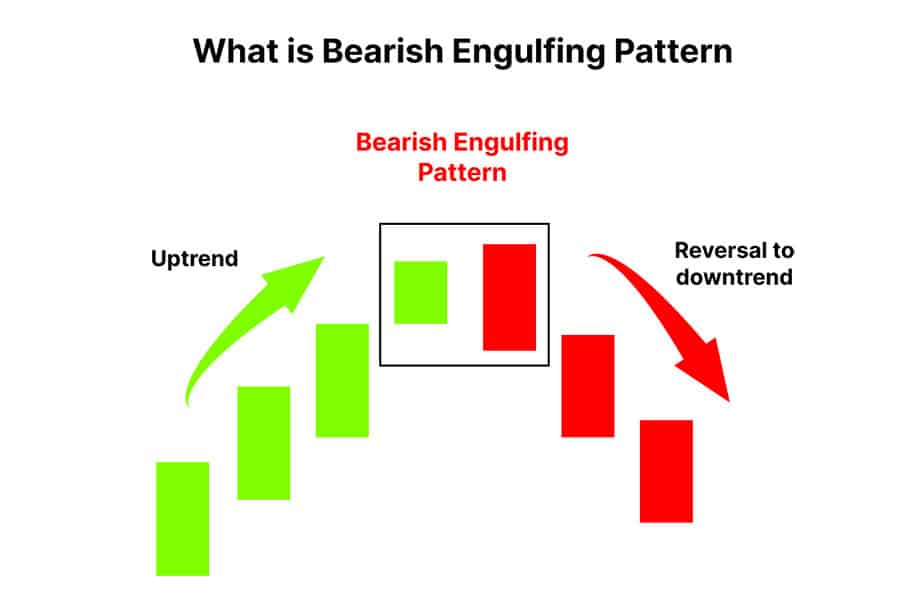
The Bearish Engulfing Pattern
This potent two-candle reversal pattern materializes after an uptrend. The first candle is bullish (green/white). The second candle is bearish (red/black), and its real body completely engulfs the real body of the preceding bullish candle (opening higher than the prior close and closing lower than the prior open). This signifies a powerful shift where sellers have decisively overwhelmed buyers, potentially marking a market top. Increased volume accompanying the bearish engulfing candle strengthens the signal. Swing traders regard this as a strong indication to contemplate short positions or exit long ones, often placing a protective stop-loss above the high of the pattern.
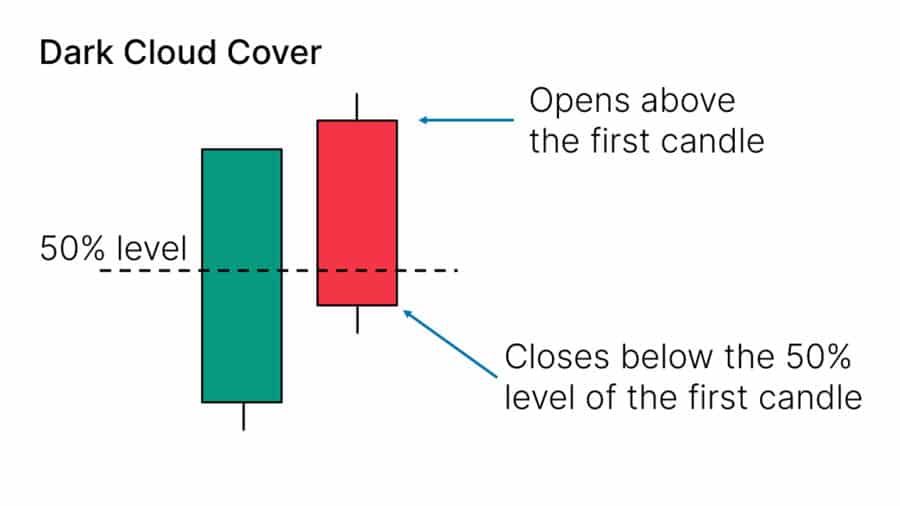
Dark Cloud Cover
Similar to the Bearish Engulfing but generally considered slightly less potent, the Dark Cloud Cover is a two-candle bearish reversal pattern appearing after an uptrend. The first candle is a strong bullish candle. The second candle opens above the high of the first candle (gapping up) but then reverses course and closes significantly within the body of the first candle – specifically, below the midpoint of the first candle’s real body. The inability to sustain the initial gap up, coupled with the deep penetration into the prior bullish candle’s gains, signals the emergence of strong selling pressure. Confirmation is typically preferred before initiating short trades.
The Evening Star
The Evening Star is a three-candle bearish reversal pattern, the counterpart to the Morning Star, signaling a potential top after an uptrend. It comprises:
- A large bullish candle reflecting the uptrend.
- A small-bodied candle (bullish, bearish, or Doji) that typically gaps up from the first candle, indicating indecision at the peak.
- A large bearish candle that ideally gaps down on the open and closes well into the body of the first bullish candle (preferably below its midpoint).
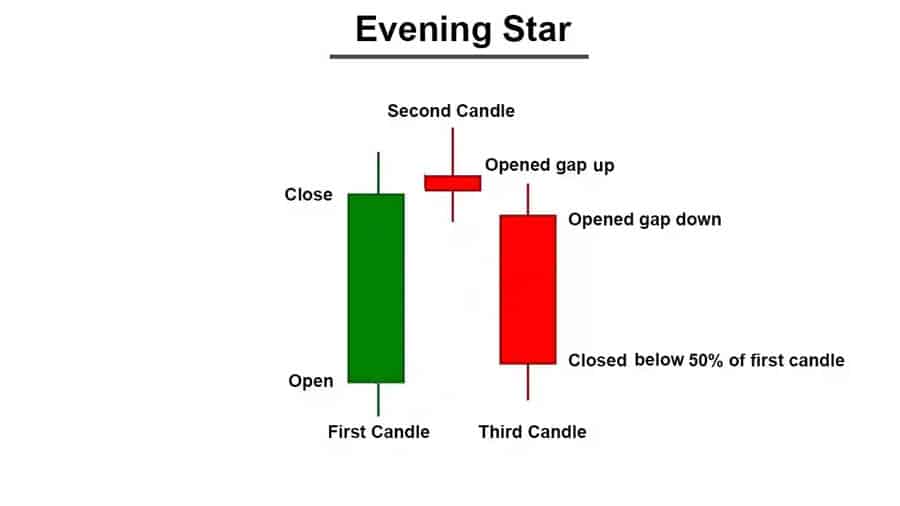
This pattern visually represents the transition from bullish optimism to bearish control. The decisive third candle confirms the reversal, making it a strong signal for swing traders to consider initiating short positions. It’s often cited among the best candlestick patterns for swing trading reversals.
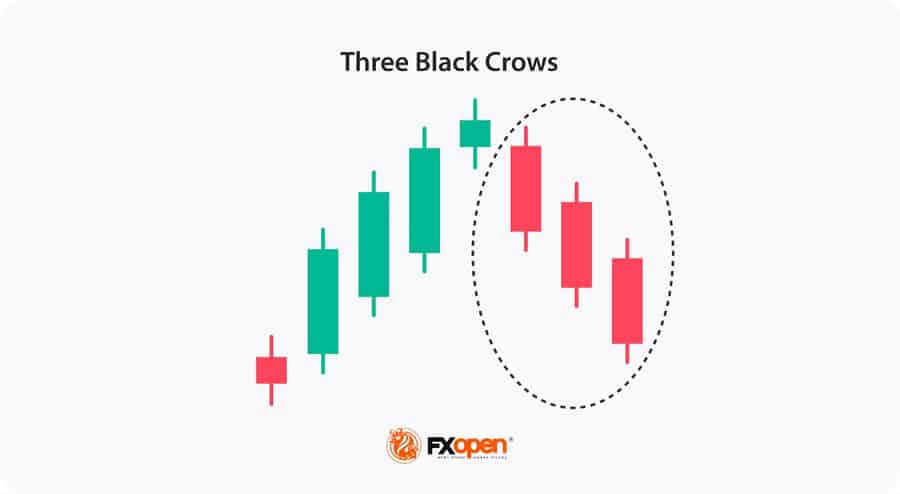
Three Black Crows
This pattern serves as the bearish equivalent of the Three White Soldiers and frequently signals the reversal of an uptrend, although it can also function as a bearish continuation pattern. It consists of three consecutive long-bodied bearish candles. Each typically opens within the real body of the previous candle and closes progressively lower, often near the low of its period. This pattern indicates sustained and aggressive selling pressure over three periods. Swing traders interpret this as a high-probability signal that further downside movement is likely, prompting consideration of short entries or exits from long positions.
Key Indecision/Continuation Patterns
Not all candlestick patterns signal definitive reversals. Some indicate indecision or equilibrium in the market, while others suggest a likely continuation of the existing trend following a brief pause. Recognizing these nuances is also crucial for effective swing trading, providing valuable context and potential confirmation for other signals.
Doji Variations
A Doji candle forms when the opening and closing prices are virtually identical (or extremely close), resulting in a minimal or non-existent real body. It signifies equilibrium or pronounced indecision between buyers and sellers. The lengths of the upper and lower wicks provide additional insights:
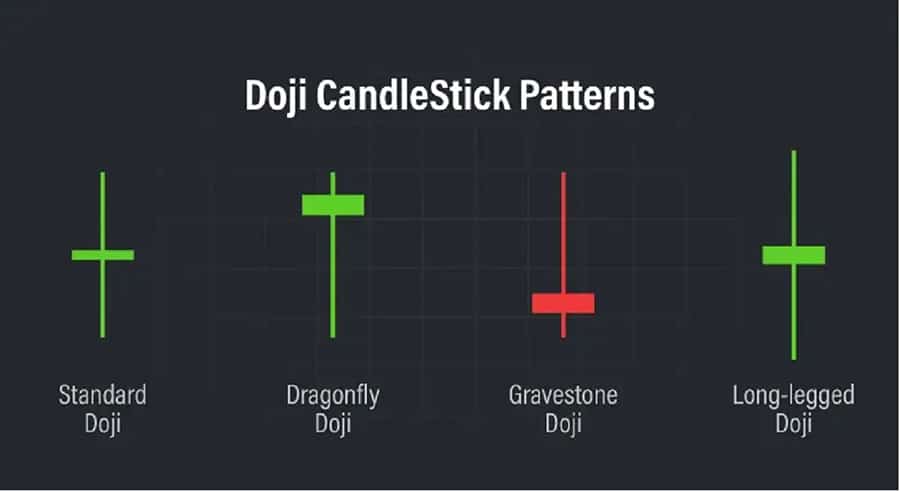
- Standard Doji: Exhibits a cross-like shape, indicating general market indecision.
- Long-Legged Doji: Features long upper and lower wicks, showing significant price fluctuation during the period but ultimately ending in indecision. Can sometimes precede a reversal.
- Dragonfly Doji: Possesses a long lower wick but no upper wick (resembling a ‘T’). When appearing after a downtrend, it can be interpreted bullishly as buyers rejected lower prices. Confirmation is required.
- Gravestone Doji: Has a long upper wick but no lower wick (an inverted ‘T’). When forming after an uptrend, it can be viewed bearishly as sellers rejected higher prices. Confirmation is needed.
The significance of any Doji depends heavily on the preceding trend and its location on the chart (e.g., at support/resistance).
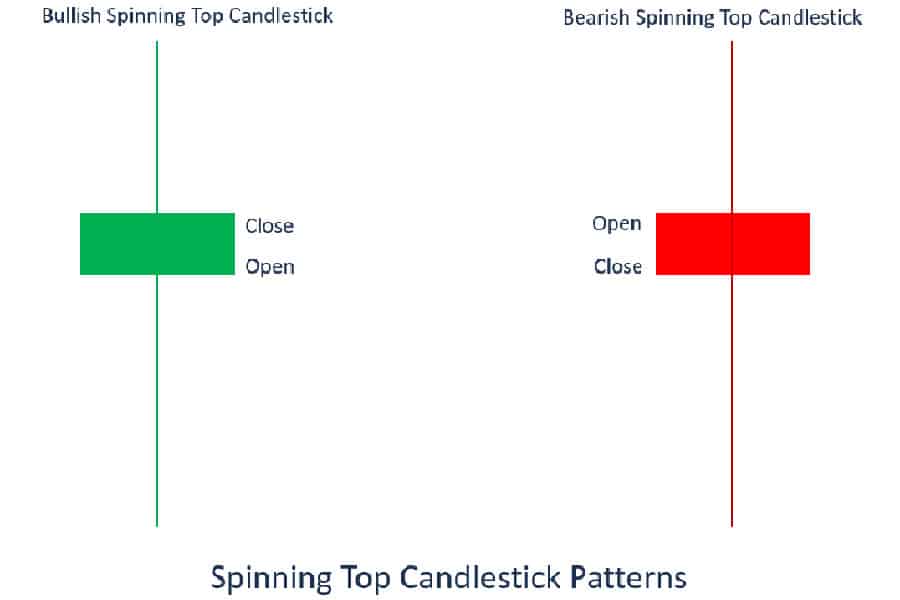
Spinning Tops
Spinning Tops resemble Dojis but have small real bodies (slightly larger than a Doji’s). They also feature both upper and lower wicks, often of similar length. Like Dojis, they represent indecision – neither buyers nor sellers achieved significant dominance during the period. They frequently appear during periods of market consolidation or preceding potential reversals. While not powerful standalone signals, multiple Spinning Tops occurring together can highlight a deceleration of momentum in the current trend.
Harami (Bullish/Bearish)
The Harami pattern (derived from the Japanese word for “pregnant”) is a two-candle pattern often considered a signal of potential reversal or pause, although generally less potent than Engulfing patterns. It consists of a large real body candle followed by a small real body candle (opposite color preferred but not essential) that is completely contained within the range of the previous candle’s real body.
- Bullish Harami: Occurs after a downtrend (large bearish candle followed by a small bullish/bearish candle contained within). Suggests that selling momentum is potentially stalling.
- Bearish Harami: Occurs after an uptrend (large bullish candle followed by a small bearish/bullish candle contained within). Suggests that buying momentum might be waning.
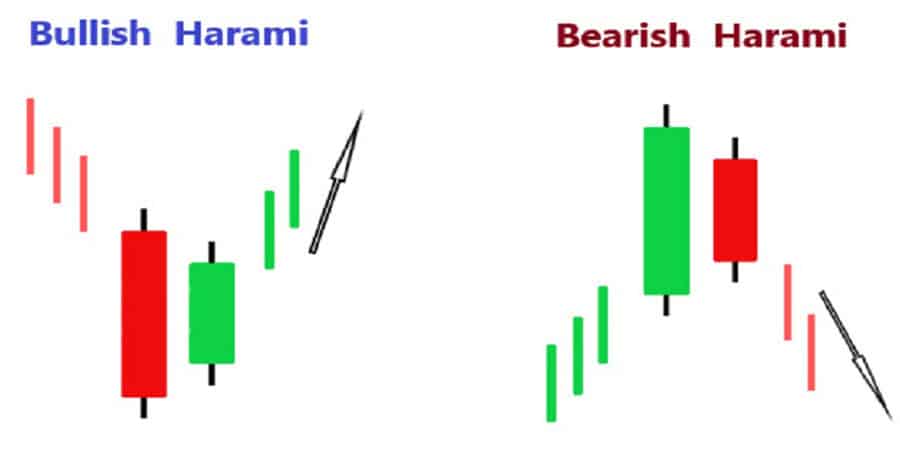
The Harami indicates a sudden contraction in volatility and momentum. It is essentially an “inside bar” formation and usually requires confirmation from the subsequent candle before swing traders incorporate it into their analysis of candlestick patterns for swing trading.
Building a Candlestick Strategy
Simply recognizing the best candlestick patterns for swing trading is insufficient for consistent success. These patterns must be integrated into a comprehensive trading strategy encompassing confirmation methods, diligent risk management, and clearly defined entry/exit protocols. A robust strategy enhances the probability of success and provides a framework for managing the inevitable losing trades inherent in trading.
Read More:price action swing trading strategy
The Necessity of Confirmation
While candlestick patterns offer powerful visual cues, they are not infallible predictors of future price movements. False signals can and do occur. Therefore, relying solely on a pattern’s formation for trade entry carries significant risk. Swing traders should always seek confirmation before committing capital. Confirmation validates potential best candlestick patterns for swing trading and can originate from various sources, including the price action of the subsequent candle (e.g., closing above the high of a bullish pattern or below the low of a bearish one), alignment with technical indicators, or the pattern’s formation at a significant support or resistance level.
Combining with Technical Indicators
Integrating candlestick patterns with other technical indicators substantially enhances their reliability. This multi-faceted approach seeks confluence, where multiple analytical signals align to support a particular trading decision. Common synergistic combinations include:
- Moving Averages (MAs): A bullish pattern forming near a rising MA (e.g., the 50-period MA) suggests the MA is acting as dynamic support, thereby strengthening the buy signal. Conversely, a bearish pattern near a falling MA provides a more robust short signal. MA crossovers can also corroborate trend changes suggested by reversal patterns.
- Relative Strength Index (RSI): An RSI indicator moving out of oversold territory (below 30) concurrently with a bullish reversal pattern adds weight to a potential long entry. An RSI declining from overbought territory (above 70) combined with a bearish pattern reinforces a short signal. Divergence between price action and the RSI can also foreshadow reversals indicated by candlestick formations.
- MACD (Moving Average Convergence Divergence): A bullish MACD crossover (signal line crossing above the MACD line) confirming a bullish candlestick pattern, or a bearish crossover confirming a bearish pattern, increases confidence in the proposed trade.
- Volume: Increased trading volume during the formation of a key reversal pattern (such as Engulfing patterns or the final candle of Star patterns) implies strong conviction behind the indicated move, making the pattern more statistically reliable. Identifying the best candlestick patterns for swing trading often involves looking for volume confirmation.
Using Support and Resistance Levels
As previously emphasized, context is paramount. Candlestick patterns forming at pre-identified horizontal support or resistance levels, pivot points, or Fibonacci retracement levels possess significantly greater predictive power. A Hammer pattern appearing directly on a strong support level represents a high-probability buy setup. A Shooting Star forming precisely at major resistance warrants serious consideration for initiating a short position or exiting an existing long one. These price levels function as natural battlegrounds for buyers and sellers, rendering candlestick signals at these junctures more meaningful.
Setting Entry Points
Precise entry timing is crucial in swing trading. Generally, it is prudent to await confirmation after a candlestick pattern fully forms. Common entry strategies encompass:
- Entering the trade on the open of the candle immediately following the completion and confirmation of the pattern.
- Waiting for the price to definitively break above the high (for bullish patterns) or below the low (for bearish patterns) of the pattern formation itself before entering.
- Employing a limit order to enter on a minor pullback after the initial confirmation move has occurred.
The specific entry method selected often depends on the trader’s individual risk tolerance and the characteristics of the observed pattern and confirmation.
Placing Stop-Loss Orders
A non-negotiable component of any trading strategy, stop-loss orders serve to protect your capital should the trade move adversely. When trading based on candlestick patterns:
- For long entries initiated from bullish patterns, a common stop-loss placement is just below the absolute low of the entire pattern formation (e.g., below the lowest point of a Hammer or a Bullish Engulfing structure).
- For short entries based on bearish patterns, the stop-loss is typically positioned just above the absolute high of the pattern (e.g., above the highest point of a Shooting Star or Bearish Engulfing structure).
Adjustments to stop-loss placement may be warranted based on recent market volatility and proximity to nearby support/resistance levels, always ensuring the defined risk aligns with your overall risk management plan.
Defining Take-Profit Targets
Before initiating any trade, you should establish a clear objective for taking profits. Defining targets helps prevent emotional decision-making during the trade and facilitates systematic profit-taking. Potential methods for setting targets include:
- Risk-Reward Ratio Calculation: Aiming for a profit target that represents a predetermined multiple (e.g., 2:1 or 3:1) of the initial risk (the distance from entry to stop-loss). This is fundamental when evaluating the potential of the best candlestick patterns for swing trading.
- Previous Price Structure: Targeting nearby resistance levels for long trades or support levels for short trades based on historical price action.
- Measured Moves Projection: Projecting the vertical distance of a preceding price swing or pattern to estimate a potential target.
- Fibonacci Extensions: Utilizing Fibonacci extension levels derived from relevant price swings to project potential profit targets.
Having predetermined exit points fosters trading discipline.
Essential Risk Management Rules
Even the most sophisticated trading strategy incorporating the best candlestick patterns for swing trading will ultimately falter without disciplined risk management. Protecting your trading capital is the foremost priority for achieving long-term success. Swing trading inherently involves holding positions overnight or potentially longer, exposing traders to gap risk and necessitating stringent risk control measures.
Read More: Weekly Swing Trading
Position Sizing
This is arguably the most critical element of effective risk management. Position sizing dictates the amount of capital allocated to a single trade, calculated based on your total account equity and the monetary risk defined by your stop-loss distance. Instead of trading an arbitrary number of shares or lots, calculate your position size such that a triggered stop-loss results in a loss of only a small, predefined percentage of your total trading capital (commonly 1-2%). This methodology ensures that a sequence of losing trades does not deplete your account, allowing you to remain operational long enough for profitable trades to materialize.
Risk-Reward Ratio
Prior to entering any trade based on a candlestick pattern, meticulously assess the potential reward relative to the inherent risk. The risk is quantified by the distance between your entry point and your stop-loss order, while the potential reward is estimated by the distance to your predefined take-profit target. Consistently aim for trades where the potential profit significantly outweighs the potential loss.
A commonly accepted minimum target is a 2:1 risk-reward ratio (meaning the potential profit is at least twice the potential loss). Adhering to favorable risk-reward parameters ensures that you do not need a high win rate to be profitable over time; profitability can be achieved even if less than 50% of trades are winners, provided the average win is substantially larger than the average loss.
Avoiding Over-Trading
Candlestick patterns appear frequently on price charts, but not every pattern constitutes a high-probability trading opportunity. A prevalent mistake, particularly among less experienced traders, is the inclination to trade every potential signal observed. This often leads to over-trading, characterized by entering suboptimal setups that may lack alignment with the broader market context or sufficient confirmation from other indicators. Adhere strictly to your established trading plan. Only initiate trades where a valid candlestick pattern aligns with your predefined confirmation criteria (indicators, support/resistance levels) and offers an attractive risk-reward proposition. Patience is paramount; focus on waiting for high-quality setups rather than pursuing mediocre or ambiguous signals.
Limitations & Important Factors
While candlestick patterns are incredibly useful analytical tools, it is vital to approach them with a realistic understanding of their inherent limitations. No technical analysis tool, including candlestick charting, provides guaranteed outcomes. Awareness of potential pitfalls is crucial for sustainable trading success.
No Pattern is 100% Accurate
This fundamental truth cannot be overstated. Even the most reliable and historically validated candlestick patterns will occasionally fail or generate false signals. Market conditions can change rapidly, and unforeseen news events or abrupt shifts in market sentiment can invalidate a pattern shortly after its formation. Accepting that losses are an unavoidable aspect of trading and managing them effectively through disciplined stop-loss usage and appropriate position sizing is essential. Do not become discouraged by failed patterns; instead, focus on the probabilistic edge that these patterns provide over a large series of trades when employed correctly within a sound trading framework. Not every signal will be one of the best candlestick patterns for swing trading in hindsight.
Read More: strongest candlestick patterns
Importance of Backtesting
Before committing real capital to a trading strategy based on candlestick patterns, rigorous backtesting is indispensable. Utilize historical price data to systematically evaluate how specific patterns performed under various past market conditions. Test different combinations of patterns, confirmation indicators, timeframes, and risk management parameters. Backtesting enables you to:
- Quantitatively validate the historical effectiveness (or lack thereof) of your chosen patterns and overall strategy.
- Identify potential weaknesses, limitations, or areas requiring refinement within your approach.
- Build objective confidence in your strategy before risking actual funds.
- Establish realistic performance expectations based on historical data. Backtesting helps determine the truly best candlestick patterns for swing trading in your specific market and timeframe.
Following backtesting, paper trading (simulated trading with virtual funds) is also highly recommended to practice trade execution based on your refined strategy in live market conditions.
Market Context is Key
Always consider the broader market environment when interpreting candlestick signals. A seemingly perfect bullish candlestick pattern appearing amidst a major market panic triggered by negative news is unlikely to succeed. Similarly, a bearish pattern forming within an exceptionally strong, fundamentally driven bull market might only precipitate a minor pullback rather than a significant trend reversal. Pay close attention to:
- Overall Market Trend: Trading patterns in alignment with the dominant long-term trend generally offers a higher probability of success.
- News and Economic Events: Major economic data releases (e.g., interest rate decisions, employment reports) or significant geopolitical events can introduce substantial volatility and potentially override purely technical patterns.
- Sector/Industry Trends: For those swing trading stocks, the prevailing strength or weakness of the relevant sector or industry can significantly influence the success rate of patterns observed in individual stocks within that group.
Maintaining contextual awareness helps filter out lower-probability signals and allows you to focus on candlestick patterns that are more likely to align with underlying market dynamics. This discernment is crucial for finding the best candlestick patterns for swing trading.
Choosing Your Trading Platform
Effectively applying your knowledge of the best candlestick patterns for swing trading necessitates a reliable and feature-rich trading platform. Opofinance, an ASIC-regulated broker, presents a compelling environment for traders seeking advanced analytical tools and secure trade execution.
- Advanced Trading Platforms: Select from industry-standard platforms such as MT4 and MT5, the sophisticated cTrader, or the user-friendly OpoTrade platform, tailoring your choice to your specific analysis and execution preferences.
- Innovative AI Tools: Gain a potential advantage with cutting-edge AI functionalities, including an AI Market Analyzer for identifying opportunities, an AI Coach offering personalized guidance, and AI Support for prompt assistance.
- Social & Prop Trading: Explore avenues in social trading to potentially follow the strategies of experienced traders, or test your skills through proprietary trading programs offered by the broker.
- Secure & Flexible Transactions: Benefit from secure and convenient methods for depositing and withdrawing funds, including options for cryptocurrency transactions, often complemented by zero transaction fees charged by Opofinance.

Consider enhancing your swing trading capabilities by exploring the comprehensive tools and security framework provided by a regulated broker. Learn more about Opofinance today!
Conclusion: Final Thoughts on Candlestick Swings
Candlestick patterns provide swing traders with a powerful visual language for interpreting market psychology and identifying potential inflection points or trend continuations. Developing the skill to recognize and accurately interpret key formations like the Hammer, Engulfing patterns, Stars, and Soldiers offers a tangible edge in timing trade entries and exits.
However, it is crucial to remember that these patterns derive their true analytical strength when assessed within the broader market context – appearing at significant support/resistance levels and corroborated by other technical indicators or volume analysis. Ultimately, achieving consistent profitability using the best candlestick patterns for swing trading stems from synergistically combining pattern recognition with disciplined confirmation techniques, robust risk management practices, and an ongoing commitment to continuous learning and adaptation.
Key Takeaways
- Candlestick patterns offer visual insights into the balance between buyers and sellers, hinting at potential future price direction.
- Swing traders utilize key patterns (Hammer, Engulfing, Stars, Doji) to identify potential entry and exit points over multi-day or multi-week horizons.
- Context is paramount: Patterns gain reliability when formed at significant support/resistance levels, trend lines, or key moving averages.
- Never trade candlestick patterns in isolation; always seek confirmation from subsequent price action, technical indicators (RSI, MACD, MAs), or trading volume. Identifying the best candlestick patterns for swing trading requires this diligence.
- Effective swing trading candlestick strategies demand strict risk management, including calculated position sizing, appropriate stop-loss orders, and favorable risk-reward ratios.
- Thorough backtesting and continuous learning are essential for refining your specific approach to finding the best candlestick patterns for swing trading and adapting to evolving market conditions.
- Acknowledge that no pattern guarantees success; focus on managing risk and leveraging the probabilistic advantages offered by well-confirmed signals.
Can I solely rely on candlestick patterns for swing trading without other indicators?
It is strongly discouraged. While candlestick patterns provide valuable insights, they function optimally as part of a broader analytical toolkit. Relying exclusively on patterns increases the susceptibility to false signals. Obtaining confirmation from supplementary technical indicators (such as RSI, MACD, Moving Averages) or volume analysis significantly enhances the probability of executing a well-founded trade.
Which timeframe is generally best for identifying candlestick patterns for swing trading?
Swing traders typically concentrate their analysis on the Daily (D1) and 4-Hour (H4) charts. The Daily chart offers a comprehensive view of the medium-term trend and highlights significant pattern formations. The H4 chart allows for more granular refinement of entry and exit signals within that larger market structure. While the 1-Hour (H1) chart might be used for further precision by some, patterns identified on higher timeframes (H4, D1) are generally considered more statistically reliable for swing trading objectives.
How does trading volume enhance the reliability of candlestick signals?
Trading volume serves as a critical confirmation tool for candlestick patterns, particularly for reversal formations. High volume accompanying the formation of a key pattern (e.g., a Bullish Engulfing occurring on significantly increased volume after a downtrend, or an Evening Star completing on high volume after an uptrend) suggests strong market participation and conviction behind the price movement indicated by the pattern. Conversely, a pattern forming on unusually low volume might carry less significance and could be more prone to failure. Elevated volume adds weight and credibility to the candlestick signal.


