

Ever feel like you’re chasing shadows on your 1-hour charts? Like the market’s whispering secrets you can’t quite decipher? You’re not alone. Many traders find themselves in this frustrating boat, especially when trying to nail down the right technical indicators. It’s like trying to find a needle in a haystack, isn’t it? But what if there was a way to sharpen your vision, to cut through the noise and see the underlying trends with crystal clarity? That’s where mastering the Exponential Moving Average (EMA) comes in.
Finding the best EMA settings for the 1-hour chart is a game-changer for any trader aiming to gain a real advantage in the dynamic world of forex trading with a reliable forex broker. This article will provide you with the knowledge to select and effectively use optimal EMA settings, empowering you to identify trends, pinpoint potential entry and exit points, and ultimately, supercharge your trading strategy on the 1-hour timeframe. Think of it as getting the cheat codes for your 1-hour charts.
The 1-hour chart holds a sweet spot for day traders and scalpers. It offers more opportunities than longer timeframes while providing a clearer picture of intraday movements than the often-chaotic shorter timeframes. But to truly unlock its potential, understanding and applying the correct EMA settings is absolutely essential. Consider this your comprehensive guide to navigating the world of EMAs on the 1-hour chart, packed with actionable strategies and insights to elevate your trading prowess.
Introduction to EMA and 1-Hour Charts
The Exponential Moving Average (EMA) is a cornerstone of technical analysis, a powerful indicator that calculates the average price of an asset over a specific period, placing greater emphasis on recent prices. This heightened sensitivity to newer data makes it exceptionally valuable for short-term trading on the 1-hour chart, where reacting swiftly to price fluctuations is paramount. It’s like having a weather vane that reacts instantly to the slightest shift in the wind.

What is EMA?
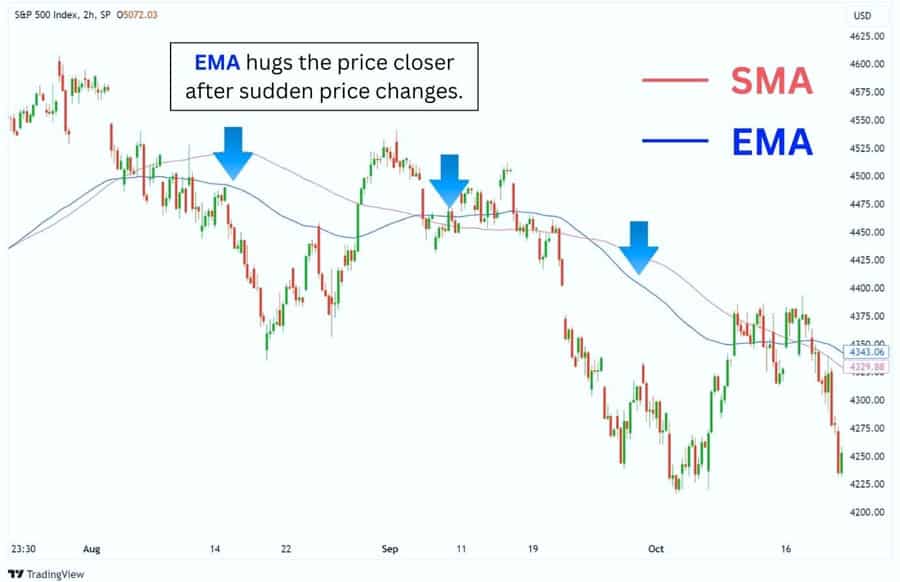
Unlike the Simple Moving Average (SMA), which treats all prices within the chosen period equally, the EMA reacts more rapidly to recent price changes. This responsiveness allows traders to identify potential trend shifts and capitalize on emerging opportunities sooner. For day traders and scalpers operating on the 1-hour timeframe, this responsiveness is a significant advantage. Imagine trying to catch a wave – the EMA helps you spot it forming earlier than the SMA.
Why 1-Hour Charts Matter
Why are 1-hour charts so popular among active traders? They strike an ideal balance. They present more trading opportunities than longer-term charts while offering a less noisy view of intraday trends compared to shorter timeframes like the 5-minute or 15-minute charts, which can be overwhelmed with insignificant price swings. It’s the Goldilocks timeframe – not too fast, not too slow, just right for capturing intraday momentum.
Read More: Best macd settings for 1 hour chart
Key Characteristics of EMA for 1-Hour Charts
To effectively utilize EMA on the 1-hour chart, understanding its specific characteristics is crucial. It’s not just about plugging in numbers; it’s about understanding how the tool behaves in this specific context.
Sensitivity to Price Changes
This is the EMA’s defining characteristic. It reacts swiftly to new price data, making it adept at capturing short-term momentum. This is a significant advantage on the 1-hour chart where timely decisions are often the difference between profit and loss. Think of it as having a highly sensitive radar that picks up even the faintest blips.
Reducing Market Noise
While more responsive than the SMA, the EMA still smooths out price fluctuations, helping to filter out insignificant market noise and provide clearer signals about the underlying trend. This clarity is invaluable when analyzing the often-choppy price action on the 1-hour chart. It’s like putting on noise-canceling headphones in a crowded room – you can finally hear the important signals.
Best EMA Settings for 1-Hour Charts
Now, let’s delve into the core question: identifying the best EMA for 1-hour chart analysis. It’s important to understand that there’s no single “holy grail” setting. The optimal settings can vary depending on your individual trading style, the specific asset you’re trading, and the prevailing market conditions. However, certain EMA periods are widely recognized and frequently used by successful traders on the 1-hour timeframe as reliable starting points.
The Fast Trio: 5, 8, and 13 EMA
Inspired by the Fibonacci sequence, these shorter-period EMAs are exceptionally sensitive to recent price movements. The 5 EMA, being the shortest, will hug the price action most closely, reacting almost instantaneously to changes. It’s particularly useful for scalpers aiming to capture very short-term fluctuations and identify immediate momentum shifts.
Think of it as the most agile member of the trio, quick to respond to even the slightest nudge in price. The 8 EMA offers a slightly smoother perspective while still remaining highly responsive. It can help filter out some of the extreme noise that the 5 EMA might pick up, providing a slightly more stable signal for short-term trend identification. Finally, the 13 EMA provides a bit more confirmation, acting as a bridge between the very short-term and the intermediate-term.
Crossovers between these EMAs, especially when the 5 EMA crosses the 8 and then the 13, can signal strong bursts of momentum and potential entry points for quick trades. These settings are favored by those who thrive on rapid decision-making and capturing small but frequent profits.
Trend Following with 20 and 50 EMA
These mid-range EMAs are popular for identifying the prevailing short-term trend on the 1-hour chart with greater reliability. The 20 EMA is often considered a key dynamic support and resistance level in trending markets on this timeframe. When the price consistently respects the 20 EMA during pullbacks in an uptrend, it reinforces the bullish bias. Conversely, in a downtrend, the 20 EMA can act as resistance.
Crossovers of the price above or below the 20 EMA can also signal potential shifts in the immediate trend. Think of it as a reliable barometer for the current short-term direction. The 50 EMA provides a slightly longer-term perspective within the 1-hour chart context. It’s often used to confirm the trend identified by the 20 EMA. For instance, if the price is above both the 20 and 50 EMA, it provides stronger evidence of an uptrend.
Crossovers between the 20 and 50 EMA are closely watched by many traders as potential signals of a more significant trend change. If the 20 EMA crosses below the 50 EMA after a period of being above it, it could indicate a weakening of the uptrend and a potential shift towards a downtrend. These settings are favored by day traders looking to ride intraday trends for more substantial gains.
Long-Term Perspective: 100 and 200 EMA
These longer-period EMAs offer a broader, more strategic view of the market on the 1-hour chart. While less sensitive to the immediate price wiggles, they are invaluable for understanding the overall context and identifying significant support and resistance zones. The 100 EMA can act as a medium-term trend filter on the 1-hour chart. If the price is consistently trading above the 100 EMA, it suggests a generally bullish environment over the past few trading sessions. Conversely, trading below it suggests a bearish leaning. It helps to avoid taking counter-trend trades against the prevailing medium-term momentum.
The 200 EMA is a widely followed indicator across various timeframes, including the 1-hour chart. It’s often considered a key dividing line between bullish and bearish market sentiment. Many traders use the 200 EMA to determine the overall trend bias. If the price is above the 200 EMA, they primarily look for buying opportunities, and if it’s below, they focus on selling opportunities. Crossovers of the price above or below the 200 EMA are significant events that can signal major shifts in market direction. These settings are particularly useful for swing traders who use the 1-hour chart for entry and exit timing while considering the broader trend on higher timeframes.
Fibonacci-Tuned Settings (5-8-13)
The effectiveness of these settings stems from the inherent mathematical properties of the Fibonacci sequence, which some believe influences market behavior and investor psychology. The specific ratios within the Fibonacci sequence are thought to appear in natural phenomena and, according to some theories, in market movements as well. The close proximity of the 5, 8, and 13 EMAs allows for the quick identification of short-term momentum shifts and potential areas of confluence where these EMAs converge, potentially acting as stronger support or resistance levels.
Traders using these settings often look for instances where all three EMAs are aligned in the direction of the trend for higher probability trading opportunities. It’s like using a finely tuned instrument to detect subtle changes in market sentiment, based on a mathematical principle believed to be inherent in market dynamics.
Combining Short and Long EMAs
A powerful and widely used strategy involves using a combination of short and long-period EMAs to gain a more comprehensive understanding of the market and generate higher-confidence trading signals. For example, observing the 5 EMA crossing above the 20 EMA can signal a potential buying opportunity, indicating a shift in short-term momentum. However, if this crossover occurs while the price is also above the 50 or 100 EMA, it provides stronger confirmation of an overall uptrend, increasing the probability of a successful trade.
Conversely, a short-term bearish crossover (e.g., 5 EMA crossing below the 20 EMA) might be a stronger sell signal if the price is already trading below the longer-term EMAs. This multi-layered approach helps to filter out false signals and provides a more robust framework for making trading decisions. It’s like having multiple confirmations before making a move, increasing your confidence in the trade and reducing the likelihood of being caught in a false breakout.
Read More: forex gap trading strategy
How to Use EMA on 1-Hour Charts
Understanding the different EMA settings is only the first step. Knowing how to effectively utilize them on your 1-hour charts is where the real power lies. It’s about translating the lines on your chart into actionable trading decisions.
Identifying Trends
The most fundamental use of EMAs is to identify the direction of the trend. It’s like using a compass to navigate the market.
- Uptrend: When the price is consistently above a specific EMA (e.g., the 20 or 50 EMA), it suggests an uptrend. The longer the price stays above the EMA, the stronger the trend.
- Downtrend: Conversely, when the price consistently remains below an EMA, it indicates a downtrend.
- Sideways Markets: In ranging or sideways markets, the price will often oscillate around the EMA, with frequent crossovers. This can be a signal to avoid trend-following strategies and potentially consider range-bound trading techniques.
EMA Crossovers for Signals
EMA crossovers are a popular method for generating trading signals. They act as potential triggers for entering or exiting a trade.
- Bullish Crossover: When a shorter-period EMA (e.g., the 5 EMA) crosses above a longer-period EMA (e.g., the 20 EMA), it can be a bullish signal, suggesting a potential buying opportunity.
- Bearish Crossover: When a shorter-period EMA crosses below a longer-period EMA, it can be a bearish signal, indicating a potential selling opportunity.
Important Note: It’s crucial to consider the context of the crossover. Crossovers are more reliable when they align with the overall trend. Don’t blindly follow every crossover; consider the bigger picture.
Combining EMA with Other Indicators
To increase the accuracy of your trading signals, it’s wise to combine EMA with other technical indicators. This confluence of signals can provide stronger confirmation.
- Relative Strength Index (RSI): Using RSI alongside EMA can help confirm overbought or oversold conditions. For example, a bullish EMA crossover combined with an oversold RSI reading can provide a stronger buy signal. It’s like having a second opinion to validate your initial assessment.
- Moving Average Convergence Divergence (MACD): MACD can help identify potential trend reversals and confirm the momentum indicated by EMA crossovers.
- Price Action: Always pay attention to price action patterns like candlestick formations. A bullish engulfing pattern occurring near an EMA support level can be a powerful confluence signal. Price action is the ultimate truth teller; use EMA to enhance its signals.
Common Mistakes Using EMA on 1-Hour Charts
While EMAs are powerful tools, they are not foolproof. Avoiding common pitfalls is crucial for successful implementation. Learning from the mistakes of others can save you a lot of heartache (and capital).
Over-Reliance on EMA
Never rely solely on EMA signals. Always analyze price action, candlestick patterns, and support/resistance levels to confirm potential trading opportunities. EMA should be used as a tool to enhance your analysis, not replace it. Think of EMA as a helpful guide, not the sole navigator.
Ignoring Market Volatility
In highly volatile markets, EMAs can generate false signals. Be aware of market conditions and consider using volatility indicators like Average True Range (ATR) to gauge the current volatility. Avoid taking trades solely based on EMA crossovers during periods of high volatility. Volatility can whip prices around, leading to misleading EMA signals.
Read More: Moving Average Indicator in Forex
Advanced Strategies for EMA on 1-Hour Charts
For experienced traders looking to refine their strategies, here are some advanced techniques for utilizing EMAs on the 1-hour chart. These strategies require a deeper understanding of market dynamics and risk management.
Layered Analysis with Multiple EMAs
Using a combination of three or more EMAs (e.g., 5-8-13, or 50-100-200) can provide a more nuanced view of the market. The alignment and crossovers between these multiple EMAs can offer stronger confirmation of trends and potential trading opportunities. For instance, having the 5 EMA above the 8 EMA, which is above the 13 EMA, all above the 50 EMA, strongly suggests a bullish trend. It’s like having multiple lenses to view the market from different perspectives, providing a more complete picture.
EMA as Dynamic Support and Resistance
In trending markets, EMAs can act as dynamic support and resistance levels. During an uptrend, the price may pull back to the EMA (e.g., the 20 or 50 EMA) before continuing its upward trajectory. Conversely, in a downtrend, the price may rally towards the EMA before resuming its decline. Look for price action confirmations (like bullish or bearish candlestick patterns) near these EMA levels for potential entry points. These dynamic levels can offer high-probability trading opportunities.
Case Studies: EMA in Action on 1-Hour Charts
Let’s examine some hypothetical scenarios to illustrate how EMA strategies can be applied in real-world trading situations. These examples highlight the practical application of the concepts we’ve discussed.
Example 1: 5-8-13 EMA on EUR/USD
Imagine you’re observing the EUR/USD pair on the 1-hour chart. The 5 EMA crosses above the 8 EMA, which then crosses above the 13 EMA. This bullish sequence, confirmed by a bullish engulfing candlestick pattern forming right as the 5 EMA crosses the 8 EMA, could signal a potential long entry. A trader might place a stop-loss order just below the 13 EMA to manage risk. This scenario demonstrates how the fast trio can pinpoint short-term buying opportunities.
Example 2: 50 and 200 EMA for Trend Confirmation on GBP/JPY
Consider the GBP/JPY pair on the 1-hour chart. The 50 EMA is consistently trading above the 200 EMA, indicating a strong bullish trend. A trader might then look for buying opportunities when the price pulls back towards the 50 EMA, treating it as a dynamic support level. If a pin bar candlestick forms right at the 50 EMA, it further strengthens the buy signal. This illustrates how longer-term EMAs can help confirm the overall trend and identify potential entry points during pullbacks.
Pro Tips for Advanced Traders
Seasoned traders can further refine their EMA strategies with these advanced insights.
- Experiment with Different Combinations: Don’t be afraid to experiment with different EMA periods and combinations to find what works best for your trading style and the specific assets you trade. Rigorous backtesting is crucial to validate your findings.
- Consider Market Regime: The optimal EMA settings might vary depending on the prevailing market regime (e.g., trending vs. ranging). Adapt your settings accordingly to maximize effectiveness.
- Higher Timeframe Context: Always analyze the trend on higher timeframes (e.g., the 4-hour or daily chart) to gain a broader perspective before making trading decisions on the 1-hour chart. This top-down approach can significantly improve your trading decisions.
Opofinance Services
Looking for a reliable and regulated broker to put your EMA strategies into action? Consider Opofinance, an ASIC-regulated broker officially featured on the MT5 brokers list. Opofinance provides a range of services designed to support traders:
- ASIC Regulation: Trade with confidence knowing Opofinance adheres to the strict regulatory standards of the Australian Securities and Investments Commission (ASIC).
- Social Trading: Tap into the collective wisdom of the trading community with Opofinance’s social trading platform. Observe, learn from, and potentially copy the trades of experienced traders.
- MT5 Platform: Access advanced charting tools and a comprehensive suite of indicators, including EMA, on the widely acclaimed MetaTrader 5 platform.
- Safe and Convenient Deposits and Withdrawals: Enjoy seamless and secure transactions with a variety of deposit and withdrawal methods.

Ready to take your trading to the next level? Explore the opportunities with Opofinance. Learn more at opofinance.com.
Conclusion
Mastering the best EMA settings for the 1-hour chart is an ongoing process of learning and refinement. Understanding the nuances of different EMA periods, how to interpret crossovers, and how to integrate EMAs with other analytical tools is essential for success. Remember that consistent practice, thorough backtesting, and a disciplined approach are key to unlocking the full potential of this powerful indicator. By applying the strategies and insights discussed in this guide, you can significantly enhance your ability to navigate the dynamic landscape of the 1-hour chart and achieve your trading objectives.
Key Takeaways
- The Exponential Moving Average (EMA) is a valuable tool for identifying trends and potential trading opportunities on the 1-hour chart.
- Shorter-period EMAs (5, 8, 13) are sensitive to short-term price changes, while longer-period EMAs (20, 50, 100, 200) offer a broader trend perspective.
- EMA crossovers can signal potential entry and exit points but should be used in conjunction with other forms of analysis.
- Combining EMA with other indicators like RSI and MACD can improve the accuracy of trading signals.
- Avoiding over-reliance on EMA and considering market volatility are crucial for successful implementation.
Can I use the same EMA settings for all currency pairs on the 1-hour chart?
While the recommended EMA settings discussed in this article serve as a solid foundation, the optimal settings can vary slightly depending on the specific characteristics of the currency pair you are trading. Certain pairs might exhibit higher volatility or stronger trending behavior than others. Experimentation and backtesting are crucial to fine-tuning the settings for each individual pair.
How do I determine if an EMA crossover is a reliable signal or a false signal?
To enhance the reliability of EMA crossover signals, consider several factors. First, ensure the crossover aligns with the prevailing trend on higher timeframes, providing a broader context. Second, seek confirmation from other indicators, such as RSI or MACD, to validate the signal. Finally, analyze the price action surrounding the crossover point; strong volume during the crossover can add to its significance and reliability.
Is it better to use EMA or SMA on the 1-hour chart?
For the 1-hour chart, where capturing short-term momentum is often the primary objective, the EMA is generally favored over the SMA due to its increased sensitivity to recent price fluctuations. However, some traders may find the SMA useful for identifying longer-term trends or for implementing specific trading strategies. Ultimately, the choice between EMA and SMA depends on your individual trading style, preferences, and the specific goals of your analysis.


