Chasing quick profits in the fast-paced world of 1-minute chart trading? You’re likely wondering: What are the best EMA settings for a 1-minute chart? The sweet spot often lies with shorter EMAs like the 7 and 14 period. These settings offer the responsiveness needed to capture fleeting opportunities in the rapid movements of the 1-minute timeframe. This article dives deep into leveraging Exponential Moving Averages (EMAs) to navigate the intricacies of 1-minute chart trading, providing you with actionable strategies and insights to sharpen your edge. Whether you’re a seasoned scalper or just starting, understanding how to optimize your best EMA settings for 1 minute chart is crucial for success, and we’ll explore exactly how to do that, even touching upon how a reliable forex broker can enhance your trading journey.
EMA Importance for 1-Minute Charts
Understanding the role of Exponential Moving Averages (EMAs) is fundamental for effective 1-minute chart analysis. Let’s delve into why EMAs are so crucial in this fast-paced trading environment.
What is an EMA?
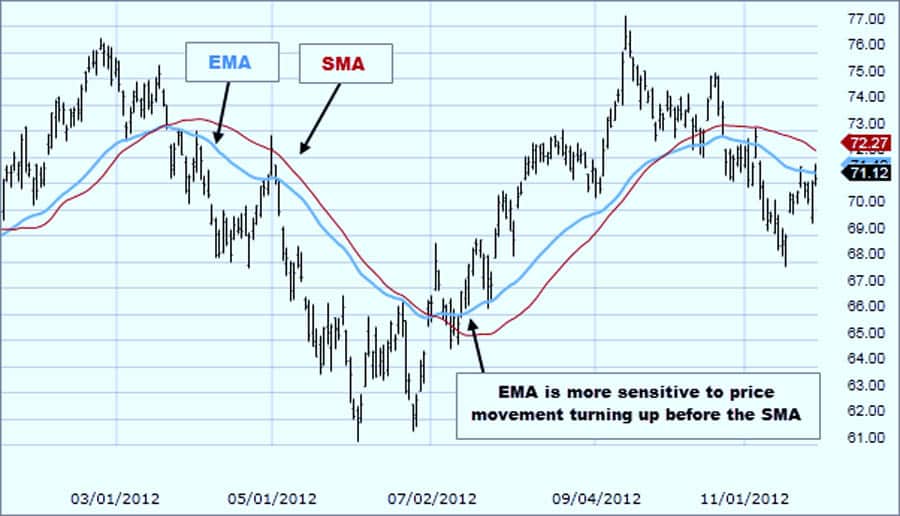
Imagine a line that smoothly tracks the average price of an asset over a specific period, giving more weight to recent prices. That’s essentially what an Exponential Moving Average (EMA) does. Unlike its simpler counterpart, the Simple Moving Average (SMA), the EMA reacts more swiftly to new price data.
EMA vs. SMA on 1-Minute Charts
Choosing the right moving average is critical for 1-minute chart analysis. Here’s why the EMA often outperforms the SMA in this context.
Why EMA is preferred for 1-minute charts over SMA
In the blink-and-you’ll-miss-it environment of 1-minute trading, lag is the enemy. The SMA, by giving equal weight to all prices within its period, can be slow to reflect immediate price changes. Think of it like this: if a sudden price spike occurs, the EMA will adjust its trajectory quicker, providing an earlier signal than the SMA. This heightened sensitivity makes the EMA a more valuable tool for identifying short-term trends and potential entry/exit points in the fast-paced arena of 1-minute charts.
EMA for Trend and Momentum
Identifying trends and momentum quickly is vital on a 1-minute chart. The EMA excels at this, providing traders with valuable insights.
The role of EMA in identifying trends and momentum in fast-paced markets
In the whirlwind of 1-minute price action, discerning genuine trends from mere noise can be challenging. The EMA acts as a filter, smoothing out short-term volatility and offering a clearer picture of the prevailing direction. When the price consistently stays above the EMA, it suggests an upward trend, indicating bullish momentum. Conversely, when the price remains below the EMA, it signals a downtrend and bearish momentum. This ability to quickly identify shifts in momentum is invaluable for scalpers aiming to capitalize on small price movements.
Read More: 1 minute forex trading strategy
Moving Averages for 1-Minute Charts
While EMA is favored, understanding the differences between moving average types is important for informed trading decisions on the 1-minute chart.
Simple Moving Average (SMA) vs. Exponential Moving Average (EMA)
While both SMA and EMA calculate average prices, their methodologies differ significantly. The SMA calculates the arithmetic mean of prices over a specified period. The EMA, on the other hand, applies more weight to recent prices, making it more reactive to current market conditions. Consider a 20-period moving average. The SMA treats all 20 periods equally, while the EMA gives more importance to the most recent price data within those 20 periods.
EMA Responsiveness in Short Timeframes
The responsiveness of the EMA is a key advantage, particularly when trading on the 1-minute chart. This responsiveness can significantly impact trading outcomes.
Why EMA is more responsive to price changes in short timeframes
For the agile trader navigating the 1-minute chart, responsiveness is key. Imagine trying to catch a rapidly bouncing ball. The EMA is like having a glove that adjusts instantly to the ball’s trajectory, while the SMA is like having a less flexible mitt. This responsiveness translates to earlier and potentially more profitable signals in the fast-paced environment of 1-minute trading. When prices move quickly, the EMA adapts, providing a more accurate representation of the immediate trend.
Best EMA Settings for 1 Minute Scalping
Choosing the best EMA settings for 1 minute scalping is crucial for capturing quick profits. Let’s explore some popular and effective settings.
Popular EMA Settings: 7 EMA, 14 EMA, 20 EMA, 50 EMA, and 200 EMA
While numerous EMA settings exist, certain periods have gained popularity among 1-minute chart traders. The 7 EMA and 14 EMA are frequently cited as optimal for capturing short-term momentum. The 20 EMA can offer a slightly smoother perspective, while the 50 EMA and 200 EMA are generally used for identifying longer-term trends and are less common for direct trading signals on a 1-minute chart. However, they can be valuable for understanding the broader market context.
Shorter EMAs for 1-Minute Charts
For the 1 minute chart EMA strategy, shorter EMAs often prove to be the most effective. Their sensitivity aligns well with the rapid price fluctuations.
Why shorter EMAs (7, 14) are ideal for 1-minute charts
The allure of shorter EMAs like the 7 and 14 lies in their sensitivity. On a 1-minute chart, price action is rapid and fleeting. A longer EMA, while useful on higher timeframes, might lag too much to provide timely signals for scalping. Think of it as trying to steer a speedboat versus a cruise ship. The shorter EMA allows you to make quick adjustments to your trading strategy, capitalizing on those brief windows of opportunity that define 1-minute trading. These settings help you react swiftly to the immediate pulse of the market.
Combining EMAs for Trend Confirmation
Enhance your 1 minute chart EMA strategy by combining multiple EMAs. This can lead to more reliable trend confirmations.
Combining multiple EMAs (e.g., 14 EMA and 21 EMA) for better trend confirmation
To enhance the reliability of EMA signals, many traders employ a strategy of combining multiple EMAs. A popular combination is the 14 EMA and 21 EMA. The idea is that when the faster EMA (14) crosses above the slower EMA (21), it can signal the beginning of an upward trend, potentially offering a buy signal. Conversely, when the 14 EMA crosses below the 21 EMA, it may indicate a downward trend and a potential sell signal. This confluence of signals can provide stronger confirmation than relying on a single EMA alone, helping to filter out some of the noise inherent in 1-minute charts.
Read More: EMA Scalping Strategies
How to Use EMA on 1-Minute Charts
Effectively utilizing EMA on 1-minute charts requires understanding its various applications. Let’s explore how to leverage EMA for trend identification and signal generation.
Using EMA as a Trend Indicator
One of the primary uses of the EMA on a 1-minute chart is to identify the prevailing trend. If the price is consistently trading above the EMA, it suggests an uptrend. Traders might look for buying opportunities in this scenario. Conversely, if the price is consistently below the EMA, it indicates a downtrend, and traders might consider selling or shorting opportunities. The EMA acts as a dynamic guide, helping you align your trades with the current market direction.
EMA Crossovers for Signals
EMA crossovers are a popular technique for generating buy and sell signals on the 1-minute chart. Understanding these crossovers is key to implementing an effective 1 minute chart EMA strategy.
EMA crossovers for buy/sell signals (e.g., 14 EMA crossing 21 EMA)
As mentioned earlier, EMA crossovers are a popular method for generating trading signals. The 14 EMA crossing above the 21 EMA is a common signal for a potential buy entry. The logic is that the faster-moving average reflecting more recent price action is now trending higher than the slightly slower average, suggesting upward momentum. Conversely, the 14 EMA crossing below the 21 EMA can be interpreted as a sell signal, indicating a potential shift towards downward momentum. Remember, it’s crucial to consider other factors and not rely solely on crossovers.
EMA as Support and Resistance
Beyond trend indication, the EMA can also function as dynamic support and resistance levels on the 1-minute chart, offering potential entry and exit points.
EMA as dynamic support and resistance levels
Interestingly, the EMA can also act as dynamic support and resistance levels. During an uptrend, the EMA can often serve as a support level, with price bouncing off it before continuing its upward trajectory. Conversely, in a downtrend, the EMA can act as resistance, with price struggling to break above it. These dynamic levels can provide potential entry points for trades, especially when combined with other confirmation signals. Watch how price interacts with the EMA – does it respect the level, or does it break through decisively?
EMA Crossover Strategies for Scalping
For those focused on scalping, specific EMA crossover strategies can be highly effective on the 1-minute chart. Let’s explore some popular approaches.
Golden and Death Cross for Context
While less frequent on the 1-minute chart, understanding the Golden and Death Cross can provide valuable context for your scalping activities.
Golden Cross (50 EMA crossing 200 EMA) and Death Cross (50 EMA crossing below 200 EMA)
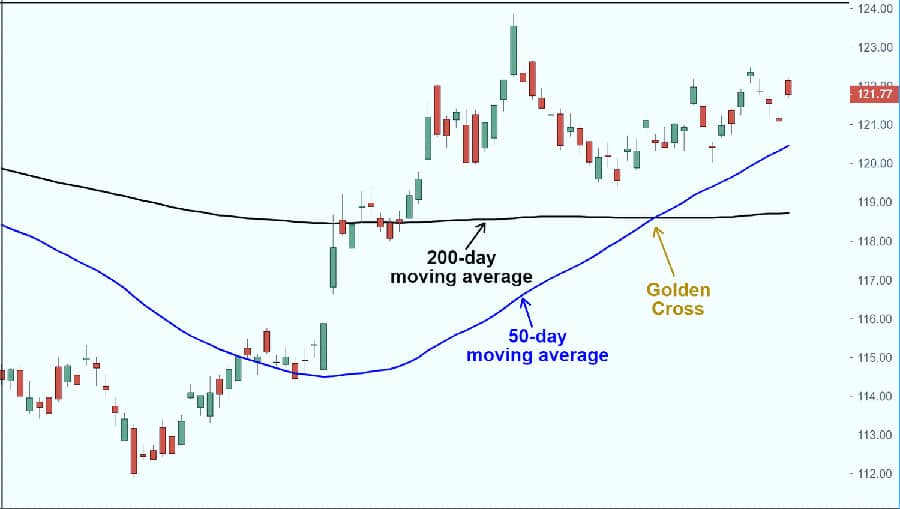
While less common for direct 1-minute chart entries, the Golden Cross (50 EMA crossing above the 200 EMA) and the Death Cross (50 EMA crossing below the 200 EMA) are significant longer-term trend indicators that can provide valuable context for your 1-minute scalping. A Golden Cross on a higher timeframe might suggest a broader bullish market sentiment, potentially favoring long positions even on the 1-minute chart. Conversely, a Death Cross could indicate a longer-term bearish trend, perhaps making short positions more favorable. Understanding these broader trends can add a layer of confluence to your 1-minute trading decisions.
Triple EMA Strategy
For enhanced trend confirmation in your scalping efforts, consider employing a Triple EMA strategy on your 1-minute charts.
Triple EMA strategy (50, 100, 150 EMA) for trend confirmation
For traders seeking stronger trend confirmation, a Triple EMA strategy using the 50, 100, and 150 EMAs can be employed. The idea is that when all three EMAs are aligned in a specific order (e.g., 50 above 100 above 150), it provides a more robust indication of the prevailing trend. For example, if the price is above all three EMAs, and the EMAs are stacked in ascending order, it suggests a strong uptrend. While this strategy might not generate as many signals on a 1-minute chart as shorter EMA crossovers, the signals it does produce can be of higher quality, offering greater confidence in the trend’s direction.
Read More: best macd settings for 1 minute chart
Risk Management in 1-Minute EMA Trading
Effective risk management is paramount when utilizing EMA for trading on the 1-minute chart. Protecting your capital is key to long-term success.
Setting Stop-Loss and Take-Profit
Implementing stop-loss and take-profit orders is a fundamental aspect of risk management in the fast-paced environment of 1-minute trading.
Setting stop-loss and take-profit levels
In the volatile realm of 1-minute trading, robust risk management is non-negotiable. Always set stop-loss orders to limit potential losses if a trade moves against you. Determine your risk tolerance and place your stop-loss at a level where you’d be comfortable exiting the trade. Similarly, set take-profit orders to automatically close your position when your profit target is reached. Having these levels in place helps to protect your capital and ensures you don’t let winning trades turn into losers due to indecision.
Risk-Reward Ratio for Scalping
Maintaining a favorable risk-reward ratio is crucial for profitability when scalping using EMA on the 1-minute chart. This discipline can significantly impact your trading outcomes.
Importance of risk-reward ratio in scalping
Scalping on the 1-minute chart involves capturing small profits on numerous trades. Therefore, maintaining a favorable risk-reward ratio is crucial for long-term profitability. Aim for trades where the potential reward outweighs the risk. For example, a 1:2 risk-reward ratio means you’re risking one unit to potentially gain two units. Consistently adhering to a sound risk-reward strategy can help offset inevitable losing trades and ensure your trading account grows over time.
Combining EMA with Other Indicators
To enhance the accuracy of your best EMA settings for 1 minute chart, consider combining EMA with other technical indicators. This multi-faceted approach can lead to more robust trading signals.
Enhancing Accuracy with Indicators
Using complementary indicators alongside EMA can significantly improve the accuracy of your trading signals on the 1-minute chart.
Using EMA with RSI, Stochastic Oscillator, and Bollinger Bands for better accuracy
While EMA is a powerful tool, combining it with other technical indicators can significantly enhance the accuracy of your trading signals. The Relative Strength Index (RSI) can help identify overbought and oversold conditions, providing confluence with EMA signals. The Stochastic Oscillator can also highlight potential reversals. Bollinger Bands can help gauge volatility and identify potential breakout opportunities in conjunction with EMA crossovers. Using these indicators in tandem can provide a more holistic view of the market and improve the reliability of your trading decisions.
Volume Confirmation for EMA Signals
Confirming EMA signals with volume analysis can add another layer of confidence to your 1-minute chart trading decisions.
Volume confirmation for EMA signals
Volume is a crucial, often overlooked, indicator that can add significant weight to EMA signals. When an EMA crossover occurs, look for confirmation from volume. For example, if the 14 EMA crosses above the 21 EMA, ideally, you’d like to see an increase in trading volume accompanying this move. Higher volume suggests stronger conviction behind the price movement, making the signal more reliable. Conversely, a crossover with low volume might be a false signal or a sign of weak momentum.
Avoiding Mistakes with EMA on 1-Minute Charts
When using EMA on 1-minute charts, it’s crucial to be aware of common pitfalls. Avoiding these mistakes can significantly improve your trading performance.
Avoiding Overtrading
The frequency of signals on a 1-minute chart can tempt traders to overtrade. Recognizing and avoiding this tendency is crucial for preserving capital.
Overtrading due to frequent signals
The very nature of the 1-minute chart and the responsiveness of shorter EMAs can lead to overtrading. You might see numerous crossover signals throughout the day, tempting you to enter and exit trades frequently. However, not all signals are created equal, and excessive trading can lead to increased transaction costs and emotional fatigue. Be selective with your trades and focus on higher-probability setups that align with your overall strategy and risk management rules.
Ignoring Market Noise
Failing to filter out market noise can lead to misinterpreting EMA signals on the 1-minute chart. Discernment is key in this fast-paced environment.
Ignoring market noise and false crossovers
The 1-minute chart is inherently noisy, with rapid and often erratic price fluctuations. This noise can lead to false EMA crossovers, where the EMAs cross briefly but the price action doesn’t follow through. Relying solely on EMA crossovers without considering other factors like volume, support and resistance levels, or broader market context can lead to whipsaws and losses. Always seek confirmation and be aware of the potential for false signals in such a fast-paced environment.
Backtesting and Optimizing EMA Settings
Before deploying any EMA strategy, rigorous backtesting and optimization are essential. This process helps refine your approach and build confidence.
Importance of Backtesting EMA Strategies
Thoroughly backtesting your chosen EMA strategies is a critical step before risking real capital. This process allows you to evaluate its historical performance.
Backtesting and Optimizing EMA Settings
Before deploying any EMA strategy on a live 1-minute chart, it’s absolutely essential to backtest it thoroughly. Backtesting involves applying your chosen EMA settings and trading rules to historical price data to see how they would have performed in the past. This process allows you to evaluate the profitability and effectiveness of your strategy without risking real capital. It helps you identify potential weaknesses and refine your approach before putting it to the test in live market conditions.
Tools for Backtesting
Utilizing the right tools can significantly streamline the backtesting process for your EMA strategies on the 1-minute chart.
Tools for backtesting (e.g., TradingView, TrendSpider)
Several powerful tools are available for backtesting EMA strategies. TradingView offers robust charting capabilities and a Pine Script editor that allows you to code and backtest custom strategies. TrendSpider is another popular platform with advanced backtesting features, including the ability to test various EMA combinations and parameters. Utilizing these tools can significantly streamline the backtesting process and provide valuable insights into the historical performance of your chosen EMA settings.
Opofinance Services: Your Partner in Trading Excellence
Looking for a reliable and regulated broker for forex trading to execute your 1-minute chart strategies? Consider Opofinance, an ASIC-regulated broker committed to providing a secure and efficient trading environment. Here’s what makes Opofinance stand out:

- ASIC Regulation: Trade with confidence knowing Opofinance adheres to the stringent regulatory standards of the Australian Securities and Investments Commission (ASIC).
- Officially Featured on MT5 Brokers List: Access the powerful MetaTrader 5 platform, a favorite among professional traders, officially recognizing Opofinance’s commitment to quality.
- Safe and Convenient Deposits and Withdrawals: Enjoy a hassle-free experience with a variety of secure and convenient deposit and withdrawal methods.
- Explore Social Trading: Connect and learn from experienced traders through Opofinance’s social trading features, potentially gaining valuable insights into different trading styles and strategies.
Ready to elevate your trading experience? Discover the advantages of trading with Opofinance today!
Conclusion
Mastering the best EMA settings for 1 minute chart is a journey of understanding responsiveness, confirmation, and disciplined risk management. While shorter EMAs like the 7 and 14 often reign supreme for capturing fleeting opportunities, the optimal settings can vary based on your individual trading style and the specific market conditions. Combining EMAs, seeking volume confirmation, and integrating other indicators can significantly enhance the reliability of your signals. Remember, backtesting is your crucial ally in refining your strategy. Embrace the dynamic nature of 1-minute trading, stay adaptable, and continuously seek to optimize your approach. The potential for quick gains is there, but it demands precision, patience, and a well-defined strategy built upon a solid understanding of EMA dynamics.
Key Takeaways
- Shorter EMAs (7 and 14) are generally preferred for the responsiveness needed in 1-minute chart trading.
- Combining multiple EMAs (e.g., 14 and 21) can provide stronger trend confirmation.
- Use EMA crossovers as potential buy/sell signals, but always seek additional confirmation.
- EMA can act as dynamic support and resistance levels.
- Robust risk management, including stop-loss and take-profit orders, is crucial for scalping.
- Backtest your EMA strategies thoroughly before deploying them in live trading.
Pro Tips for Advanced Traders
- Experiment with fractional EMA settings (e.g., 8 or 12) for potentially even greater responsiveness, but be mindful of increased noise.
- Develop a nuanced understanding of how different currency pairs or assets react to specific EMA settings. What works well for one might not be optimal for another.
- Incorporate order flow analysis alongside your EMA strategy for a deeper understanding of market sentiment and potential price movements.
- Consider using adaptive EMA settings that automatically adjust their period based on market volatility.
What is the best way to determine if an EMA crossover is a genuine signal?
A genuine EMA crossover is more likely to be accompanied by increased trading volume and confirmation from other indicators like RSI or MACD. Also, consider the broader market context and whether the crossover aligns with established support or resistance levels. Avoid relying solely on crossovers in isolation.
Can I use EMA on a 1-minute chart for swing trading?
While EMA is primarily used for identifying short-term trends on a 1-minute chart, it’s generally not ideal for swing trading, which focuses on capturing larger price movements over days or weeks. For swing trading, you’d typically use longer timeframes and longer-period EMAs (like the 50 or 200 EMA) to identify broader trends.
How often should I adjust my EMA settings on a 1-minute chart?
Frequent adjustments to your EMA settings on a 1-minute chart are generally not recommended. Focus on finding settings that work well across various market conditions through backtesting. Constantly changing your settings based on recent performance can lead to curve-fitting and may not be sustainable in the long run. Stick to your tested strategy unless there’s a fundamental shift in market behavior.


