Are you a day trader or scalper constantly navigating the exhilarating yet demanding world of the 15-minute chart, tirelessly seeking that elusive edge? Do you find yourself questioning if your current technical indicators are truly optimized for capturing those rapid intraday price swings? The quest for the most effective tools is a constant pursuit for those who thrive in this fast-paced environment. You’ve likely encountered the Exponential Moving Average (EMA), a powerful indicator lauded for its ability to smooth price action and highlight potential trading opportunities. But here’s the crucial question: what are the best EMA settings for the 15 minute chart that can truly unlock consistent profitability?
This in-depth guide is meticulously crafted for traders like you, aiming to demystify the process of selecting and utilizing optimal EMA settings for this popular short-term timeframe. We will meticulously explore the intricacies of the EMA, delve into a range of potentially effective settings, and equip you with the practical knowledge necessary to make well-informed trading decisions.
If you’re serious about refining your short-term trading strategy and are perhaps seeking a reliable forex trading broker to execute your trades, understanding the nuances of EMA settings on the 15-minute chart is an absolutely essential step towards achieving your financial goals. This article will provide a clear path to understanding and implementing the best EMA settings for 15 minute chart forex trading.
Introduction to EMA and Its Importance in 15-Minute Charts
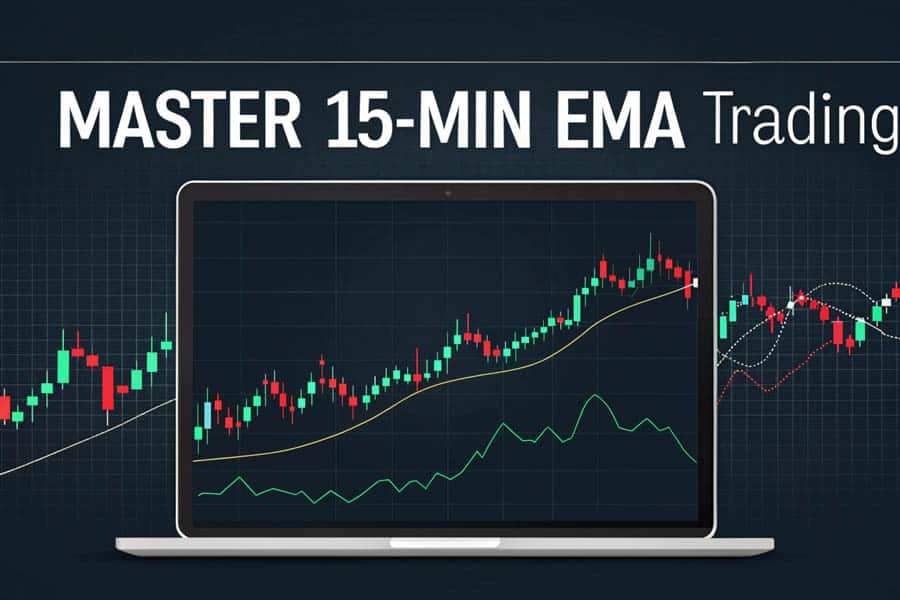
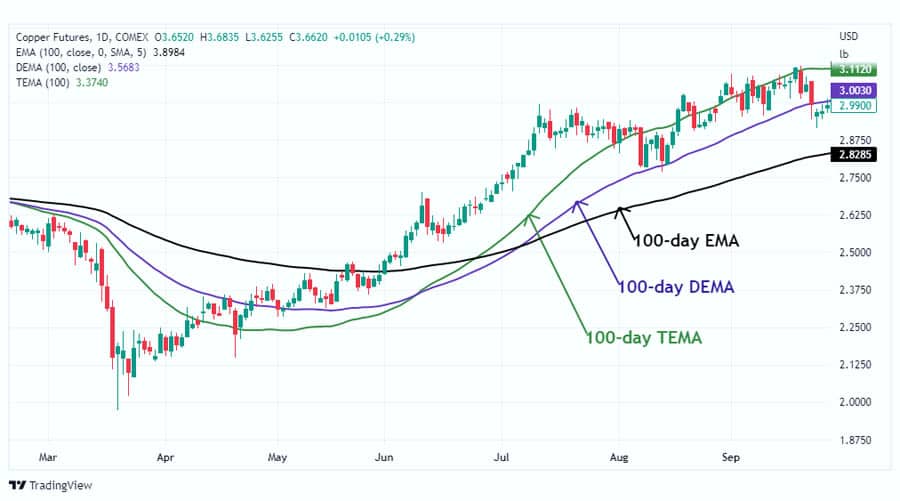
The Exponential Moving Average, or EMA, stands as a cornerstone of technical analysis, serving as a vital tool for traders seeking to discern the underlying trend amidst the often-choppy price action. In essence, the EMA is a type of moving average that places a greater weight and significance on the most recent price data points. This characteristic makes it inherently more responsive to new information compared to its counterpart, the Simple Moving Average (SMA). This heightened sensitivity is precisely what makes the EMA so relevant and valuable in the context of short-term trading, particularly on the 15-minute chart.
Definition of EMA and its relevance in short-term trading
To elaborate further, the EMA’s calculation involves a smoothing factor that exponentially decreases the weight given to older data. This means that the most recent price bars have a more significant impact on the EMA’s current value. For a day trader or scalper operating on the 15-minute chart, this responsiveness is paramount. The ability of the EMA to quickly adapt to evolving price dynamics allows traders to identify potential entry and exit points with greater precision, capitalizing on short-lived trends and momentum shifts that might be missed by a less reactive indicator. Understanding this core principle of the EMA is fundamental to appreciating its importance in the fast-paced world of 15-minute chart trading.
Why the 15-minute chart is popular among day traders and scalpers
The 15-minute chart holds a unique allure for day traders and scalpers due to the balance it strikes between providing sufficient trading opportunities and manageable levels of market noise. It offers a granular view of intraday price movements, allowing traders to identify and exploit numerous short-term trends and price fluctuations throughout the trading session. This timeframe is particularly attractive for those seeking to generate profits from small price changes, often holding positions for just a few minutes to a few hours.
The increased frequency of trading signals on the 15-minute chart, compared to longer timeframes, provides more opportunities for active participation in the market. However, this also necessitates the use of responsive and accurate indicators like the EMA to effectively navigate the rapid price action.
Why EMA is Preferred Over SMA for 15-Minute Charts
While both the Exponential Moving Average (EMA) and the Simple Moving Average (SMA) serve the purpose of smoothing price data, their distinct calculation methodologies lead to significant differences in their responsiveness and suitability for different trading styles and timeframes. For the specific demands of 15-minute chart trading, the EMA generally emerges as the preferred choice due to its inherent characteristics.
Read More: Best 15 minute forex trading strategy
Explanation of EMA’s responsiveness to recent price data
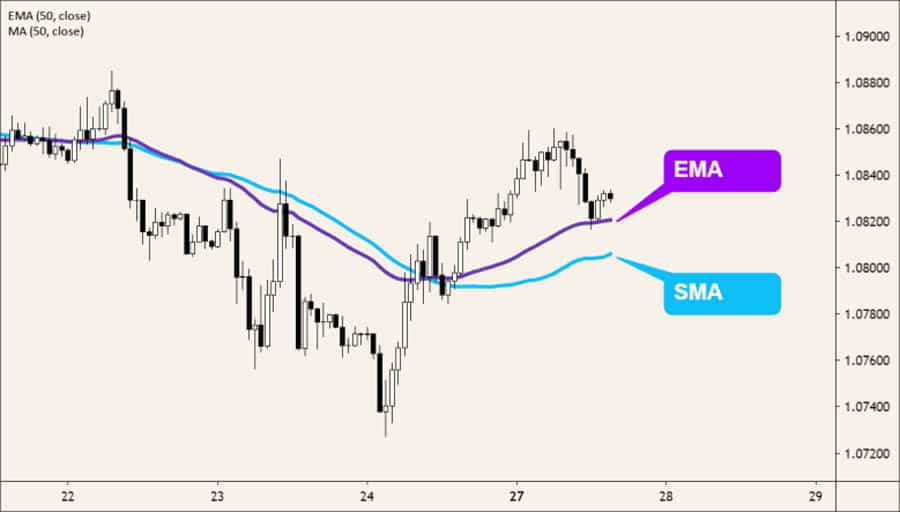
The key differentiator lies in how each moving average weighs the data points within its lookback period. The SMA calculates the average price by giving equal weight to all prices within the specified period. In contrast, the EMA, as previously mentioned, applies a weighting factor that exponentially decreases as the data points become older. This means that the most recent price fluctuations have a proportionally larger impact on the EMA’s value. This heightened sensitivity allows the EMA to react more swiftly to emerging trends and price reversals, providing earlier signals to traders operating on the 15-minute chart where timing is absolutely critical.
Comparison with SMA and why EMA is more suitable for short-term trading
Consider a scenario where a sudden surge in buying pressure causes a rapid price increase. An EMA will reflect this upward movement much faster than an SMA with the same period. The SMA, due to its equal weighting of all data points, will lag behind, potentially delaying entry signals and reducing potential profit. On the 15-minute chart, where traders are often looking to capitalize on short bursts of momentum, this lag can be a significant disadvantage.
The EMA’s ability to provide a more current and accurate representation of the prevailing price action makes it a more effective tool for identifying short-term trends, potential breakouts, and timely entry and exit points. Therefore, for the specific needs of day traders and scalpers on the 15-minute chart, the EMA’s responsiveness offers a distinct advantage over the SMA.
Best EMA Settings for 15-Minute Charts
Identifying the single, universally “best EMA for 15 minute chart forex” setting is a nuanced endeavor, as the optimal choice can vary depending on individual trading styles, specific currency pairs being traded, and prevailing market conditions. However, through extensive analysis and practical application, certain EMA periods have consistently demonstrated their effectiveness and are widely favored by traders operating on the 15-minute timeframe. Let’s explore some of these commonly used and highly recommended settings, understanding their individual characteristics and potential applications.
Overview of commonly used EMA periods (e.g., 5 EMA, 20 EMA, 50 EMA)
Several EMA periods stand out as particularly useful for analyzing price action on the 15-minute chart. These include the 5 EMA, the 20 EMA, and the 50 EMA, each offering a different perspective on the market’s momentum.
- The shorter the EMA period, the more sensitive it will be to recent price changes.
- Longer periods will provide a smoother representation of the overall trend.
Why the 20 EMA is often recommended for 15-minute charts
The 20 EMA frequently emerges as a highly recommended setting for the 15-minute chart, and for good reason. It strikes a crucial balance between responsiveness and smoothness, effectively filtering out much of the short-term noise inherent in this timeframe while still being sensitive enough to capture significant shifts in trend direction. Many traders utilize the 20 EMA as a primary indicator of the immediate trend.
- When the price consistently trades above the 20 EMA, it generally suggests an ongoing upward trend, providing potential opportunities for long positions.
- Conversely, when the price remains below the 20 EMA, it indicates a downward trend, favoring potential short positions.
The 20 EMA’s versatility makes it a valuable tool for both identifying trend direction and for generating potential entry and exit signals based on price interactions.
Exploring the 5 EMA for aggressive trading strategies
For traders with a more aggressive approach, particularly scalpers aiming to profit from very short-term price fluctuations, the 5 EMA can be a powerful tool. Its heightened sensitivity allows it to react almost instantaneously to price changes, providing very early entry and exit signals. This can be advantageous for capturing quick profits from small price movements. However, it’s crucial to acknowledge that this increased sensitivity also comes with a higher risk of generating false signals, especially during periods of high volatility or choppy market conditions. Traders employing the 5 EMA often need to utilize additional confirmation tools or employ robust risk management strategies to mitigate the potential for whipsaws and false breakouts.
Understanding the role of the 50 EMA on the 15-minute chart
While primarily utilized for identifying intermediate-term trends on longer timeframes, the 50 EMA can still offer valuable insights when applied to the 15-minute chart. On this shorter timeframe, the 50 EMA often acts as a significant dynamic support or resistance level. Traders watch for instances where the price approaches and interacts with the 50 EMA, as these interactions can signal potential trend continuations or even reversals.
- In an established uptrend, a pullback to the 50 EMA that results in a bounce can provide a high-probability entry point for a continuation of the upward movement.
- Conversely, in a downtrend, a rally towards the 50 EMA that encounters resistance can signal an opportunity to enter a short position.
The 50 EMA provides a broader perspective on the trend within the 15-minute timeframe, offering context for shorter-term EMA signals.
Read More: EMA Scalping Strategies
Combining Multiple EMAs for Enhanced Strategy
While a single EMA can provide valuable insights into price action, combining multiple EMAs with different periods can significantly enhance the robustness and reliability of your trading strategy, particularly on the dynamic 15-minute chart. This approach allows for a more nuanced understanding of trend strength, potential trend changes, and more precise entry and exit signals.
Using a combination of 5 EMA and 20 EMA for trend confirmation
The combination of the 5 EMA and the 20 EMA is a popular and effective strategy employed by many traders on the 15-minute chart. The faster 5 EMA, with its greater sensitivity, reacts quickly to short-term price fluctuations, while the slower 20 EMA provides a smoother representation of the immediate trend.
- When the 5 EMA crosses above the 20 EMA, it generates a bullish signal, suggesting that short-term momentum is shifting upwards and potentially confirming the start of an uptrend.
- Conversely, when the 5 EMA crosses below the 20 EMA, it signals a bearish trend, indicating downward momentum.
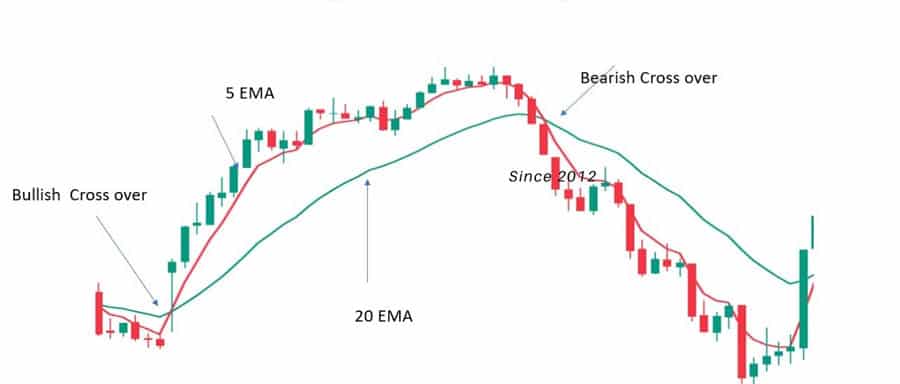
This crossover can be used as a primary entry signal for long or short positions, respectively. Furthermore, the distance between the two EMAs can also provide insights into the strength of the trend. A widening gap between the EMAs suggests increasing momentum in the direction of the trend.
The Triple EMA Strategy: 15 EMA, 25 EMA, and 50 EMA for crossovers
The Triple EMA strategy involves utilizing three EMAs with different periods – typically the 15 EMA, the 25 EMA, and the 50 EMA – to identify stronger trend confirmations and potential trend reversals on the 15-minute chart. This strategy builds upon the concept of EMA crossovers, adding an extra layer of confirmation.
- A strong bullish signal occurs when the fastest EMA (15 EMA) crosses above the middle EMA (25 EMA), and both are trading above the slowest EMA (50 EMA). This alignment suggests a significant shift in momentum and a higher probability of a sustained upward trend.
- Conversely, a bearish signal is generated when the 15 EMA crosses below the 25 EMA, and both are trading below the 50 EMA.
Crossovers between these EMAs can also signal potential shifts in the prevailing trend, providing opportunities to adjust trading positions or prepare for potential reversals. The Triple EMA strategy aims to filter out some of the noise associated with single or dual EMA crossovers, providing a more robust indication of trend direction.
How to Use EMA in 15-Minute Chart Trading
Effectively utilizing the Exponential Moving Average (EMA) on the 15-minute chart requires more than simply plotting it on your chart. It involves understanding how to interpret the signals it provides and strategically integrating those signals into your overall trading plan. Here are key ways to leverage the power of EMA for informed decision-making in your 15-minute chart trading.
Identifying trend direction using EMA slopes
One of the most fundamental applications of the EMA is its ability to clearly indicate the prevailing trend direction. The slope of the EMA line provides a visual representation of the market’s momentum.
- An upward-sloping EMA suggests that prices are generally trending higher, indicating bullish momentum.
- Conversely, a downward-sloping EMA signals a downtrend and bearish momentum.
Furthermore, the relationship between the price action and the EMA is crucial. When the price consistently trades above an upward-sloping EMA, it reinforces the bullish trend, suggesting potential buying opportunities. Conversely, when the price consistently trades below a downward-sloping EMA, it strengthens the bearish outlook, favoring potential selling opportunities. Observing the EMA’s slope in conjunction with price positioning provides a quick and effective way to assess the dominant trend on the 15-minute chart.
Entry and exit signals based on EMA crossovers and price interactions
As previously discussed, EMA crossovers can serve as valuable entry signals in a trading strategy. For instance, the popular 5 EMA and 20 EMA crossover strategy generates a buy signal when the faster 5 EMA crosses above the slower 20 EMA, suggesting a potential upward move. Conversely, a sell signal is triggered when the 5 EMA crosses below the 20 EMA. Beyond crossovers, price interactions with the EMA also offer important clues for potential entry and exit points.
- In an uptrend, when the price pulls back to touch or briefly breach the rising EMA and then bounces back upwards, it can be interpreted as a continuation signal, providing an opportunity to enter a long position.
- Similarly, in a downtrend, a rally towards the falling EMA that encounters resistance and then reverses can signal an opportunity to enter a short position.
- Conversely, a decisive break below the EMA in an established uptrend, or a break above the EMA in a downtrend, could signal a potential trend reversal or a weakening of the current trend, prompting consideration of exiting existing positions.
Integrating EMA with Other Indicators
While the EMA is a powerful and versatile tool in its own right, combining it with other technical indicators can significantly enhance the accuracy and reliability of your trading signals on the 15-minute chart. This synergistic approach allows you to gain a more comprehensive view of market conditions and filter out potential false signals, leading to more informed trading decisions.
Combining EMA with Supertrend for better accuracy
The Supertrend indicator is specifically designed to identify the current trend direction and potential changes in trend. When used in conjunction with the EMA, it can provide stronger confirmation of trading signals.
- If the Supertrend indicator generates a buy signal (typically indicated by the indicator line turning green and appearing below the price) and the price is also trading above a rising 20 EMA, it provides a higher probability setup for a long position.
- Conversely, a sell signal from the Supertrend (indicated by the line turning red and appearing above the price) coupled with the price trading below a falling 20 EMA strengthens the case for a short position.
The Supertrend acts as a trend filter, helping to validate EMA signals and reduce the likelihood of trading against the prevailing trend.
Using RSI or MACD alongside EMA for confirmation
Oscillators like the Relative Strength Index (RSI) and the Moving Average Convergence Divergence (MACD) can provide valuable insights into overbought and oversold conditions, as well as potential divergences between price action and momentum. Using these oscillators in conjunction with the EMA can help filter out false signals and identify high-probability trading opportunities.
- A bullish EMA crossover (e.g., the 5 EMA crossing above the 20 EMA) accompanied by an oversold reading on the RSI (below 30) can provide a high-confidence buy signal, suggesting that the price is likely to reverse upwards.
- Similarly, a bearish EMA crossover coinciding with an overbought reading on the RSI (above 70) can signal a potential shorting opportunity.
- Divergences between the price and the oscillator, where the price makes a new high or low but the oscillator fails to do so, can also provide early warnings of potential trend reversals, which can be further confirmed by EMA signals.
Read More: Best macd settings for 15 minute chart
Using Bollinger Bands or Keltner Channels alongside EMA for volatility analysis
Bollinger Bands and Keltner Channels are volatility indicators that measure the degree of price dispersion around a moving average. When used in conjunction with the EMA, they can provide valuable insights into market volatility and potential breakout opportunities.
- If the price breaks out above the upper Bollinger Band or Keltner Channel while also confirming the trend direction with the EMA (e.g., trading above a rising EMA), it can signal a strong impulsive move and a potential buying opportunity.
- Conversely, a break below the lower band or channel, coupled with the price trading below a falling EMA, can indicate strong selling pressure.
- Furthermore, periods of low volatility, characterized by the bands or channels contracting, can often precede significant price movements.
Observing the EMA in conjunction with these volatility indicators can help traders anticipate potential breakouts and manage their risk accordingly.
OpoFinance Services
- ASIC Regulated for Your Peace of Mind: Trade with confidence knowing OpoFinance adheres to the stringent regulatory standards of the Australian Securities and Investments Commission (ASIC), ensuring a transparent and secure trading environment.
- Seamless Social Trading: Connect and learn from experienced traders through our innovative social trading platform. Follow successful strategies and gain valuable insights to enhance your own trading journey.
- Officially Featured on the MT5 Brokers List: Access the powerful MetaTrader 5 platform, a recognized industry leader, through OpoFinance. Benefit from advanced charting tools, technical indicators, and automated trading capabilities.
- Safe and Convenient Deposits and Withdrawals: Enjoy hassle-free transactions with our secure and diverse range of deposit and withdrawal methods, making funding your account and accessing your profits simple and efficient.

Ready to elevate your trading? Visit opofinance.com today to explore our platform and open an account.
Conclusion
In conclusion, the pursuit of the best EMA settings for the 15-minute chart is an ongoing process of learning, experimentation, and adaptation. While the 20 EMA serves as a robust foundation for many traders, understanding how to effectively combine multiple EMAs and integrate them with complementary indicators is crucial for developing a resilient and potentially profitable trading strategy. Always remember the importance of considering the broader market context and diligently backtesting your chosen settings to optimize your approach for different currency pairs and evolving market conditions. By embracing a disciplined and analytical mindset, you can harness the power of the EMA to navigate the dynamic landscape of the 15-minute chart and strive towards achieving your trading objectives.
Key Takeaways
- The 20 EMA is a widely recommended starting point for 15-minute chart trading due to its balance of responsiveness and smoothness.
- Combining multiple EMAs, such as the 5 EMA and 20 EMA, can provide stronger trend confirmation and entry/exit signals.
- Backtesting your EMA strategies on historical data is crucial for identifying optimal settings and potential weaknesses.
- Always consider the broader market context and higher timeframe trends when using EMA on the 15-minute chart.
- Integrating EMA with other indicators like RSI, MACD, or Bollinger Bands can enhance the accuracy of your trading signals.
How can I use EMA to identify potential trend reversals on the 15-minute chart?
To identify potential trend reversals using the EMA on the 15-minute chart, look for instances where the price decisively breaks through a key EMA, such as the 20 EMA or 50 EMA, after respecting it as support or resistance for a period. Another signal can be divergence between the price action and the EMA. For example, if the price is making lower lows but the EMA is making higher lows, it could indicate weakening bearish momentum and a potential upward reversal. Confirming these signals with candlestick patterns or other reversal indicators can increase the probability of a successful trade.
Are there specific times of day when certain EMA settings are more effective on the 15-minute chart?
Yes, market volatility tends to fluctuate throughout the trading day, and this can influence the effectiveness of different EMA settings on the 15-minute chart. During periods of higher volatility, such as the opening hours of major market sessions like London or New York, shorter EMA periods like the 5 EMA might provide more timely signals to capitalize on rapid price movements. Conversely, during periods of lower volatility or consolidation, longer EMAs like the 20 EMA or 50 EMA might be more effective at filtering out noise and providing a clearer picture of the underlying trend. Adjusting your EMA settings or being aware of their limitations based on the time of day and prevailing market volatility can be beneficial.
Besides crossovers, what other price action signals can be used in conjunction with EMA on the 15-minute chart?
Beyond EMA crossovers, several other price action signals can be effectively used in conjunction with the EMA on the 15-minute chart.
Look for candlestick patterns that form in close proximity to the EMA. For example, a bullish engulfing pattern forming right above a rising 20 EMA can be a strong buy signal, indicating that buyers are stepping in at that dynamic support level.
Similarly, pin bars or doji candles that bounce off the EMA in the direction of the prevailing trend can offer high-probability entry points.
Also, watch for instances where the price pulls back to the EMA and finds either support (in an uptrend) or resistance (in a downtrend), indicating that the EMA is acting as a dynamic support or resistance level and offering potential continuation trade setups.


