

Day trading in the forex market is a dynamic and fast-paced activity where traders aim to capitalize on small price movements within a single trading day. Unlike long-term trading strategies, day trading requires quick decision-making and a keen understanding of market trends. The high frequency of trades and the need for precise timing make technical indicators invaluable tools for day traders. These indicators help traders analyze market conditions, identify potential entry and exit points, and make informed trading decisions. If you’re looking for resources to get started, choosing a reliable online forex broker is crucial to ensure a smooth trading experience and access to advanced trading tools.

Best Forex Indicators for Day Trading
Moving Averages (MA)
Moving Averages (MAs) are foundational tools for day traders and are among the best forex indicators for day trading. They smooth out price data to create a single flowing line, making it easier to identify trends over a specific period. The two main types of MAs used in day trading are:
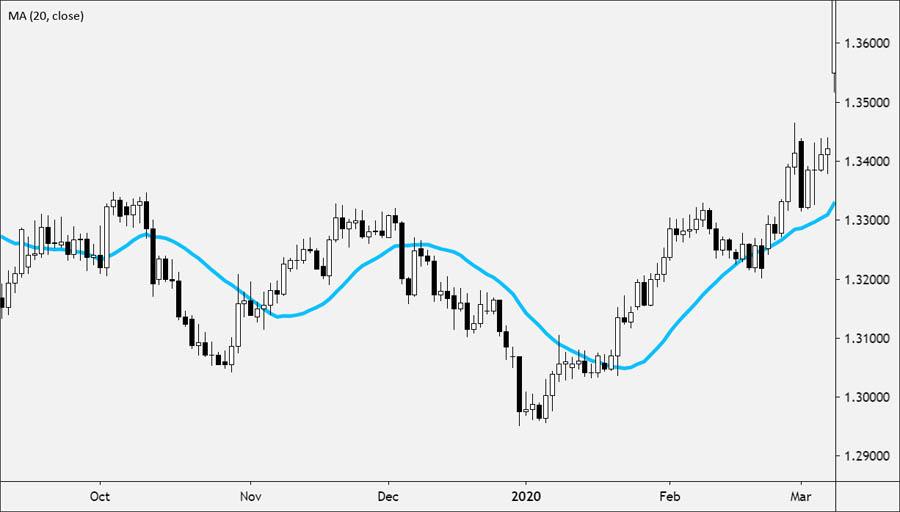
- Simple Moving Average (SMA): The SMA is calculated by taking the arithmetic mean of a given set of prices over a specific number of periods. For example, a 20-day SMA sums the closing prices of the last 20 days and divides by 20. SMAs are useful for identifying the overall direction of the trend but can be slow to react to recent price changes. Traders use SMAs to smooth out price data, thereby reducing noise and making it easier to see the underlying trend.
- Exponential Moving Average (EMA): The EMA gives more weight to recent prices, making it more responsive to new information. This characteristic makes EMAs particularly useful in volatile markets. For instance, a 20-day EMA will react more quickly to recent price changes than a 20-day SMA. EMAs are especially popular among day traders who need to react quickly to market changes.
Practical Uses of Moving Averages
Traders often use moving averages to identify trend direction and potential reversal points, marking them as one of the best indicators for intraday forex trading. A common strategy is the moving average crossover, where a short-term MA crosses above or below a long-term MA, signaling potential buy or sell opportunities. For example, a bullish crossover occurs when the 50-day EMA crosses above the 200-day EMA, indicating a potential upward trend. Conversely, a bearish crossover, where the 50-day EMA crosses below the 200-day EMA, can signal a downward trend.
Read More: Most Effective Forex Trading Indicators
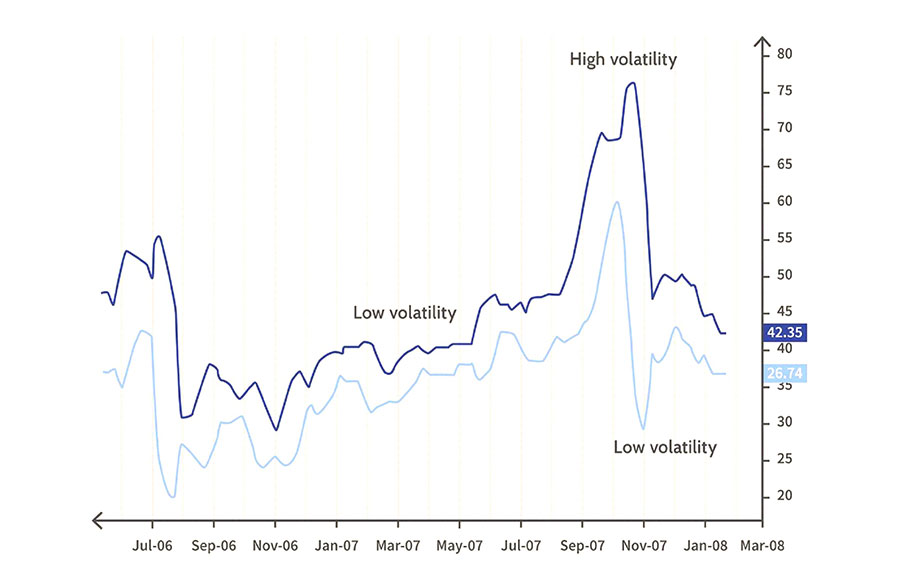
Bollinger Bands
Bollinger Bands, developed by John Bollinger, are a popular volatility indicator and one of the best forex indicators for day trading. They consist of three lines: a middle band (usually a 20-day SMA) and an upper and lower band. These bands are plotted two standard deviations away from the middle band, creating a dynamic range that expands and contracts based on market volatility.
- Upper Band: Calculated by adding two standard deviations to the middle band.
- Lower Band: Calculated by subtracting two standard deviations from the middle band.
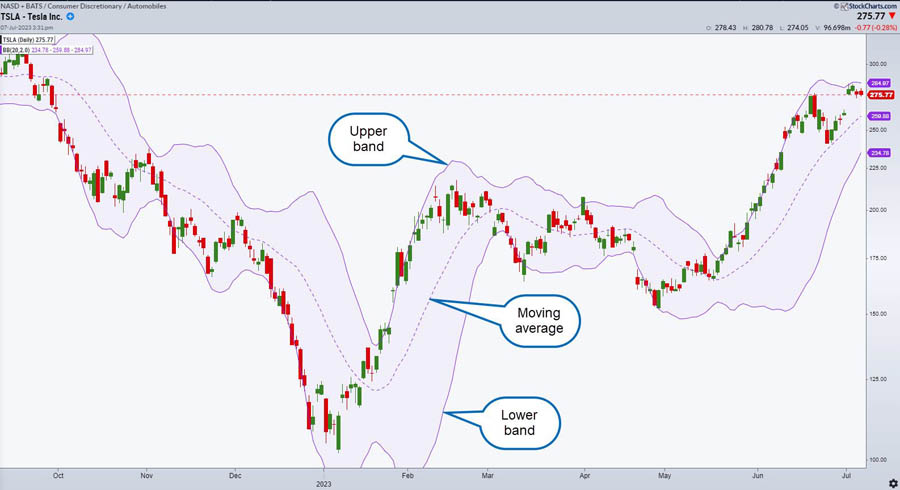
How Bollinger Bands Work
Bollinger Bands are particularly useful for identifying periods of high and low volatility and potential breakouts, making them one of the best indicators for intraday forex trading. When the bands are narrow, it indicates low volatility, which is often followed by a period of high volatility. Conversely, wide bands suggest high volatility, which can signal potential trend reversals. Traders use Bollinger Bands to identify overbought and oversold conditions. When the price touches the upper band, it indicates overbought conditions, and when it touches the lower band, it indicates oversold conditions. A common trading strategy is to look for price breakouts from the bands, which can signal the start of a new trend.
Relative Strength Index (RSI)
The Relative Strength Index (RSI), developed by J. Welles Wilder, is a momentum oscillator that measures the speed and change of price movements. It ranges from 0 to 100 and is one of the best forex indicators for day trading, used to identify overbought or oversold conditions in the market.
- Overbought Conditions: An RSI value above 70 suggests that the market is overbought, indicating that the price may be due for a correction.
- Oversold Conditions: An RSI value below 30 suggests that the market is oversold, indicating that the price may be due for a rebound.
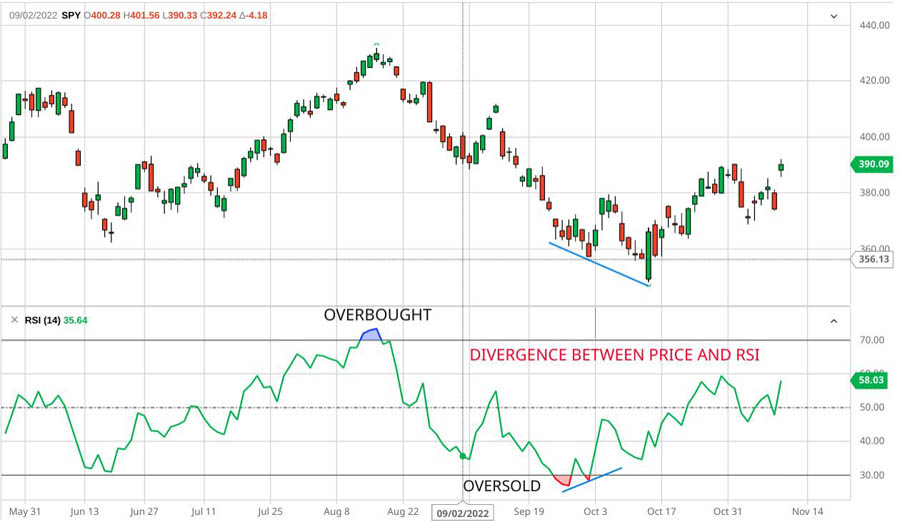
Using RSI Effectively
RSI can also be used to identify potential reversal points by looking for divergences between the RSI and the price, enhancing its value as the best indicator for intraday forex trading. For example, if the price is making new highs while the RSI is making lower highs, it may indicate a potential reversal. Traders often use RSI in combination with other indicators to confirm signals. For instance, a trader might look for a bullish divergence (price making lower lows while RSI makes higher lows) to confirm a potential upward reversal. Additionally, the RSI’s midpoint (50) can be used as a trend indicator: values above 50 suggest a bullish trend, while values below 50 indicate a bearish trend.
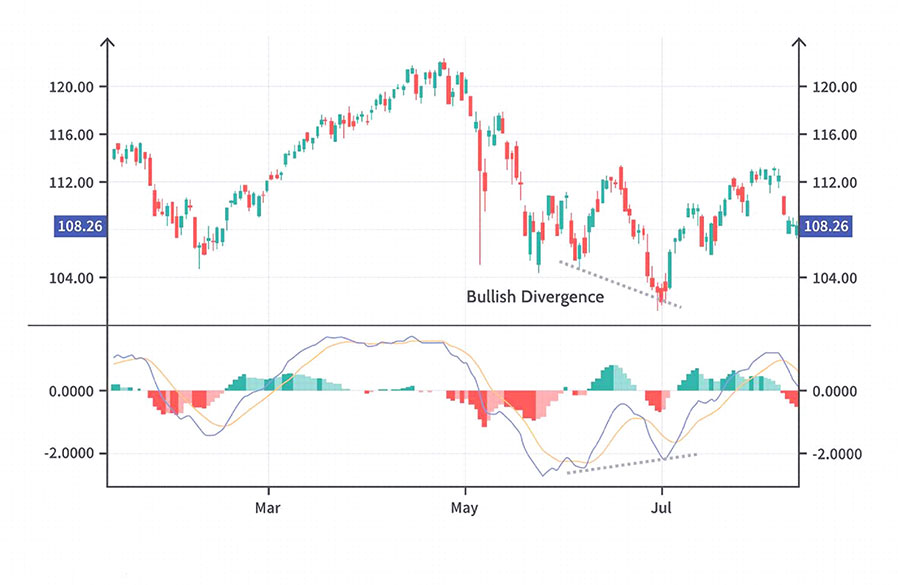
Moving Average Convergence Divergence (MACD)
The Moving Average Convergence Divergence (MACD), developed by Gerald Appel, is a trend-following momentum indicator that shows the relationship between two moving averages of a security’s price. The MACD is calculated by subtracting the 26-period EMA from the 12-period EMA, and it consists of three main components:
- MACD Line: The difference between the 12-period EMA and the 26-period EMA.
- Signal Line: The 9-period EMA of the MACD line.
- Histogram: The difference between the MACD line and the signal line.
Read More: Forex Diversification Strategies
Trading with MACD
Traders use the MACD to identify potential buy and sell signals, marking it as one of the best forex indicators for day trading. A bullish signal is generated when the MACD line crosses above the signal line, while a bearish signal is generated when the MACD line crosses below the signal line. The histogram helps visualize the difference between the MACD line and the signal line, providing additional insight into the strength and direction of the trend. For example, increasing histogram bars indicate strengthening momentum, while decreasing bars suggest weakening momentum. The MACD is versatile and can be used in various market conditions, making it a favorite among day traders for spotting trend reversals and continuations.
Fibonacci Retracements
Fibonacci retracements are a popular tool for identifying potential support and resistance levels, making them one of the best indicators for intraday forex trading. They are based on the key Fibonacci levels of 23.6%, 38.2%, 50%, 61.8%, and 100%, which are derived from the Fibonacci sequence.
- Retracement Levels: These levels are used to identify potential reversal points by measuring the distance between a significant high and low on a price chart. For example, if the price moves from a low of $100 to a high of $150, the 50% retracement level would be at $125.
- Support and Resistance: Fibonacci retracement levels are used to identify potential support and resistance zones, with the price often retracing to one of these levels before continuing in the direction of the trend.
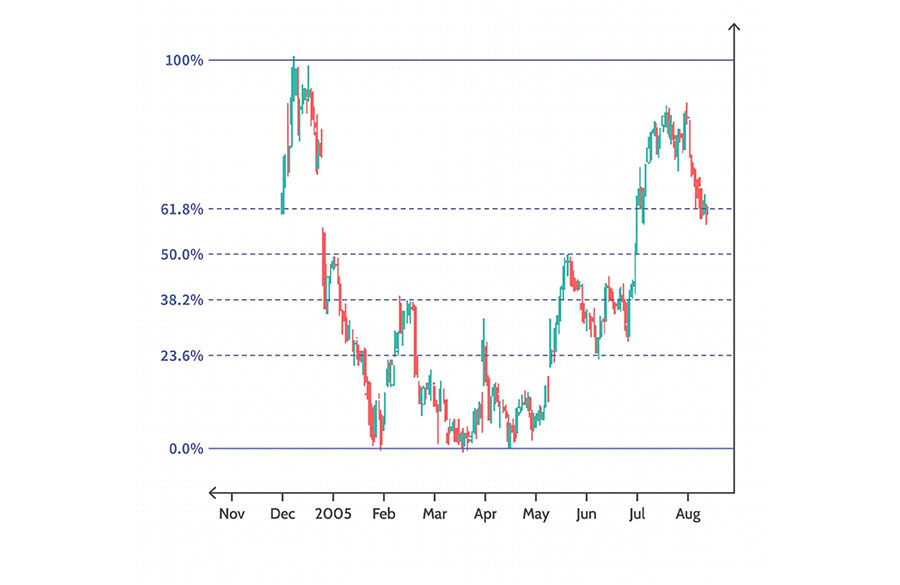
Applying Fibonacci Retracements
Traders use Fibonacci retracements to identify potential entry and exit points, as well as to set stop-loss orders and profit targets. For instance, if a trader identifies a retracement to the 38.2% level, they might place a buy order anticipating the price will resume its upward trend from this support level. The psychological nature of Fibonacci levels often means they are self-fulfilling prophecies, as many traders place orders at these levels, causing the price to react.
Parabolic SAR (Stop and Reverse)
The Parabolic SAR, developed by J. Welles Wilder, is a trend-following indicator that provides potential entry and exit points, making it one of the best forex indicators for day trading. It appears as a series of dots placed above or below the price, depending on the direction of the trend.
- Uptrend: When the price is in an uptrend, the dots are placed below the price.
- Downtrend: When the price is in a downtrend, the dots are placed above the price.
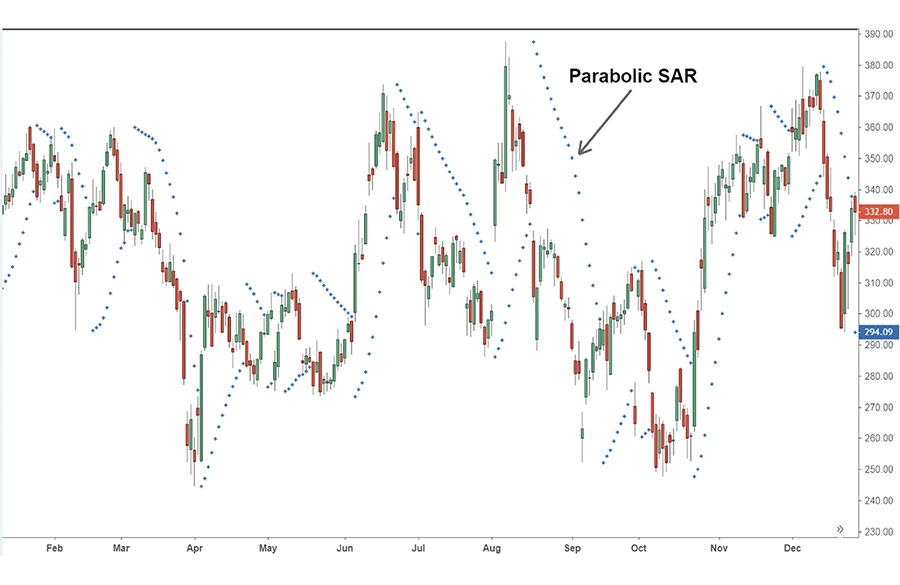
Parabolic SAR
Traders utilize the Parabolic SAR to pinpoint potential trend reversals:
- Identification of Reversal Points: Signals a shift from uptrend to downtrend (or vice versa) when dots move across price levels.
- Confirmation with Other Indicators: Often combined with other indicators for signal validation, enhancing its utility in intraday forex trading.
- Trailing Stop-Loss Orders: Effective for setting trailing stop-losses, securing profits as trends develop. For instance, in a strong uptrend, SAR trails below, adjusting upwards with new highs.
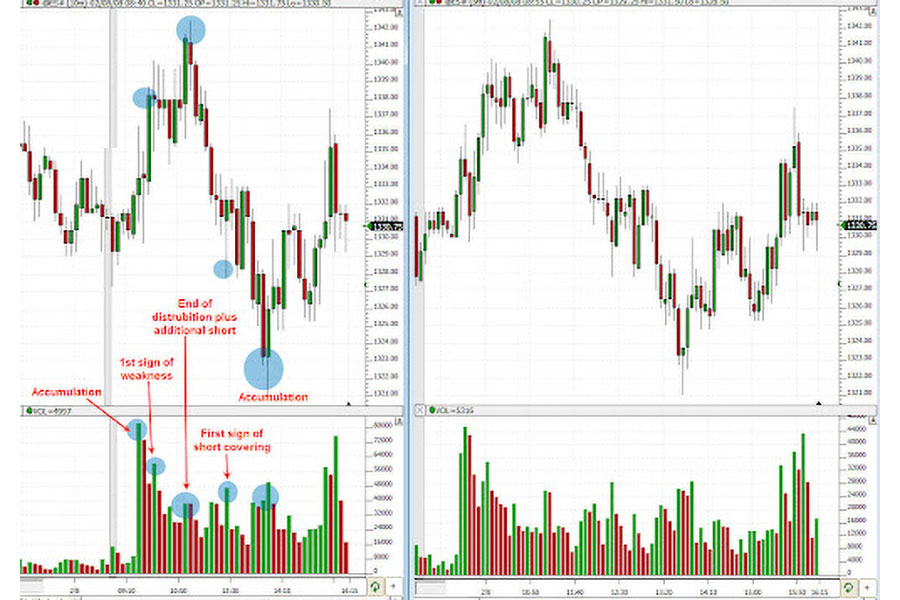
Smart Money Concept Indicators
Smart Money Concept (SMC) indicators assist in tracking institutional investor activities:
Volume Spread Analysis (VSA)
VSA examines price-volume dynamics to spot accumulation and distribution phases:
- Identifying Accumulation: High volume with minimal price movement suggests smart money accumulation.
Wyckoff Method
The Wyckoff Method employs principles to identify smart money actions:
- Wyckoff Phases: Defines market cycles (accumulation, markup, distribution, markdown) using price and volume analysis.
Order Flow Indicators
Order flow indicators analyze market buy and sell orders:
- Depth of Market (DOM) and Volume Profile: Reveal institutional trader behavior by illustrating buy-sell order concentrations at various price levels.
Additional Considerations for Day Trading
Volatility Indicators
Volatility indicators are crucial for day traders to navigate market fluctuations effectively:
Average True Range (ATR)
The Average True Range (ATR) by J. Welles Wilder measures price volatility:
- Volatility Measurement: Calculates average price range over a specified period (e.g., 14 days).
- Stop-Loss Orders: Guides setting stop-loss levels by adjusting entry price with ATR values. For instance, with an ATR of 20 pips and an entry at 1.3000:
- Long Position: Stop-loss at 1.2980
- Short Position: Stop-loss at 1.3020
Using ATR in Trading
The Average True Range (ATR) is crucial for managing risk and determining position size based on market volatility:
- Risk Management: ATR measures volatility, allowing for adjustment of stop-loss levels. Wider stops in high volatility and tighter stops in low volatility protect trades.
- Position Sizing: Adjust position size according to ATR. Higher ATR values suggest smaller positions to manage risk.
Stochastic Oscillator
Developed by George Lane, this momentum indicator identifies overbought and oversold conditions:
- Overbought: Readings above 80 indicate potential corrections.
- Oversold: Readings below 20 suggest possible rebounds.
Practical Application
- Signal Crossovers: %K crossing %D signals buy (above) or sell (below).
- Divergence: Price vs. oscillator divergence hints at reversals.
Price Action Trading
Analyzing price patterns and movements informs trading decisions:
- Candlestick Patterns: Visual cues for reversals or continuations.
- Support and Resistance: Key levels for entries/exits.
- Trend Lines: Direction indicators and breakout points.
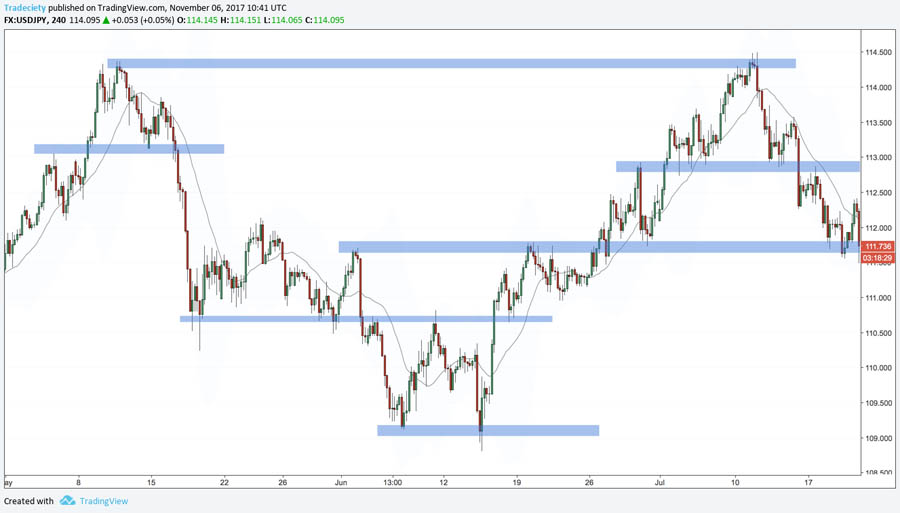
Using Price Action in Day Trading
Price action trading involves interpreting price movements to make informed decisions:
- Integration with Indicators: Traders combine price action analysis with technical indicators for confirmation. For instance, identifying a bullish candlestick pattern at a support level may be confirmed by an oversold RSI for entering a long position.
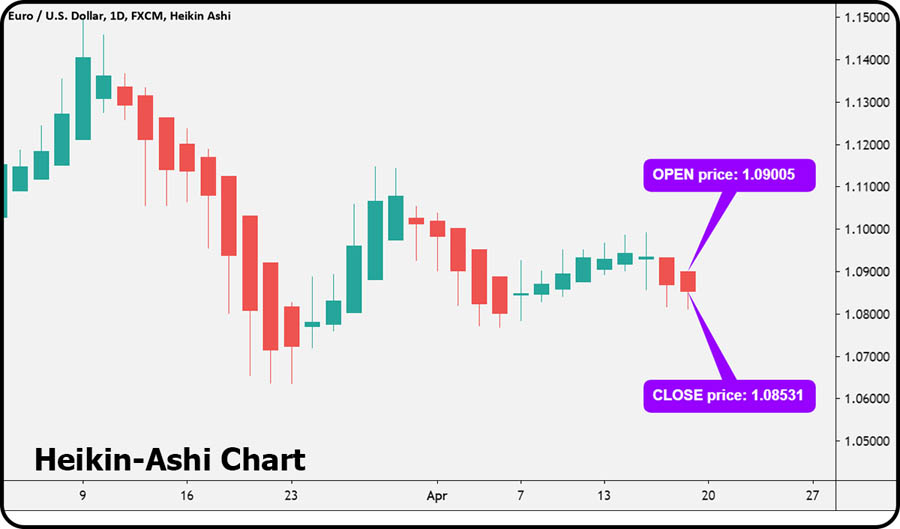
Heiken Ashi
Heiken Ashi modifies candlestick charts for trend clarity:
- Trend Identification: Smooths price data to show trend direction. Bullish trends are shown with green/white candles; bearish with red/black.
- Spotting Reversals: Changes in candle color/size indicate potential reversal points.
Heiken Ashi candles simplify trend identification and reversal spotting by smoothing price data.
Read More: High Reward Low Risk Forex Trading Strategies
Timeframes and Scalping
For day trading, precise timeframe selection is crucial, especially in scalping strategies:
- Shorter Timeframes: Focus on 1-minute or 5-minute charts for rapid entry and exit points.
- Quick Decision-Making: Swift execution is key to capturing small price movements effectively.
Risk Management
Protecting capital is paramount for day traders through:
Stop-Loss Orders
- Strategic Placement: Protect against losses by setting stop-loss orders below key support levels.
- Trailing Stop-Loss: Adjusts with price movements to lock in profits during favorable price trends.
Position Sizing
Optimize trade size based on risk tolerance and market conditions:
- Risk Allocation: Allocate a fixed percentage (1-2%) of capital per trade to manage risk exposure.
- Calculating Size: Determine trade size by dividing risk per trade by stop-loss distance.
Diversification
Spread risk across various instruments and strategies:
- Across Instruments: Trade different currency pairs or commodities to minimize exposure to single asset movements.
- Diverse Strategies: Use multiple trading strategies (e.g., trend following, mean reversion) to adapt to market conditions.
Integrating Indicators and Price Action

Enhance decision-making by combining technical indicators with price action:
Multiple Time Frame Analysis
Understand market context across different timeframes:
- Macro Perspective: Daily or weekly charts reveal broader trends and significant levels.
- Micro Perspective: Utilize shorter intervals for precise entry and exit timing.
Indicator Confluence
Increase trade confirmation with multiple indicators aligning on signals.
Conclusion
Day trading in the forex market demands technical analysis, swift decision-making, and effective risk management. Utilizing indicators like moving averages, Bollinger Bands, RSI, MACD, Fibonacci retracements, and Parabolic SAR enhances decision-making and identifies trading opportunities. Smart Money Concept indicators such as Volume Spread Analysis (VSA), the Wyckoff Method, and order flow indicators provide insights into institutional trading activities, aiding alignment with smart money strategies.
Volatility indicators like Average True Range (ATR) and the Stochastic Oscillator help manage market volatility and identify potential reversals. The Heiken Ashi technique simplifies trend identification and highlights reversal points by smoothing price data.
Choosing the right timeframe is crucial for day trading, especially in scalping strategies involving multiple rapid trades. Scalping demands quick execution to capture small price movements.
Integrating these indicators and strategies enhances day trading performance and boosts success in the dynamic forex market.
What is the best way to combine multiple indicators for day trading?
Combining multiple indicators can provide a more comprehensive analysis of market conditions. One effective way to combine indicators is to use a trend-following indicator, such as a moving average, alongside a momentum indicator, such as RSI or MACD. This allows traders to identify the direction of the trend and potential reversal points. Additionally, using a volatility indicator, such as Bollinger Bands or ATR, can help traders manage risk by providing insight into market volatility. It is important to test different combinations of indicators and adjust them based on the specific market conditions and trading strategy.
How can I improve my decision-making process in day trading?
Improving decision-making in day trading involves developing a well-defined trading plan and sticking to it. A trading plan should include specific entry and exit criteria, risk management strategies, and guidelines for managing emotions. Practicing discipline and patience is crucial, as impulsive decisions can lead to significant losses. Additionally, keeping a trading journal to track trades and analyze performance can help identify areas for improvement and refine the trading strategy. Continuous learning and staying updated with market news and events can also enhance decision-making skills.
Are there any common mistakes to avoid when using technical indicators for day trading?
Some common mistakes to avoid when using technical indicators for day trading include overcomplicating the analysis by using too many indicators, ignoring the importance of risk management, and failing to adapt to changing market conditions. It is important to keep the analysis simple and focus on a few key indicators that complement each other. Additionally, traders should always implement proper risk management strategies, such as setting stop-loss orders and managing position sizes. Being aware of the limitations of technical indicators and staying flexible to adjust the trading strategy based on market conditions can help avoid potential pitfalls.


