

The dream of every trader is to catch a market trend right at its turning point. Nailing a perfect entry just as the price reverses from a peak or trough is not just satisfying; it’s one of the most profitable maneuvers in a trader’s arsenal. However, this high-reward strategy comes with significant risk. Misjudging a reversal and fighting a persistent trend can lead to substantial losses. This guide is your comprehensive map to navigating these tricky waters. We will explore the best indicator for reversal trading, but more importantly, we’ll show how the true power lies in combining tools to find the most accurate reversal indicator setup. Whether you are searching for a reliable online forex broker or looking to sharpen your existing skills, mastering these concepts is crucial. We will break down the foundational indicators, advanced patterns, and, most importantly, a concrete strategy to identify high-probability reversals with confidence.
Key Takeaways
- No Single “Best” Indicator: The most reliable reversal signals come from the confluence of multiple indicators and patterns, not a single magic bullet. The real best indicator for reversal trading is a combination of tools.
- Divergence is Key: Divergence between price action and momentum oscillators like RSI and MACD is one of the most powerful and reliable signs of a potential reversal.
- Confirmation is Crucial: Always seek confirmation for a reversal signal. This can come from volume analysis, candlestick patterns, or chart patterns. Never trade on a single indicator’s signal alone.
- Volume Matters: A true reversal is almost always accompanied by a significant increase in trading volume, confirming the conviction behind the new direction.
- Strategy Over Signals: A robust trading plan that includes identifying the trend, spotting weakness, seeking confirmation, and managing risk is more important than knowing the indicators in isolation.
Understanding Market Reversals
Before we dive into the specific tools, we need to understand what we’re looking for. A market reversal is a fundamental shift in the prevailing price direction. It’s more than just a minor pullback or consolidation; it’s the end of one trend and the beginning of another. Identifying the best indicator for reversal trading starts with understanding the market psychology driving these shifts. Trends are fueled by collective sentiment—greed on the way up and fear on the way down. A reversal occurs when that sentiment reaches a peak and begins to shift. At a market top, you see euphoria; at a bottom, you witness capitulation. These extremes are when smart money begins to move against the herd. This is why no single indicator is a magic bullet. An indicator might signal “overbought,” but it can’t tell you when the tipping point of market sentiment will occur. That’s why confirmation is the bedrock of successful reversal trading.
The Core Four Reversal Indicators
Most experienced traders have a core set of tools they rely on to gauge the market’s pulse. These four indicators are staples in the world of technical analysis and are foundational to spotting potential turning points. Their strength lies in measuring momentum, which often wanes before a trend fully reverses. Let’s look at them from a practical standpoint.
Read More: Trend Reversal Trading Strategy
Relative Strength Index (RSI)
The RSI is a momentum oscillator that measures the speed and change of price movements on a scale of 0 to 100. It’s one of the first tools traders turn to when seeking the most accurate reversal indicator.
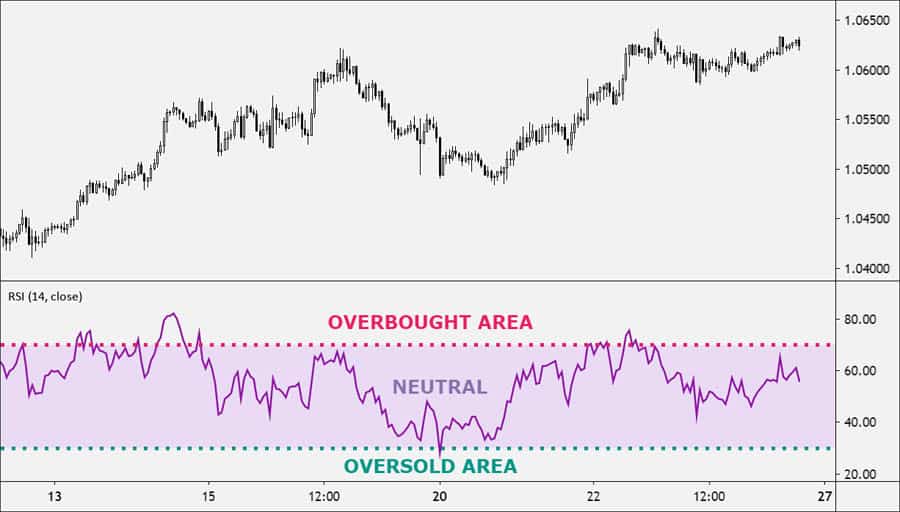
How it Signals Reversals: The most common signals are overbought conditions (typically above 70) and oversold conditions (typically below 30). However, a professional tip is to never sell just because the RSI hits 70. Markets can stay overbought for a long time in a strong trend. The most powerful reversal signal from the RSI is divergence.
- Bearish Divergence: The price prints a higher high, but the RSI prints a lower high. This indicates that despite the price push, the underlying momentum is fading, often preceding a move down.
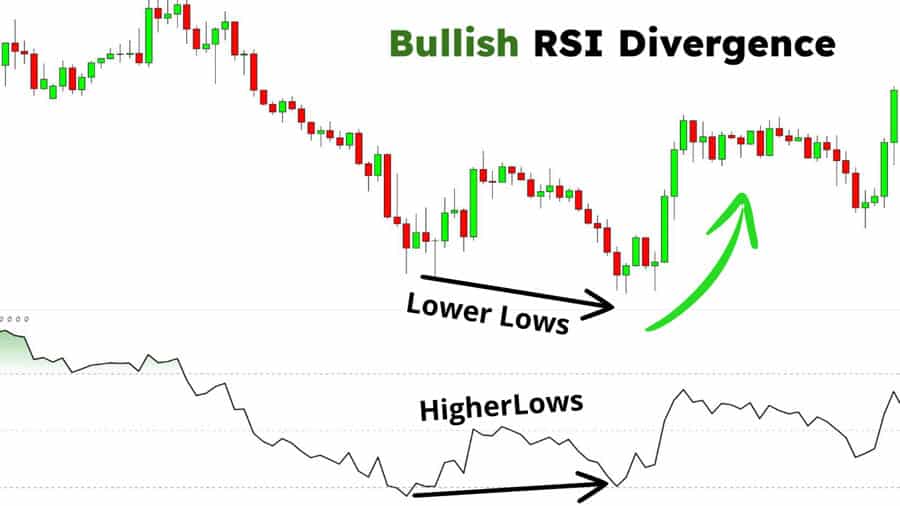
- Bullish Divergence: The price makes a lower low, but the RSI makes a higher low. This suggests that selling pressure is weakening, and a bottom may be forming.
Practical Tip: For a high-quality signal, wait for the divergence to form and then watch for the RSI line to cross back below the 70 level (for a bearish reversal) or back above the 30 level (for a bullish reversal). This confirms the momentum shift has actually started.
Moving Average Convergence Divergence (MACD)
The MACD is a trend-following momentum indicator that shows the relationship between two exponential moving averages (EMAs). It consists of the MACD line, the signal line, and a histogram that represents the difference between the two.
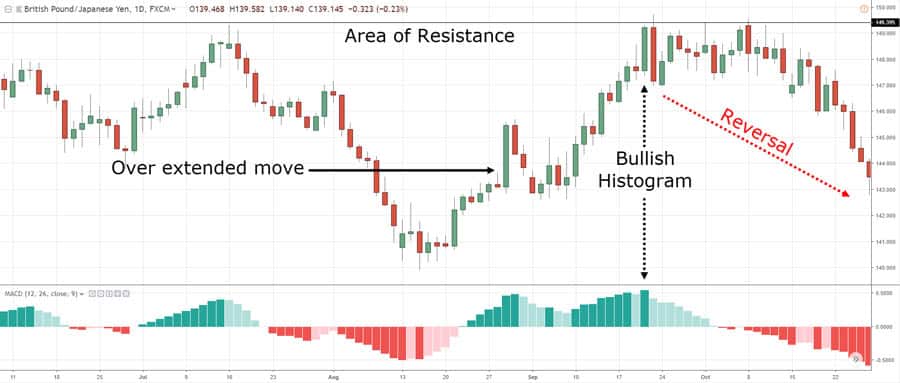
How it Signals Reversals: While the classic MACD line crossover is a decent signal, it can be late. For finding reversals earlier, the histogram and divergence are far more powerful. Think of the histogram as the ‘gas pedal’ of the trend. When the bars start getting shorter and shrinking toward the zero line while the price is still making new highs or lows, it means the trend is running out of fuel. This is a clear warning sign from what many consider a contender for the best indicator for reversal trading.
- Bearish Divergence: The price charts higher highs while the MACD’s histogram forms lower highs. This shows the upward trend is losing its strength.
- Bullish Divergence: The price charts lower lows while the MACD’s histogram creates higher lows, signaling a potential trend change to the upside.
Bollinger Bands®
Bollinger Bands consist of a simple moving average (the middle band) and two outer bands representing standard deviations. They are a fantastic tool for visualizing volatility and potential price extremes.
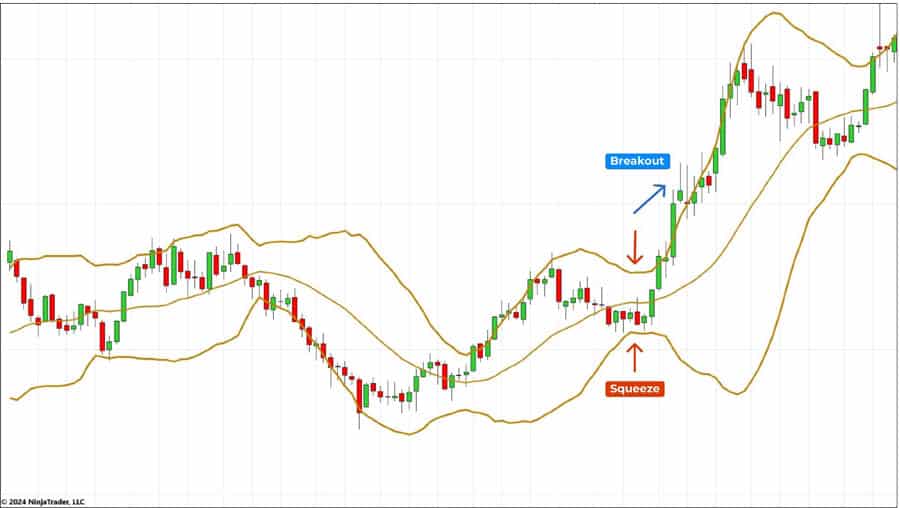
How it Signals Reversals: A key signal is the “Squeeze,” where the bands contract tightly, indicating low volatility that often precedes an explosive move. More direct reversal signals include:
- Tops/Bottoms Outside the Bands: A price closing outside the upper or lower band is often unsustainable. A practical entry signal is when a candle pokes outside the band, but the next candle closes firmly back inside. This is a classic rejection signal.
- M-Tops: At the upper band, the price touches it, pulls back, and then makes a second attempt to push higher that fails to decisively break the prior high. This “M” shape, especially when the second peak is lower than the first, is a strong bearish reversal pattern. The W-Bottom is its bullish equivalent at the lower band.
Stochastic Oscillator
Similar to the RSI, the Stochastic Oscillator is a momentum indicator, but it specifically compares a closing price to its high-low range over a period. This makes it very sensitive to recent price action and excellent for spotting turning points.
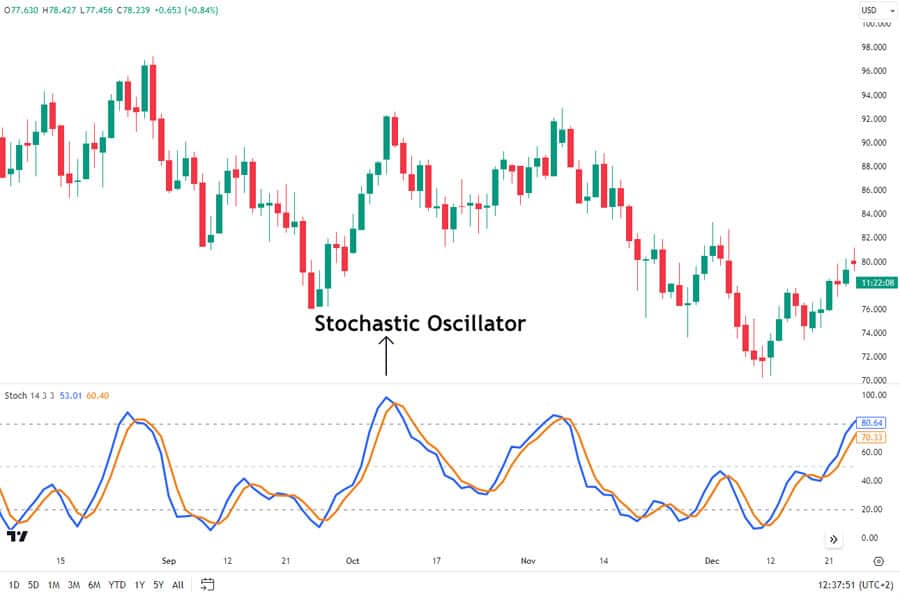
How it Signals Reversals: It uses overbought (above 80) and oversold (below 20) levels. Like the RSI, the strongest signal is divergence. A bearish divergence (higher highs in price, lower highs in the Stochastic) or a bullish divergence (lower lows in price, higher lows in the Stochastic) is a clear warning. The search for the most accurate reversal indicator must include the Stochastic due to its sensitivity.
Practical Tip: A powerful confirmation signal is to watch for the two lines of the oscillator (the %K and %D) to cross over while inside the overbought or oversold zone. For example, a bearish crossover above the 80 level is a much stronger signal than just the oscillator being above 80.
Read More: divergence scalping strategy
Essential Supporting Indicators
Relying solely on one of the core four is a rookie mistake. Professional traders build a case for a reversal by seeking confirmation from other, complementary indicators. Think of yourself as a detective; the more clues you find pointing in the same direction, the more confident you can be.
Moving Averages (MAs)
Moving averages smooth out price action and help define the trend. They are your baseline for context.
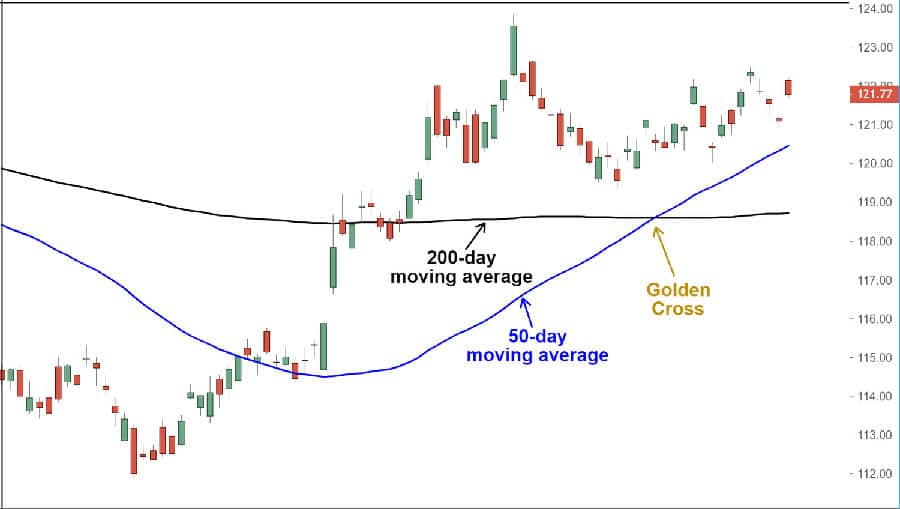
Practical Use: While the “Golden Cross” and “Death Cross” (50 MA crossing 200 MA) are famous, they are extremely slow and better for long-term investors. For active traders, watching how the price interacts with a key EMA like the 21 or 50 is more useful. A clear break and close on the other side of a key EMA that was previously acting as support or resistance is a strong confirmation that the trend’s character has changed. It’s a simple, yet effective part of any system claiming to be the best indicator for reversal trading.
Fibonacci Retracement
The Fibonacci tool is crucial for identifying hidden support and resistance levels where a reversal might ignite. It helps predict where a counter-trend bounce will run out of steam.
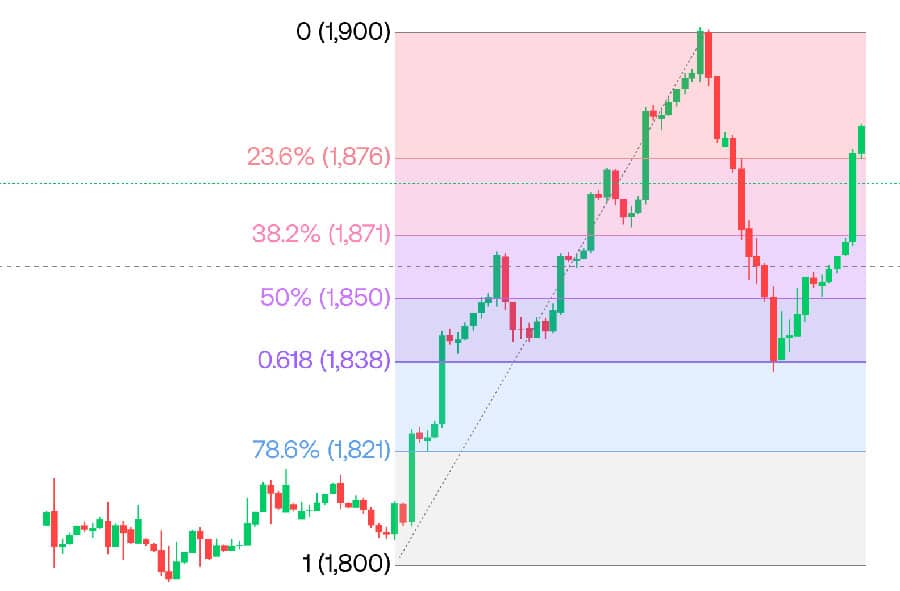
Practical Application Step-by-Step:
- Wait for a strong, clear trend move (e.g., a big push up).
- Identify the absolute bottom (Swing Low) and top (Swing High) of that entire move.
- Draw the Fibonacci Retracement tool from the Swing Low to the Swing High.
- The tool will plot key levels. Pay special attention to the zone between the 50% and 61.8% levels. This is often called the “golden pocket” where reversals are highly likely to occur. If you spot a bullish divergence on your RSI right as the price hits the 61.8% level, you have a very high-probability setup.
Volume Analysis
Volume confirms conviction. A price move without volume is like a car with no engine—it’s not going anywhere. For this reason, many argue that volume is the most accurate reversal indicator of them all, even though it’s often overlooked.
Practical Tells:
- Capitulation Volume: At the end of a long downtrend, you’ll often see a day with a massive, climactic spike in volume as the last of the sellers panic and give up. This exhaustion of selling pressure often marks the exact bottom.
- Exhaustion Volume: At a top, you might see price push slightly higher on a huge volume spike, but then immediately reverse. This shows a final burst of buying that was met with overwhelming selling pressure.
Advanced Reversal Patterns
Indicators are great, but the price action itself forms patterns that tell a clear story. Combining a powerful indicator signal with a classic price pattern is the essence of a high-confidence trade.
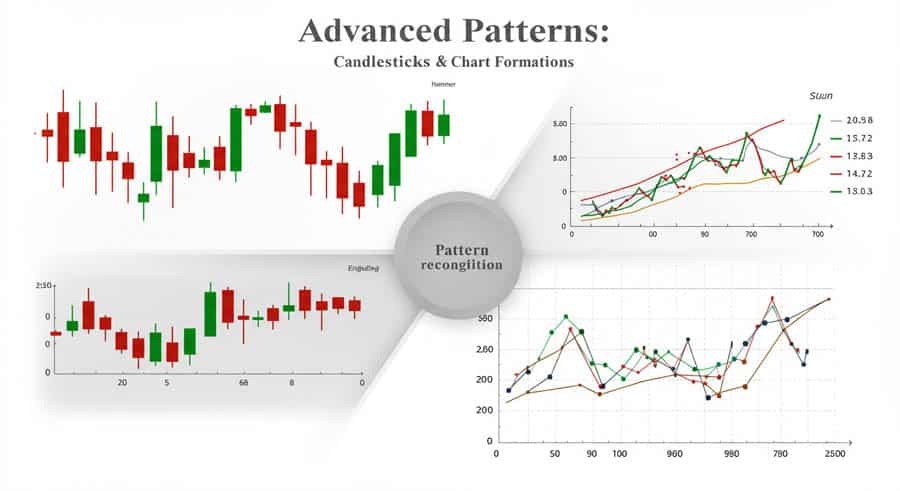
Candlestick Patterns
Candlesticks are the language of the market. Learning to read them is essential.
- Engulfing Patterns: The Bullish Engulfing is powerful because it shows that in one session, the buyers completely overwhelmed the sellers from the previous session, marking a decisive shift in control.
- Hammer/Hanging Man: The long wick on a Hammer shows that sellers tried to push the price much lower, but buyers stormed back and forced a close near the high. It’s a story of a failed bearish attack.
- Morning/Evening Star: This three-candle pattern is powerful because it shows a transition: a strong trend candle, followed by an indecision candle (the star), followed by a strong reversal candle. It’s a complete narrative of a trend’s death. This sequence can be the most visually compelling argument that a reversal is underway, making it part of the conversation for the best indicator for reversal trading.
Chart Patterns
Over longer periods, price action creates larger patterns that can predict major shifts.
- Head and Shoulders: The psychology here is key. The left shoulder is the existing uptrend. The head is the final, euphoric peak. The right shoulder is a lower peak, showing that the buyers no longer have the strength to push to new highs. The break of the neckline is the confirmation that the bears are now in control.
- Double Tops/Bottoms: An “M”-shaped pattern where the price fails twice at the same resistance level is a clear sign that the level is a formidable barrier. The failure on the second attempt shows buyer exhaustion. A “W”-shaped pattern at a bottom tells the opposite story of seller exhaustion. The most accurate reversal indicator setup often includes one of these classic patterns.
Read More: ICT Trend Reversal
Building a Robust Reversal Trading Strategy
Knowing the tools is one thing. Using them together in a systematic way is what creates success. The goal is to find confluence—multiple, independent signals all pointing to the same outcome. This is how you develop what you can personally call your best indicator for reversal trading: a system, not a single line on a chart.
A Step-by-Step Framework for a Trade
- Identify the Prevailing Trend: Use a 50 or 200 EMA. Is the price consistently above it (uptrend) or below it (downtrend)? You need to know what you’re reversing from.
- Watch for Initial Weakness (Divergence): This is your first alert. As the trend makes a new high, look for bearish divergence on the RSI or MACD. Don’t act yet, just pay attention.
- Seek Confirmation from a Second Indicator: Does the price peak coincide with it hitting the upper Bollinger Band? Is the Stochastic crossing down from the overbought zone? Get a second piece of evidence.
- Find a Reversal Price Pattern: Now, look at the candles. Do you see a Bearish Engulfing pattern, an Evening Star, or a Double Top forming right at that peak? This is your price action confirmation.
- Confirm with Volume: Was that reversal candle or pattern breakdown accompanied by a noticeable spike in volume? This is your final “green light.”
- Plan Your Entry, Stop, and Exit: Only now, with 4-5 points of confluence, do you plan the trade. Enter after the confirming candle closes. Place your stop-loss just above the highest point of the reversal pattern. Set a profit target at a logical support level, like a previous swing low or a major moving average. This disciplined approach is truly the best indicator for reversal trading.
Risk Management in Reversal Trading
Let’s be clear: reversal trading is inherently risky because you are stepping in front of an established trend. It’s like trying to stop a moving car. This is why risk management is non-negotiable. Always use a hard stop-loss. If the reversal fails and the price pushes to a new high (or low), your thesis was wrong. Accept it, take the small loss, and wait for the next high-probability setup. Chasing a failed reversal is one of the fastest ways to blow up a trading account. The goal is not to be right every time but to ensure your wins are bigger than your losses. Finding the most accurate reversal indicator setup helps improve your win rate, but proper risk management ensures you stay in the game.
Opofinance: Your Partner in Trading
Finding the right tools is only part of the equation; you also need a reliable platform to execute your strategy. Opofinance, an ASIC-regulated broker, provides a robust environment designed for modern traders looking to apply advanced strategies.
- Advanced Trading Platforms: Choose from a suite of elite platforms including MT4, MT5, cTrader, and the proprietary OpoTrade app, ensuring you have the best tools for your analysis.
- Innovative AI Tools: Gain a competitive edge with cutting-edge AI technology. Utilize the AI Market Analyzer for deep insights, the AI Coach to refine your strategy, and AI Support for instant assistance.
- Diverse Trading Opportunities: Engage with the market through Social Trading to follow successful traders or explore Prop Trading opportunities to trade with the firm’s capital.
- Secure & Flexible Transactions: Experience seamless banking with safe and convenient deposit and withdrawal methods. Opofinance embraces modern finance by supporting crypto payments and, importantly, charges zero fees on transactions from their side.
Explore what Opofinance has to offer
Conclusion
In the quest to find the single best indicator for reversal trading, we discover a more profound truth: there is no holy grail. The most accurate reversal indicator is not a standalone tool but a confluence of signals. Success in reversal trading comes from a disciplined, multi-layered approach. It involves using momentum oscillators like the RSI and MACD to spot initial weakness through divergence, confirming that weakness with candlestick or chart patterns, and validating the entire setup with a surge in volume. This methodical process of building a case for a reversal is what separates consistently profitable traders from those who perpetually fall into market traps. By adopting this strategic mindset and diligently applying the principles of confluence and confirmation, you can transform the high-risk art of reversal trading into a calculated, high-probability component of your overall trading plan.
What is the most common mistake traders make when trying to spot reversals?
The most common mistake is acting too early based on a single indicator, like seeing an “overbought” RSI signal, without waiting for confirmation from price action, volume, or other indicators.
How can I practice identifying reversals without risking real money?
Use a demo account, which is offered by most forex brokers. Go back in time on the charts and try to spot historical reversals using the confluence strategy. This backtesting is crucial for building confidence.
Are reversal indicators effective in all market conditions?
Reversal indicators are most effective in clearly trending markets that are showing signs of exhaustion. In choppy, sideways-ranging markets, they can generate many false signals.
Which timeframe is best for reversal trading?
This depends on your trading style. Long-term reversals can be spotted on daily or weekly charts using patterns like the Head and Shoulders. Day traders might look for divergence and candlestick patterns on 15-minute or 1-hour charts.
Can fundamentals also signal a market reversal?
Absolutely. A major economic news release or a shift in a central bank’s policy can be the catalyst for a significant, long-term trend reversal that technical signals will then reflect.


