

Let’s be honest. If you’re reading this, you’re probably on the hunt for the best indicator for swing trading. I get it. When I first started my journey with a forex trading broker, I spent countless hours searching for that one “magic” tool—the one indicator that would flash “buy” or “sell” and lead me straight to profit. The hard-learned truth? It doesn’t exist. The real secret, and what we’re going to dive into here, isn’t about finding a single indicator. It’s about learning how to build your own powerful, personalized system of indicators that work together. This guide will show you exactly how to do that, cutting through the noise and focusing on what truly works.
What Really Makes a Top Indicator for Swing Trading?
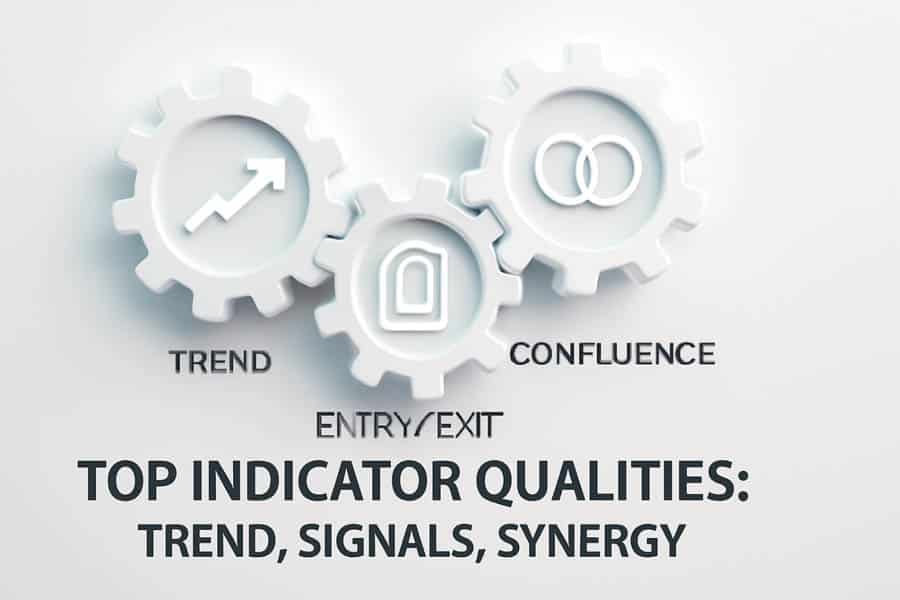
So, what separates a genuinely useful tool from all the other flashy indicators out there? For swing trading—where we aim to catch price moves over a few days or weeks—a top indicator for swing trading needs to do a few things exceptionally well. Think of it as building a team; each member needs to have a specific skill set. After years of testing, I’ve found that the best tools always deliver on three promises, providing the clarity you need to make confident decisions.
Can It Clearly Show Me the Trend?
First and foremost, swing trading is about riding the market’s wave. You want to be buying when the market is going up and selling when it’s heading down. It sounds simple, but short-term “noise” can make the true trend hard to see. A great indicator acts like a filter, smoothing out the erratic price jumps and showing you the underlying direction. Is the asset in a solid uptrend, or is it starting to roll over? This is the first question your indicator system must answer, and it has to be a clear “yes” or “no.”
Does It Give Clean Entry and Exit Signals?
Knowing the trend is great, but you also need to know when to jump in and when to get out. This is where many traders stumble. A top indicator for swing trading must provide clear, easy-to-read signals for entry and exit. It should help you spot the perfect moment to enter a trade as a new swing begins and, just as importantly, warn you when the momentum is fading so you can take your profits before the market turns against you.
Does It Play Well with Others?
I can’t stress this enough: no indicator works perfectly on its own. Each one has a blind spot. That’s why the best tools are team players. A solid strategy involves using a few different types of indicators that confirm each other. For example, I’ll use a trend indicator to get my bearings and then a momentum indicator to time my entry. When they both give me a green light, my confidence in the trade skyrockets. This “confluence” is what separates high-probability setups from guesswork.
My Favorite Trend Indicators for Swing Trading
The foundation of my swing trading strategy, and likely yours too, will always be identifying the trend. This is non-negotiable. Trend indicators are designed to do just this, helping you see the forest for the trees. They give you the bigger picture, so you don’t get shaken out by meaningless daily wiggles. Let’s look at the three trend indicators that I’ve come to rely on day in and day out. They are essential for anyone serious about finding the best indicator for swing trading setup.
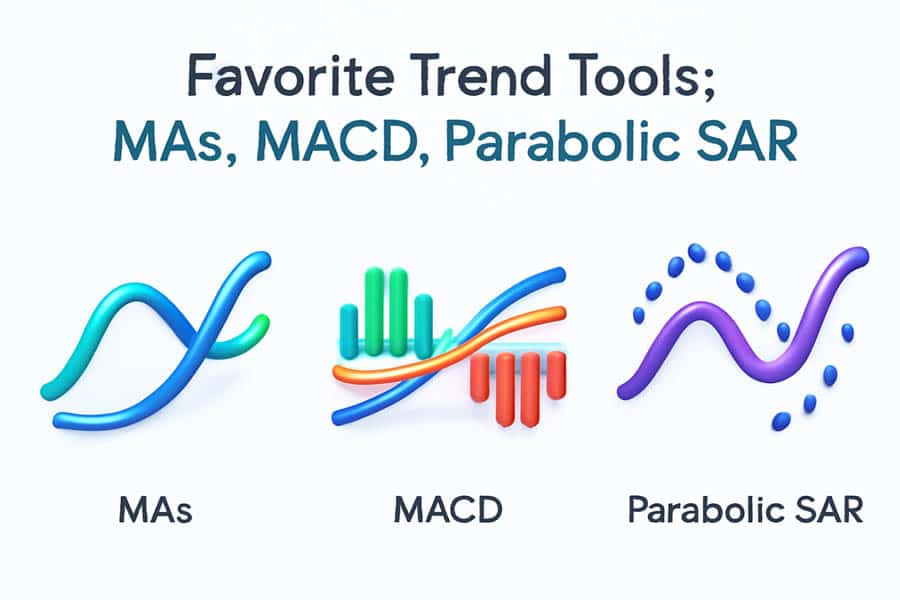
Moving Averages (EMA/SMA)
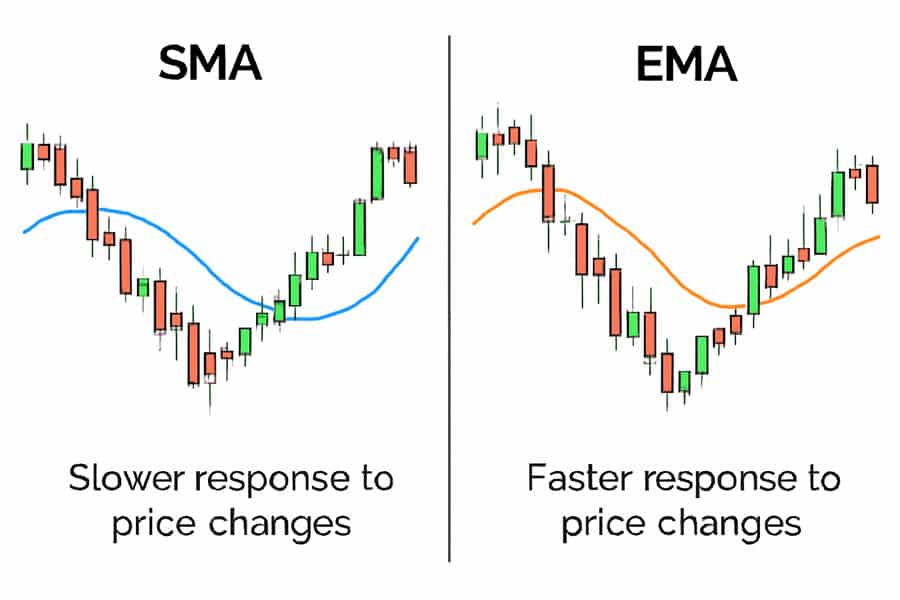
Moving Averages are the bedrock of trend analysis. They smooth out price data to create a single, clear line that shows you the trend’s direction.
- Simple Moving Average (SMA): This gives equal importance to all prices over a set period (e.g., 50 days). I find the 50-day and 200-day SMAs are fantastic for gauging the market’s long-term health.
- Exponential Moving Average (EMA): This gives more weight to the most recent prices, so it reacts faster. For my swing trades, I lean heavily on the 20-period and 50-period EMAs. The EMA’s responsiveness helps me catch shifts in the trend a little earlier.
My rule of thumb is simple: if the price is consistently staying above the 50 EMA, I’m only looking for opportunities to buy. If it’s below, I’m only thinking about selling. This one filter alone has saved me from countless bad trades. It’s a core component of finding your best indicator for swing trading.
MACD (Moving Average Convergence Divergence)
The MACD is my go-to for understanding trend momentum. It looks a bit complex with its two lines and a histogram, but the concept is straightforward. It measures the relationship between two moving averages.
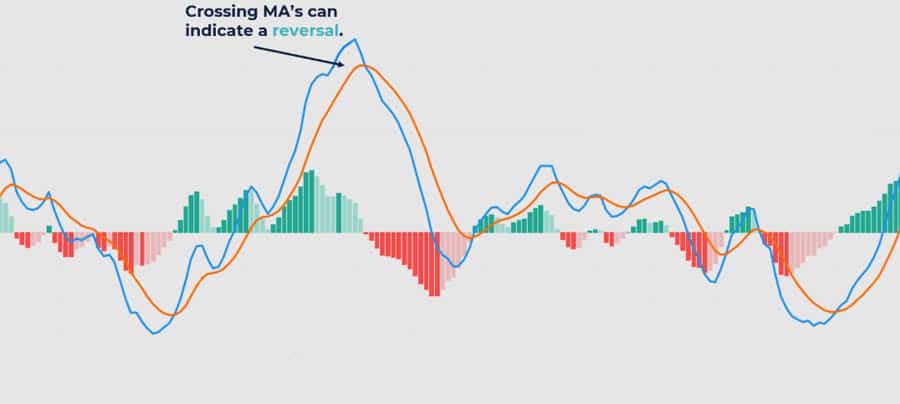
A MACD line crossing above its “signal” line is a classic buy signal, and a cross below is a sell signal. But what I find most valuable is the zero line. When the MACD line moves above the zero line, it confirms that the bulls are in control. When it drops below zero, the bears have taken over. The histogram is like a momentum gauge; when the bars start getting smaller, it’s a heads-up that the current trend is running out of steam.
Parabolic SAR
The Parabolic Stop and Reverse (SAR) is a unique tool I use for both trend identification and trade management. It places dots on your chart either above or below the price.
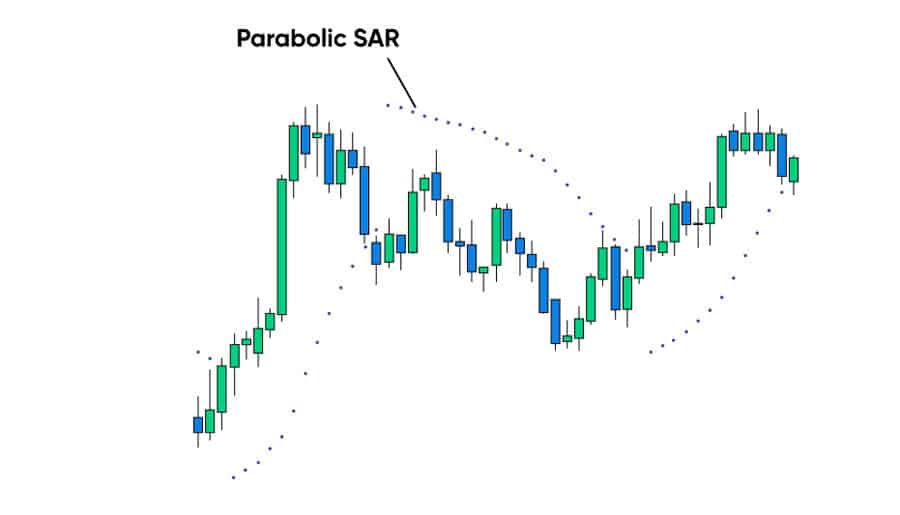
When the dots are below the price, the trend is up. When they flip to be above the price, the trend may be reversing to the downside. This “flip” is a great signal to watch for. My favorite use for the Parabolic SAR, however, is as a trailing stop. As a trend moves in my favor, the dot moves with it, providing a dynamic level to lock in profits. A word of caution from experience: this indicator shines in strong, trending markets but can give a lot of false signals when the market is moving sideways. Always use it with a confirming indicator.
Read More: Most Effective Forex Trading Indicators
The Best Momentum Indicators for Swing Trading
Once you know the trend, the next question is, “How strong is this move?” Momentum indicators answer this by measuring the speed and strength of price changes. Think of momentum as the force behind a punch; a trend with strong momentum is far more likely to continue. These indicators, often called oscillators, are your best friends for spotting “overbought” and “oversold” conditions, which are perfect for timing your entries and exits. Here are the tools I believe are the absolute best indicator for swing trading when it comes to momentum.
RSI (Relative Strength Index)
The RSI is one of the most popular momentum indicators, and for good reason. It oscillates between 0 and 100, telling you when a market might be overextended.
- Overbought/Oversold: Typically, a reading above 70 suggests the market is “overbought” and might be due for a pullback. A reading below 30 suggests it’s “oversold” and could be ready for a bounce.
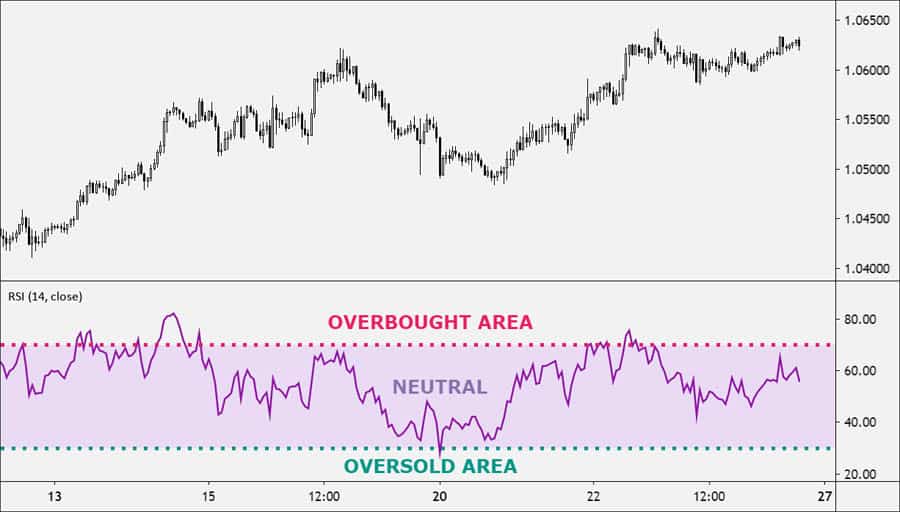
Here’s how I use it for swing trading: In a confirmed uptrend (price above the 50 EMA), I don’t sell just because the RSI hits 70. Instead, I wait for the price to pull back and the RSI to dip towards the 30-40 level. This “buy the dip” signal within a larger uptrend is one of the highest-probability setups you can find. This makes it a contender for the top indicator for swing trading.
Stochastic Oscillator
The Stochastic Oscillator is another tool for identifying overbought and oversold levels, but it’s a bit more sensitive than the RSI. It compares a security’s closing price to its price range over a period.
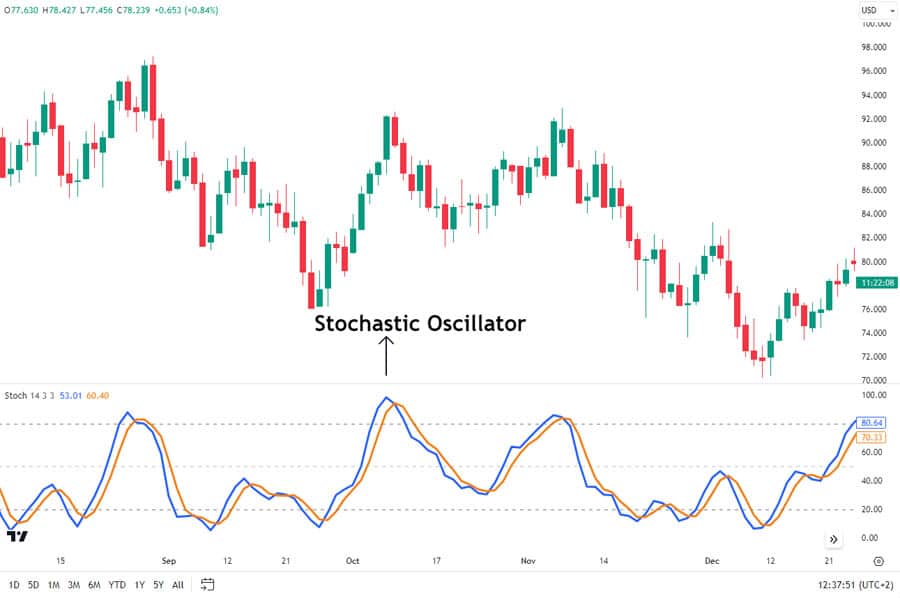
I watch for the two lines (%K and %D) to cross in the extreme zones. A bullish signal for me is when the lines cross each other while in the “oversold” area (below 20). A bearish signal is a cross in the “overbought” area (above 80). I’ve found that waiting for this crossover gives a much more reliable signal than just acting when the price enters the zone. It’s a subtle but crucial difference.
Bollinger Bands
I like to think of Bollinger Bands as a volatility channel. They consist of a middle moving average and two outer bands that expand when volatility is high and contract when it’s low.
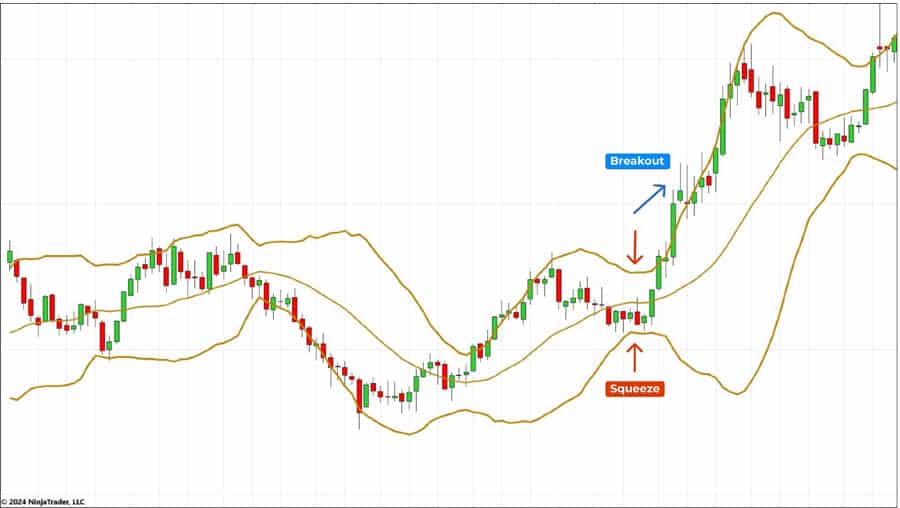
The “Bollinger Squeeze,” where the bands get very narrow, is a fantastic signal that a big move is coming. But my favorite swing trading strategy with them is the “Bollinger Bounce.” In a solid uptrend, if the price pulls back and touches the lower band, it often acts like a trampoline, bouncing the price back up. This gives a beautiful, visual entry point that aligns perfectly with the strategy of buying dips in an uptrend.
Using Volume to Confirm Your Swing Trades
If price and momentum are the car, volume is the fuel in the tank. A price move on low volume is suspicious; it lacks conviction. A move on high volume shows that big players are behind it. From my experience, adding volume analysis was the final piece of the puzzle that dramatically improved my trading. It’s the ultimate confirmation tool. Any discussion about the best indicator for swing trading is incomplete without covering volume.
On-Balance Volume (OBV)
OBV is a beautifully simple concept: it’s a running total of volume. On days the price closes up, the day’s volume is added to the total. On down days, it’s subtracted.
I don’t care about the actual number on the OBV line; I only care about its direction. I want to see the OBV moving in the same direction as the price. If the price is making a new high, but the OBV isn’t, that’s a huge red flag for me. It’s a divergence that screams, “This move is weak!” Conversely, when a price breakout is confirmed by a breakout in the OBV, I have much more confidence to jump on board.
Read More: Weekly Swing Trading
Volume Profile
Volume Profile is a more advanced tool that has become indispensable to my trading. Instead of showing volume over time, it shows you how much volume was traded at specific price levels. This creates a horizontal map of support and resistance.
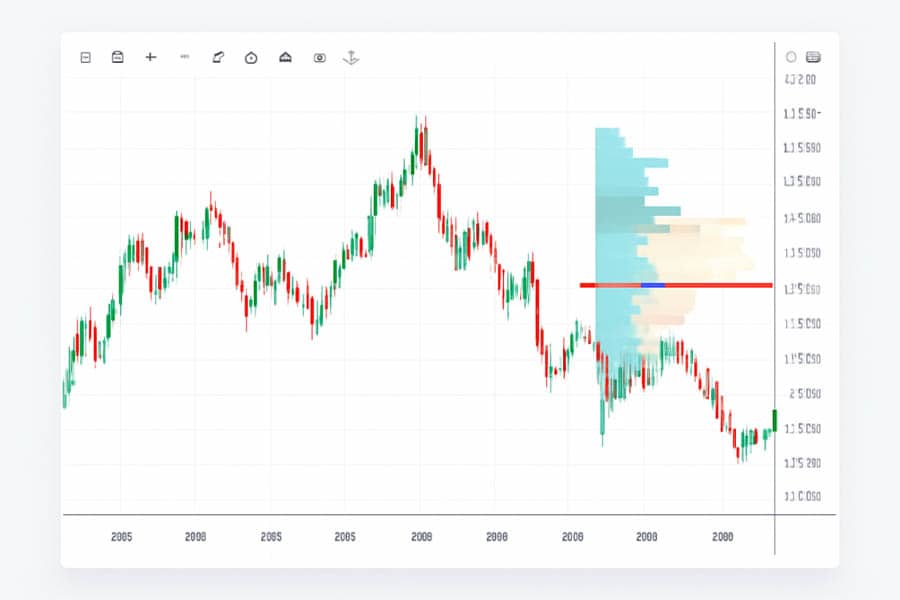
The level with the most volume is called the “Point of Control” (POC). These high-volume areas act like price magnets and powerful support/resistance zones. If I get a buy signal from my RSI right on top of a high-volume zone from the Volume Profile, that’s an A+ setup. It tells me I’m entering at a level where a major battle was fought and the buyers won.
My Winning Swing Trading Indicator Strategy
Okay, let’s put it all together. A strategy isn’t about having tools; it’s about having a clear process. This is my simple, 3-step checklist that I run through before every single swing trade. It’s my personal system for finding the best indicator for swing trading setups, and it keeps me disciplined and focused.
Step 1: Trend Confirmation (The 50 EMA)
First things first: what is the trend? I don’t even think about placing a trade until this is answered.
- My Rule: Is the price on the daily chart clearly above the 50-period EMA? If yes, I’m only allowed to look for buy signals. Is it clearly below? I’m only looking to sell. If it’s chopping sideways through the EMA, I close my charts and go for a walk. There’s no trade there.
Step 2: Entry Signal (The RSI)
Now that I know the direction, I need my entry point. I’m looking for a discount.
- My Signal: In an uptrend (price above 50 EMA), I patiently wait for the price to pull back, causing the RSI (set to 14 periods) to dip below the 40 level. The entry triggers when the RSI starts to hook back up, showing that buyers are stepping back in and momentum is returning to the trend’s direction.
Step 3: Volume Validation (The OBV)
This is my final checkpoint. Is the move legitimate?
- My Confirmation: As the price and RSI move to give me an entry signal, I glance at the On-Balance Volume (OBV). I need to see the OBV line holding steady or, ideally, ticking upwards. This confirms that real volume is supporting the new push higher. If the OBV is falling while the price is trying to rise, I pass on the trade. It’s a trap.
Read More: Price action swing trading strategy
Common Mistakes I Made with Swing Trading Indicators
I’ve made every mistake in the book. Learning to use indicators effectively also means learning what not to do. Avoiding these common traps is just as important as your entry strategy. This is where experience really pays off, and I hope sharing my past blunders helps you sidestep them.
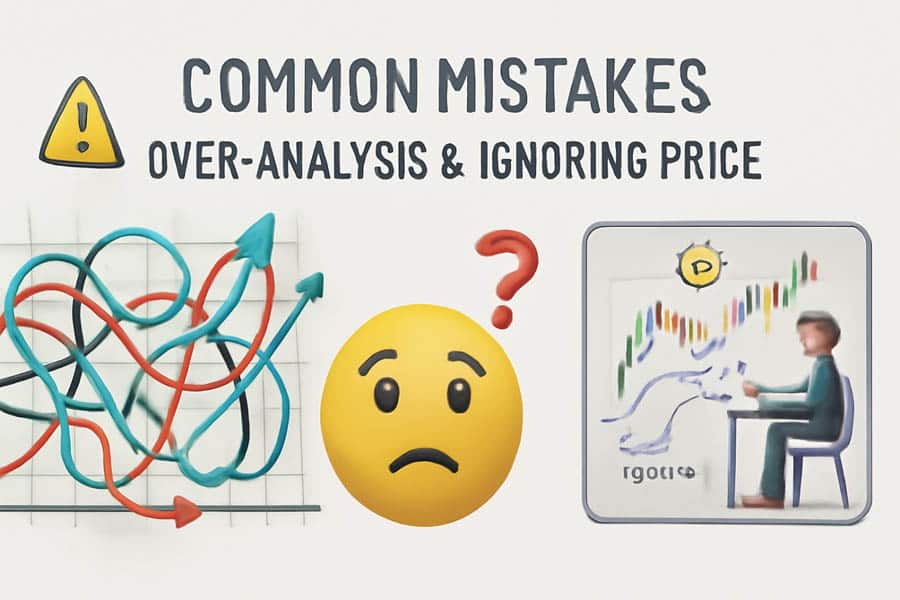
Analysis Paralysis from Using Too Many Indicators
When I started, I thought more indicators meant more confirmation. My charts were a mess of lines and colors. The result? I was always frozen with indecision. One indicator would say “buy” while another screamed “sell.” The hard lesson was this: less is more. Stick to a clean chart with one indicator for trend, one for momentum, and one for volume. That’s all you need. The search for the best indicator for swing trading shouldn’t turn your screen into abstract art.
Forgetting to Look at the Actual Price
It sounds silly, but you can get so focused on your indicators that you stop watching what the price itself is doing. Indicators are just a reflection of price. The raw price action—the candles, the highs and lows—is the ultimate truth. A bearish RSI divergence is powerful, but if it happens right at a major historical support level, you have to respect the price level first. Always start with the chart, then look to your indicators for confirmation.
Taking a Trade with Only One Reason
This was my costliest mistake. I’d see a MACD crossover and jump into a trade, only to have it immediately reverse. A single signal is not a strategy. Today, I don’t enter a trade unless I have at least three, non-correlated reasons. For example: 1) The price is above the 50 EMA. 2) The RSI has bounced from an oversold level. 3) The setup is occurring at a Volume Profile support zone. This layering of evidence is what creates high-conviction trades.
Conclusion
So, after all this, what is the best indicator for swing trading? It’s the one you build yourself. It’s a personalized system, not a single tool you download. The top indicator for swing trading is a combination of a few reliable tools that cover trend, momentum, and volume. By combining the insights from Moving Averages, the RSI, and volume analysis, you create a robust strategy that gives you multiple reasons for every trade you take. Forget the hunt for a magic bullet. Instead, focus on mastering a few key indicators and learning how they work together. That is the true path to trading with confidence and consistency.
Key Takeaways
- Stop a “Magic” Tool: Your success will come from combining a few indicators into a personal system.
- The Power Trio: A solid strategy must include indicators for trend (like EMAs), momentum (like the RSI), and volume (like the OBV).
- Look for Agreement: Only take trades when multiple, different indicators are all telling you the same story. This is called confluence.
- Price is King: Indicators only confirm what price is doing. Always analyze the price chart first.
- Keep It Clean: Don’t clutter your charts. Two to four well-chosen indicators are far better than ten.
- Test Everything: Before you risk a single dollar, backtest your indicator strategy to make sure it actually works.
Opofinance Services
To effectively apply these strategies, you need a broker that provides the right tools and a secure trading environment. Opofinance, a broker regulated by ASIC, is built to support traders on their journey to success.
- Advanced Trading Platforms: Choose from the best platforms in the business, including MT4, MT5, and cTrader. Opofinance also provides its own modern OpoTrade platform for a seamless experience.
- Innovative AI Tools: Get an analytical advantage with powerful AI tools. The AI Market Analyzer, AI Coach, and AI Support systems are there to help you analyze markets and refine your approach.
- Social & Prop Trading: Learn from others with Social Trading or prove your skills and trade larger capital through their Prop Trading program.
- Secure & Flexible Transactions: Fund your account with ease and security. Opofinance offers a range of payment methods, including cryptocurrencies, with the added benefit of zero fees on deposits and withdrawals from their side.
Ready to trade with a broker that supports your strategy?
What is the most accurate indicator for trading?
No single indicator is 100% accurate. Accuracy comes from using several indicators together for confirmation. However, many traders find that trend-following indicators like Moving Averages combined with a momentum oscillator like the RSI provide a very reliable foundation for a trading strategy.
How many indicators should a swing trader use?
A common and effective approach is to use 2 to 4 indicators. A good combination includes one for trend (e.g., 50 EMA), one for momentum/entry (e.g., RSI or Stochastic), and one for volume confirmation (e.g., OBV). This provides a complete picture without causing “analysis paralysis.”
Can you swing trade with just price action?
Yes, absolutely. Many successful “pure” price action traders use no indicators at all. They rely solely on analyzing candlestick patterns, support and resistance levels, and chart patterns. However, for most beginner to intermediate traders, indicators provide valuable, objective confirmation of what price action is suggesting.


