Are you striving to enhance your trading strategy with reliable indicators? The Parabolic SAR (Stop and Reverse) is a powerful tool favored by traders for its ability to identify potential trend reversals and set dynamic stop-loss points. But how can you maximize its effectiveness? This article explores the best indicator to use with Parabolic SAR, ensuring you leverage its strengths while mitigating its weaknesses. Whether you’re a seasoned trader or just starting, integrating the right indicators can significantly boost your trading performance. Additionally, partnering with a regulated forex broker like Opofinance ensures you trade in a secure and efficient environment, enhancing your overall trading experience.

Limitations of Using Parabolic SAR Alone
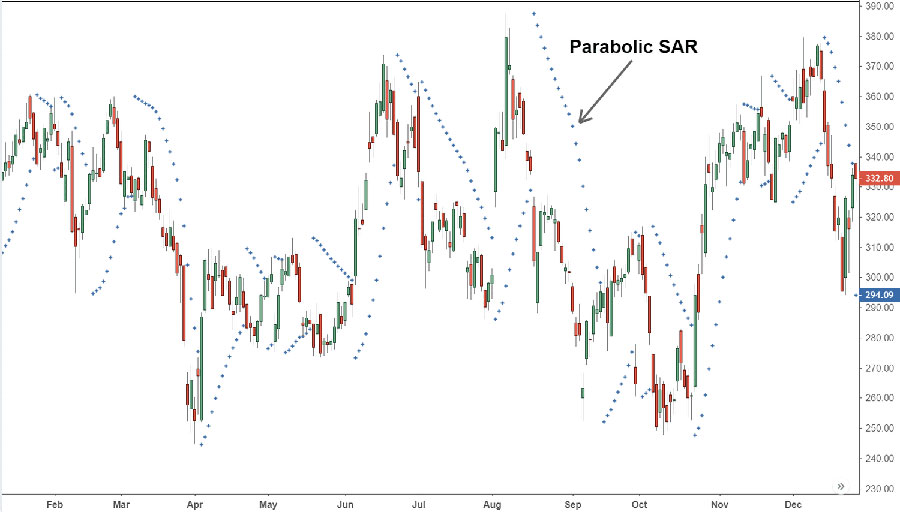
While the Parabolic SAR excels in highlighting trends and potential reversals, it isn’t without its flaws. In choppy or sideways markets, the indicator can generate false signals, leading to premature entries or exits. This volatility can result in missed opportunities or unnecessary losses, especially when the market lacks a clear direction. Therefore, relying solely on Parabolic SAR may not provide the accuracy and reliability needed for consistent trading success. To overcome these challenges, it’s crucial to confirm Parabolic SAR signals with other complementary indicators, enhancing the overall precision of your trading decisions.
Common Mistakes to Avoid
- Ignoring Market Conditions: Using Parabolic SAR in unsuitable market conditions like sideways trends can lead to false signals.
- Overreliance on Single Indicators: Relying solely on Parabolic SAR without confirmation can increase the risk of losses.
- Improper Stop-Loss Placement: Setting stop-loss levels too tight may result in frequent stop-outs.
Best Indicators to Combine with Parabolic SAR

Enhancing the effectiveness of Parabolic SAR involves pairing it with other robust indicators. Here are some of the best indicators to use with Parabolic SAR:
1. Moving Averages (MA)
Moving Averages (MA) are fundamental tools that smooth out price action, providing a clear view of the trend direction. They help in filtering out the market noise, making it easier to identify the underlying trend.
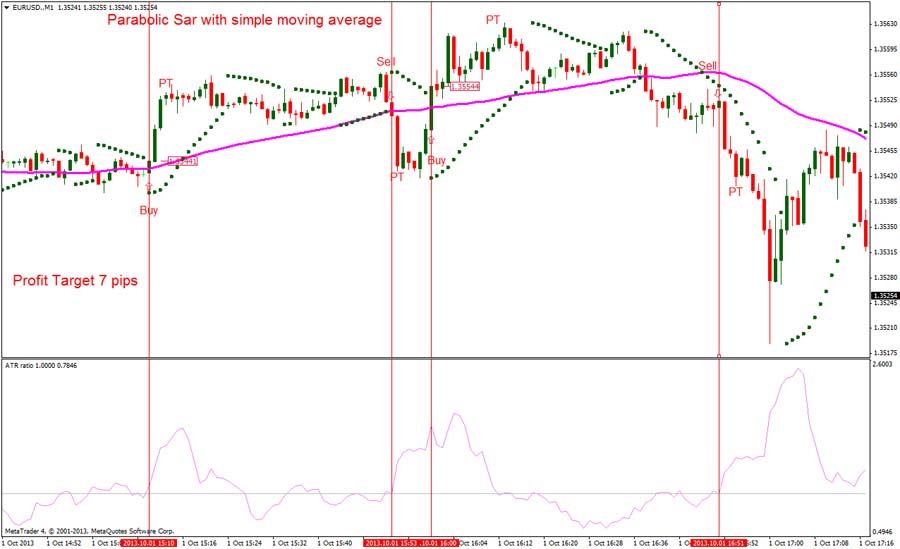
- How It Works: By averaging past prices over a specific period, MAs help confirm the trend’s direction. Common types include Simple Moving Averages (SMA) and Exponential Moving Averages (EMA).
- Example Strategy: When the Parabolic SAR signals a bullish trend (dots below the price), confirm with the 20-period MA crossing above the 40-period MA. This dual confirmation ensures that both indicators agree on the trend direction, helping you avoid premature entries and increasing the likelihood of successful trades.
- Practical Tip: Use different periods for MAs to suit your trading style. Shorter periods (e.g., 10-day MA) react faster to price changes, while longer periods (e.g., 50-day MA) provide a smoother trend indication.
Step-by-Step Implementation:
- Set Up Moving Averages:
- Add a 20-period MA and a 40-period MA to your chart.
- Identify MA Crossover:
- Look for the 20-period MA crossing above the 40-period MA for bullish signals.
- Confirm with Parabolic SAR:
- Ensure that the Parabolic SAR dots are below the price to validate the bullish trend.
- Execute Trade:
- Enter a long position when both conditions are met.
- Set Stop-Loss:
- Use the Parabolic SAR as a dynamic stop-loss point.
2. Relative Strength Index (RSI)
Relative Strength Index (RSI) is a momentum oscillator that measures the speed and change of price movements, indicating overbought or oversold conditions.
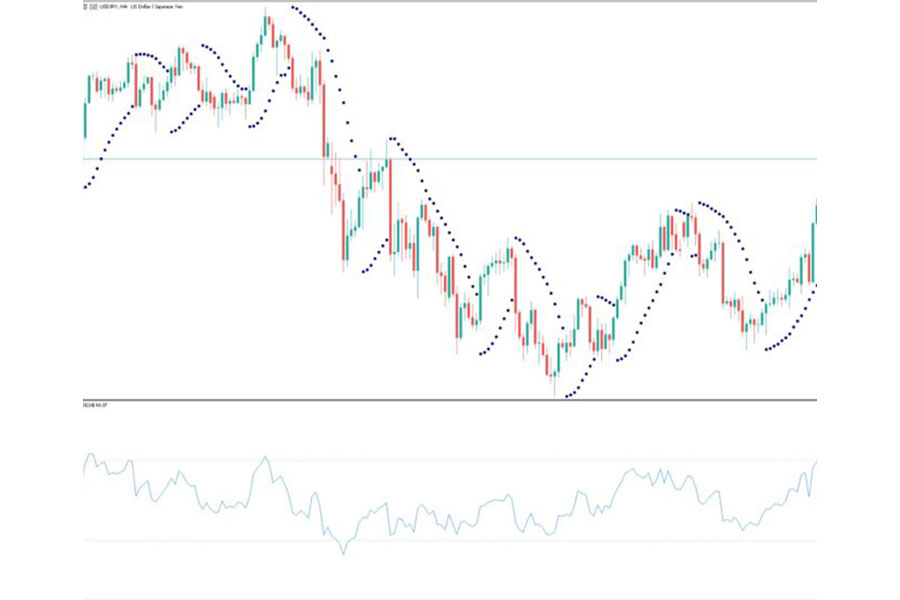
- How It Works: RSI oscillates between 0 and 100. Typically, an RSI above 70 indicates overbought conditions, while below 30 suggests oversold conditions.
- Example Strategy: Enter a long position when the Parabolic SAR flips below the price and the RSI is above 50, signaling bullish momentum. This combination reduces the likelihood of false signals by ensuring that the market momentum supports the trend indicated by Parabolic SAR.
- Practical Tip: Adjust the RSI period based on your trading timeframe. A 14-period RSI is standard, but shorter periods can make it more sensitive, while longer periods can smooth out the signals.
Step-by-Step Implementation:
- Add RSI to Your Chart:
- Set the RSI period to 14.
- Monitor RSI Levels:
- Identify when RSI is above 50 for bullish momentum.
- Confirm with Parabolic SAR:
- Ensure that the Parabolic SAR dots are below the price.
- Execute Trade:
- Enter a long position when both RSI > 50 and Parabolic SAR signals bullish trend.
- Set Stop-Loss:
- Utilize Parabolic SAR as the dynamic stop-loss.
3. Average Directional Index (ADX)
Average Directional Index (ADX) measures the strength of a trend, helping to determine whether the market is trending or ranging.
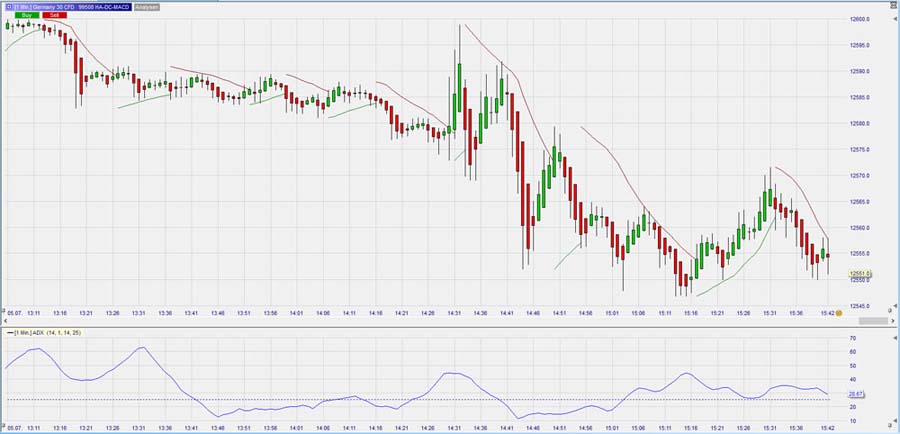
- How It Works: ADX values range from 0 to 100. Values above 25 typically indicate a strong trend, while values below suggest a weak or non-trending market.
- Example Strategy: Only act on Parabolic SAR signals when the ADX is above 25, ensuring that you’re trading in a strong, established trend. This filter helps avoid taking trades in low-trend or sideways markets where Parabolic SAR may generate false signals.
- Practical Tip: Combine ADX with the DI+ and DI- lines to get a clearer picture of the trend direction and strength.
Step-by-Step Implementation:
- Add ADX to Your Chart:
- Set ADX to a 14-period.
- Assess Trend Strength:
- Identify ADX values above 25 indicating a strong trend.
- Confirm with Parabolic SAR:
- Check if Parabolic SAR signals align with the trend strength.
- Execute Trade:
- Enter trades only when both ADX > 25 and Parabolic SAR indicates trend reversal.
- Set Stop-Loss:
- Use ADX levels or Parabolic SAR as dynamic stop-loss points.
4. MACD (Moving Average Convergence Divergence)
MACD is a versatile indicator that combines trend and momentum analysis, making it ideal for confirming trend direction and momentum shifts.
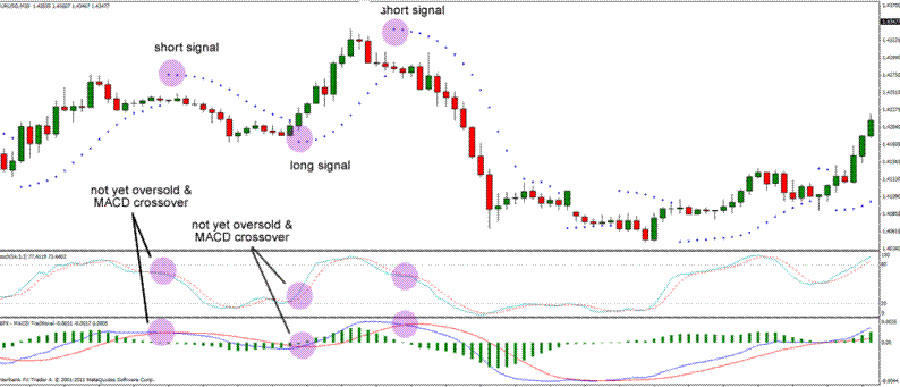
- How It Works: MACD consists of the MACD line, signal line, and histogram. The interaction between these components helps identify bullish or bearish momentum shifts.
- Example Strategy: Enter trades when both the Parabolic SAR and MACD histogram align in the same trend direction, providing a robust confirmation for your trade entries. For instance, a bullish Parabolic SAR signal accompanied by a positive MACD histogram strengthens the buy signal.
- Practical Tip: Pay attention to MACD crossovers and divergences as additional confirmation signals alongside Parabolic SAR.
Step-by-Step Implementation:
- Add MACD to Your Chart:
- Use default settings (12, 26, 9).
- Identify MACD Alignment:
- Look for MACD histogram positivity for bullish signals.
- Confirm with Parabolic SAR:
- Ensure that Parabolic SAR dots are below the price.
- Execute Trade:
- Enter a long position when both MACD and Parabolic SAR indicate bullish momentum.
- Set Stop-Loss:
- Utilize MACD crossovers or Parabolic SAR as dynamic stop-loss points.
Trading Strategy Examples
Implementing combined indicators can significantly enhance your trading strategy. Here are a few practical trading strategies incorporating Parabolic SAR and other indicators:
1. Parabolic SAR and Moving Averages Strategy
- Strategy:Wait for the moving averages to cross in alignment with a Parabolic SAR flip before entering a trade.
- Entry Signal: When the Parabolic SAR flips below the price (bullish signal) and the 20-period MA crosses above the 40-period MA.
- Exit Signal: When the Parabolic SAR flips above the price or the moving averages cross in the opposite direction.
- Benefit: This strategy ensures that both trend direction and momentum are in agreement, increasing the likelihood of a successful trade. It filters out false signals by requiring confirmation from the moving averages.
Example Scenario:
- Market Observation:
- The 20-period MA crosses above the 40-period MA on the daily chart.
- Parabolic SAR Confirmation:
- Parabolic SAR dots shift below the price, indicating a bullish reversal.
- Trade Execution:
- Enter a long position based on both indicators aligning.
- Trade Management:
- Set stop-loss using the Parabolic SAR as it moves with the price.
- Exit Strategy:
- Exit when Parabolic SAR signals a bearish reversal or MAs cross downwards.
2. Parabolic SAR and ADX Strategy
- Strategy:Only take Parabolic SAR signals when ADX confirms a strong trend.
- Entry Signal: When the Parabolic SAR indicates a trend reversal and the ADX is above 25, confirming a strong trend.
- Exit Signal: When ADX drops below 20 or Parabolic SAR signals a reversal.
- Benefit: This approach filters out trades in low-trend markets, reducing the risk of false signals and enhancing trade reliability. It ensures that you are trading in environments where trends are more likely to sustain.
Example Scenario:
- Market Observation:
- ADX rises above 25, indicating a strengthening trend.
- Parabolic SAR Confirmation:
- Parabolic SAR flips below the price, signaling a potential bullish reversal.
- Trade Execution:
- Enter a long position with ADX confirming the trend’s strength.
- Trade Management:
- Use ADX and Parabolic SAR to adjust stop-loss levels dynamically.
- Exit Strategy:
- Exit when ADX falls below 20 or Parabolic SAR indicates a bearish reversal.
3. Parabolic SAR and RSI Strategy
- Strategy:Enter a long position when Parabolic SAR flips below the price and RSI is above 50.
- Entry Signal: Parabolic SAR indicates a bullish reversal and RSI confirms bullish momentum.
- Exit Signal: Parabolic SAR signals a bearish reversal or RSI moves into overbought territory.
- Benefit: Combining Parabolic SAR with RSI helps validate the strength of the trend, ensuring that momentum supports the trade direction.
Example Scenario:
- Market Observation:
- RSI rises above 50, indicating increasing bullish momentum.
- Parabolic SAR Confirmation:
- Parabolic SAR dots shift below the price, signaling a bullish reversal.
- Trade Execution:
- Enter a long position based on both indicators confirming bullish conditions.
- Trade Management:
- Monitor RSI for overbought conditions and adjust stop-loss using Parabolic SAR.
- Exit Strategy:
- Exit when Parabolic SAR signals a reversal or RSI exceeds 70, indicating overbought conditions.
Risk Management and Stop-Loss Setting

Effective risk management is paramount in trading. The Parabolic SAR serves as a dynamic stop-loss tool, adjusting with price movements to protect your capital. To further enhance your risk management:
- Combine with Fixed Stop-Loss Levels: Use fixed stop-loss levels based on moving averages or key support/resistance levels to prevent premature exits. For example, place a stop-loss below a recent swing low for long positions.
- Position Sizing: Determine the appropriate size for each trade to manage risk effectively and avoid significant losses. A common rule is to risk only 1-2% of your trading capital on any single trade.
- Diversify Your Portfolio: Spread your investments across different assets to mitigate risk and enhance potential returns. Diversification reduces the impact of a poor-performing asset on your overall portfolio.
- Use Trailing Stops: Implement trailing stops to lock in profits as the trade moves in your favor. This allows you to capitalize on strong trends while protecting your gains.
- Regularly Review and Adjust: Continuously monitor your trades and adjust your risk management strategies as needed based on market conditions and performance.
Advanced Risk Management Techniques
- Hedging: Use hedging strategies to protect against adverse price movements.
- Risk-Adjusted Position Sizing: Adjust your position sizes based on the volatility and risk of each trade.
- Mental Stop-Loss: Have a predetermined exit point based on analysis rather than relying solely on indicator signals.
Opofinance Services
Experience trading excellence with Opofinance, an ASIC regulated forex broker renowned for its reliable services and commitment to trader success. Harness the power of social trading with Opofinance’s advanced platforms, allowing you to mirror the strategies of top traders effortlessly. As a featured broker on the MT5 brokers list, Opofinance offers safe and convenient deposit and withdrawal methods, ensuring your funds are always secure and accessible. Whether you’re a beginner or an advanced trader, Opofinance provides the tools and support you need to implement sophisticated trading strategies effectively.

Why Choose Opofinance?
- Regulated and Trustworthy: Opofinance is regulated by ASIC, ensuring a secure trading environment.
- Advanced Trading Platforms: Access cutting-edge platforms like MT5 for seamless trading experiences.
- Social Trading Services: Engage with a community of traders and replicate successful strategies with ease.
- Secure Transactions: Enjoy safe and convenient deposit and withdrawal methods, giving you peace of mind.
- Comprehensive Support: Benefit from dedicated customer support and educational resources to enhance your trading skills.
Real-World Example:
John, an experienced trader, leveraged Opofinance’s social trading service to mirror a top trader’s strategy that effectively used Parabolic SAR with RSI. By doing so, he enhanced his trading accuracy and minimized risks, leading to consistent profitability.
Pro Tips for Advanced Traders

Elevate your trading game with these Pro Tips designed for advanced traders looking to optimize their strategies:
- Optimize Indicator Settings: Customize the settings of your combined indicators to match specific market conditions and your unique trading style. For example, adjust the Parabolic SAR acceleration factor or the RSI period to better fit the asset you’re trading.
- Diversify Indicators: Don’t rely on just two indicators. Combining three or more can provide a more comprehensive market analysis, offering multiple layers of confirmation for your trades.
- Backtest Strategies: Always backtest your strategies on historical data to evaluate their effectiveness before applying them in live trading. This helps identify potential weaknesses and optimize performance.
- Stay Informed: Keep abreast of market news and events that might impact your trading indicators and overall strategy. Economic indicators, geopolitical events, and market sentiment can all influence trading conditions.
- Maintain Discipline: Stick to your trading plan and avoid emotional trading. Consistency is key to long-term success.
- Use Multiple Timeframes: Analyze multiple timeframes to get a broader perspective of the market trends and make more informed trading decisions.
- Implement Risk-Reward Ratios: Ensure each trade has a favorable risk-reward ratio, such as 1:2 or higher, to maintain profitability over time.
- Monitor Market Volatility: Adjust your indicator settings based on current market volatility to enhance signal accuracy.
Conclusion
Combining the Parabolic SAR with other robust indicators like Moving Averages, RSI, ADX, and MACD significantly enhances your trading strategy. This synergy leverages the strengths of each indicator while mitigating their individual weaknesses, leading to more accurate and reliable trading signals. By integrating these indicators, you can filter out false signals, confirm trend strength, and improve overall trade precision. Always adapt your strategies to evolving market conditions and rigorously test your setups in demo environments to ensure their effectiveness. With the right combination of indicators and a solid risk management plan, you can achieve greater consistency and success in your trading endeavors.
Key Takeaways
- Parabolic SAR is excellent for identifying trends and reversals but may falter in sideways markets.
- Combining with indicators like MA, RSI, ADX, and MACD enhances signal accuracy and reliability.
- Risk management using dynamic and fixed stop-loss methods is crucial for protecting your capital.
- Opofinance offers a secure and advanced trading environment, perfect for implementing these strategies.
- Pro Tips: Optimize settings, diversify indicators, backtest strategies, and stay informed for advanced trading success.
- Practical Strategies: Utilize combined indicator strategies to filter out false signals and confirm trend strength.
- Continuous Improvement: Regularly review and adjust your strategies to adapt to changing market conditions.
How does Parabolic SAR differ from other trend indicators?
The Parabolic SAR specifically focuses on pinpointing potential stop and reverse points, making it distinct from other trend indicators that may emphasize different aspects like momentum or volatility. Unlike moving averages that smooth price data to identify trends, Parabolic SAR places dots above or below the price to indicate potential reversal points, providing clear entry and exit signals based on trend changes.
Can Parabolic SAR be used for all types of trading instruments?
Yes, Parabolic SAR can be applied to various trading instruments, including stocks, forex, commodities, and cryptocurrencies. However, its effectiveness may vary based on the market’s volatility and trend strength. In highly volatile or choppy markets, Parabolic SAR may generate more false signals, so combining it with other indicators is recommended to enhance accuracy across different asset classes.
What timeframe is best for using Parabolic SAR?
The best timeframe for using Parabolic SAR depends on your trading style. Shorter timeframes like 5-minute or 15-minute charts are suitable for day traders looking to capitalize on quick price movements. Medium timeframes, such as hourly charts, cater to swing traders seeking to capture medium-term trends. Longer timeframes like daily or weekly charts are better for position traders aiming to hold trades over extended periods. It’s essential to align the timeframe with your trading strategy and risk tolerance.
How can I adjust Parabolic SAR settings for different market conditions?
You can customize the Parabolic SAR settings by adjusting the acceleration factor and maximum step. In trending markets, increasing the acceleration factor can make the indicator more responsive to price changes, while in ranging markets, decreasing it can reduce false signals. Always backtest different settings to find the optimal configuration for specific market conditions.
Is it better to use Parabolic SAR on its own or with other indicators?
While the Parabolic SAR is a valuable tool for identifying trends and reversals, using it in conjunction with other indicators like Moving Averages, RSI, ADX, or MACD can significantly enhance its effectiveness. Combining indicators provides multiple layers of confirmation, reducing the likelihood of false signals and increasing the reliability of your trading decisions.


