

Imagine the frustration of missing out on profitable trades, constantly second-guessing your entry and exit points on the 1-hour chart. What if you could cut through the noise and identify high-probability setups with greater confidence? The Moving Average Convergence Divergence (MACD) indicator, when precisely calibrated, can transform your trading. Are you ready to discover the best MACD settings for the 1-hour chart and gain a significant advantage? This in-depth guide will explore the nuances of the MACD, revealing the optimal MACD settings for 1-hour trading and empowering you to make data-driven decisions. For traders seeking an edge, especially when working with a reliable forex broker, mastering the MACD on the 1-hour timeframe is invaluable. We will delve into the core components of the MACD and advanced strategies, ensuring you can confidently apply these insights to your trading.

MACD & Trading Importance

The Moving Average Convergence Divergence (MACD) stands as a cornerstone of technical analysis, offering traders a powerful lens through which to view market momentum. Developed decades ago, its enduring popularity stems from its ability to distill complex price action into clear, actionable signals.
MACD Overview
At its heart, the MACD is a momentum oscillator that visualizes the relationship between two exponential moving averages (EMAs) of an asset’s price. By tracking the convergence and divergence of these averages, it provides insights into the strength and direction of a trend.
Why Traders Use MACD
Traders are drawn to the MACD for its versatility and the clarity of the signals it generates. It excels at identifying trend direction, spotting potential reversals, and highlighting shifts in momentum, making it applicable across diverse markets and trading styles.
Optimizing MACD for Timeframes
While the default MACD settings offer a starting point, the unique characteristics of different timeframes necessitate adjustments. The 1-hour chart, favored by intraday and swing traders, demands settings that are responsive enough to capture short-term price movements without being overwhelmed by excessive noise. Optimizing the MACD for this specific timeframe is crucial for maximizing its accuracy and potential profitability.
Read More: 1-hour forex trading strategy
Understanding MACD Parts
To effectively harness the power of the MACD, a thorough understanding of its individual components is essential. Each element contributes unique information about the underlying market dynamics, working in concert to generate trading signals.
MACD Line, Signal Line, Histogram
The MACD comprises three key elements: the MACD line, the signal line, and the histogram. The MACD line represents the difference between two EMAs, typically the 12-period and 26-period EMAs. The signal line is a 9-period EMA of the MACD line. The histogram visually displays the difference between the MACD line and the signal line.
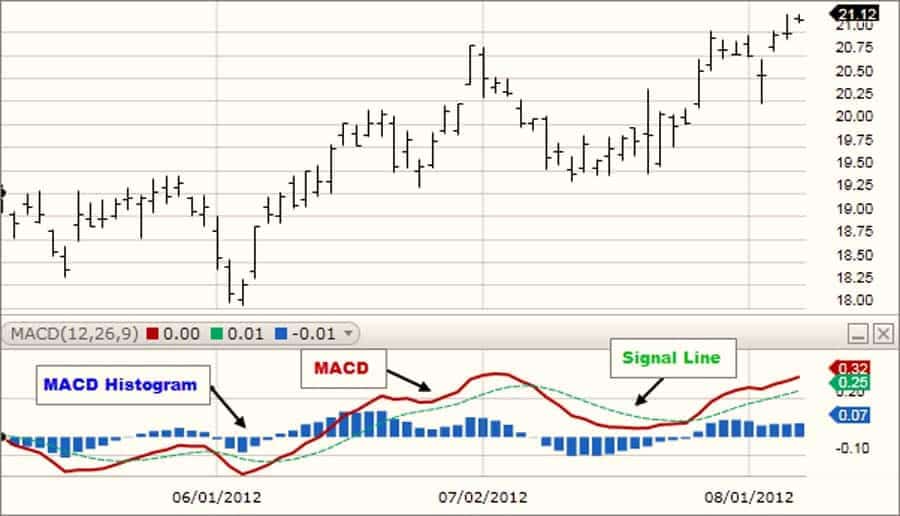
How MACD Components Signal
The interplay between these components forms the basis of MACD trading signals. Crossovers between the MACD line and the signal line are classic buy and sell signals. Divergence between the MACD and price action can foreshadow potential trend reversals. The histogram provides a visual cue for the strength of momentum and potential shifts in market sentiment.
Default MACD Settings: Limitations

The standard MACD settings of 12, 26, and 9 have served as the foundation for countless trading strategies. Understanding their origins and inherent limitations is a crucial step before exploring optimizations tailored for the 1-hour chart.
Standard Settings Explained
These default settings were initially designed for daily charts, aiming to capture medium-term trends. The 12 and 26 periods roughly correspond to two weeks and one month of trading data, respectively. The 9-period signal line provides a smoothed representation of the MACD’s movement, helping to identify potential entry and exit points.
Why Default Fails on 1H
The 1-hour chart presents a significantly faster-paced trading environment compared to the daily chart. The default settings, calibrated for longer-term trends, may react too slowly to the rapid price fluctuations characteristic of the 1-hour timeframe. This can lead to missed opportunities or delayed signals, highlighting the need for identifying the best macd settings for 1 hour trading.
Optimizing MACD for 1H Chart

Tailoring the MACD settings to the specific dynamics of the 1-hour chart can dramatically improve its responsiveness and accuracy, allowing traders to capitalize on shorter-term price movements with greater precision. This optimization process involves carefully adjusting the periods used to calculate the MACD line and the signal line.
Recommended 1H MACD Settings: A Deeper Dive
While the default settings can still be utilized, many traders find that adjusting the periods enhances performance on the 1-hour chart. A common starting point for optimization involves considering the relationship between the fast EMA, slow EMA, and signal line. The default ratio between these periods (approximately 1:2:0.75) can be maintained while adjusting the overall sensitivity. Doubling the default values to 24, 52, 18 is a popular adjustment. This approach essentially slows down the MACD slightly compared to the default, making it less susceptible to whipsaws and noise prevalent on the 1-hour chart. By using longer lookback periods for the EMAs, you’re focusing on more significant momentum shifts rather than minor price fluctuations. This can be particularly beneficial in moderately volatile markets. Conversely, some traders prefer to retain the default 12, 26, 9 settings for a quicker reaction to price changes. This makes the MACD more sensitive, potentially capturing more trading opportunities. However, this increased sensitivity comes with the trade-off of a higher likelihood of false signals, especially in choppy or highly volatile conditions. Traders using these faster settings often rely on additional filters or confirmation tools to mitigate the risk of acting on misleading signals. Beyond these common adjustments, other settings can be explored depending on your specific trading style and market conditions. For instance, settings like 9, 18, 6 can be used for even faster reactions, potentially suitable for scalping strategies on the 1-hour chart in very trending markets. Conversely, slightly longer settings like 15, 30, 10 might be preferred in less volatile environments to filter out more noise. The key is to understand how each setting affects the MACD’s behavior. Shorter EMA periods make the MACD more responsive to recent price changes, leading to faster signals but also more potential for false signals. Longer EMA periods smooth out the price action, resulting in slower but potentially more reliable signals. The signal line smoothing period also plays a crucial role. A shorter signal line period will make it more reactive to the MACD line, generating more frequent crossover signals, while a longer period will smooth it out, leading to fewer but potentially more significant crossovers.
Standard vs. Optimized Performance: Practical Considerations
Through rigorous backtesting, traders can objectively compare the performance of different MACD settings on historical 1-hour chart data. This involves analyzing how different settings would have performed in various market conditions, measuring metrics like the number of profitable trades, drawdown, and overall profitability. Optimized settings often demonstrate improved signal timing and reduced lag, potentially leading to more profitable trading outcomes by allowing for earlier entries and exits. However, it’s crucial to avoid the pitfall of overfitting, where settings are so precisely tuned to past data that they lose their effectiveness in live, dynamic market conditions. Overfitting can create a false sense of security based on historical performance that doesn’t translate to future profitability. Therefore, it’s essential to backtest across a sufficiently long period and across different market regimes (trending, ranging, volatile) to ensure the robustness of your chosen settings. Furthermore, forward testing on a demo account is crucial to validate backtesting results in a live market environment before risking real capital.
Read More: MACD Indicator in Forex Trading
Factors in Adjusting MACD
Selecting the most effective MACD settings for the 1-hour chart is not a universal solution. Several key factors influence the optimal parameters, requiring traders to consider the specific context of their trading.
Market Volatility & MACD
Market volatility plays a significant role in determining appropriate MACD settings. In periods of high volatility, shorter MACD periods (e.g., 9, 18, 6) may be more effective at capturing rapid price swings. Conversely, in less volatile market conditions, longer periods (e.g., 15, 30, 12) can help filter out insignificant price fluctuations and focus on more substantial trends.
Asset Class Differences
Different asset classes exhibit varying degrees of volatility and trading characteristics. Forex markets, known for their high liquidity and often rapid price movements, may benefit from slightly faster MACD settings compared to the potentially more stable price action observed in stock markets. Commodities can also display unique volatility profiles that should be considered when optimizing settings.
Impact of Trading Style
A trader’s individual trading style significantly influences the choice of MACD settings. Scalpers, who aim to profit from small price changes over very short timeframes, might favor the default or even faster MACD settings. Swing traders, who hold positions for several hours or days, may find the slightly adjusted settings (e.g., 24, 52, 18) more suitable. Intraday traders, operating within a single trading day, need to find a balance that aligns with their typical holding periods and profit targets.
Setting Up MACD on Platforms

Implementing your chosen MACD settings on your preferred trading platform is a straightforward process. Most platforms offer intuitive tools for customizing indicator parameters.
Adjusting MACD on MetaTrader 4/5
To adjust MACD settings on MetaTrader 4 or 5, navigate to the “Insert” menu, select “Indicators,” then “Oscillators,” and finally “MACD.” In the settings window that appears, you can modify the “Fast EMA,” “Slow EMA,” and “MACD SMA” (Signal Line) periods to your desired values. You can also customize the colors and styles of the lines and histogram for improved visual clarity. Click “OK” to apply the changes to your chart.
Customizing MACD on TradingView
Customizing the MACD on platforms like TradingView is equally simple. Open your TradingView chart and click on “Indicators” at the top of the screen. Search for “MACD” and select it to add it to your chart. To adjust the settings, hover over the MACD indicator on your chart and click on the “Settings/Format” icon (often represented by a cogwheel). This will open a window where you can modify the “Length” (for the EMAs), “Source,” “Signal Smoothing,” and “Histogram” settings. You can also customize the visual appearance of the lines and histogram. Click “OK” to save your customized settings.
Common 1H MACD Strategies
Once your MACD is configured with your preferred settings, you can employ a variety of established trading strategies to capitalize on the signals it generates. These strategies provide frameworks for identifying potential entry and exit points.
Understanding MACD Crossovers
MACD crossovers are among the most fundamental and widely used MACD trading signals. A bullish crossover occurs when the MACD line crosses above the signal line, suggesting increasing upward momentum and a potential buying opportunity. Conversely, a bearish crossover happens when the MACD line crosses below the signal line, indicating increasing downward momentum and a potential selling opportunity. These crossovers are often used as primary triggers for entering trades.
Spotting Reversals with Divergence
Divergence between the MACD and price action can be a powerful indicator of potential trend reversals. Bullish divergence occurs when the price makes lower lows, but the MACD makes higher lows, suggesting that the selling pressure is weakening and an upward reversal may be imminent. Bearish divergence occurs when the price makes higher highs, but the MACD makes lower highs, indicating that the buying pressure is waning and a downward reversal is possible. Divergence can provide early warnings of potential shifts in market direction.
Confirming Momentum with Histogram
Analyzing the MACD histogram provides valuable insights into the strength and momentum of a trend. Increasing positive histogram bars indicate strengthening bullish momentum, while increasing negative bars suggest growing bearish momentum. Conversely, decreasing histogram bars, even if they remain positive or negative, can signal weakening momentum and a potential loss of conviction in the current trend. Traders often use the histogram to confirm signals generated by MACD crossovers or divergence.
Read More: Best EMA Settings for 1 Hour Chart
Backtesting & Fine-Tuning MACD
Before deploying any MACD settings in live trading, rigorous backtesting is an indispensable step. This process allows you to evaluate the historical performance of your chosen settings and identify potential areas for refinement.
Why Backtest Historical Data
Backtesting involves applying your chosen MACD settings to historical price data to simulate how they would have performed in the past. This process helps you assess the effectiveness of your settings, identify potential strengths and weaknesses, and gain confidence in their ability to generate profitable signals. Backtesting can reveal whether your settings are prone to generating excessive false signals or if they effectively capture profitable trading opportunities.
Forward Testing with Demo Accounts
Following backtesting, forward testing on a demo account is a crucial step before risking real capital. Demo accounts allow you to observe how your MACD settings perform in real-time market conditions without any financial risk. This helps validate the results obtained during backtesting and identify any unforeseen challenges or limitations that may arise in a live trading environment. Forward testing provides a valuable opportunity to fine-tune your approach and build confidence in your strategy.
Combining MACD with Other Tools
While the MACD is a powerful and versatile indicator on its own, combining it with other technical analysis tools can significantly enhance its accuracy and help filter out false signals, leading to more robust trading strategies.
Using RSI, MAs, and Volume
Combining the MACD with other indicators like the Relative Strength Index (RSI), moving averages, and volume can provide valuable confirmation for trading signals. For example, a bullish MACD crossover accompanied by an RSI reading above 50 can add confluence to the buy signal, suggesting stronger momentum. Similarly, confirming MACD signals with the direction of longer-term moving averages can improve the probability of successful trades. Increased trading volume during a MACD crossover can also add conviction to the signal, indicating stronger market participation.
MACD with Fibonacci & Bollinger Bands
The MACD can also be effectively combined with tools like Fibonacci retracement levels and Bollinger Bands to identify high-probability trading opportunities. Looking for MACD confirmations at key Fibonacci retracement levels can pinpoint potential entry points with a higher likelihood of success. For instance, a bullish MACD crossover occurring near a 61.8% Fibonacci retracement level can present a strong buying opportunity. Similarly, combining MACD signals with Bollinger Bands can help identify potential breakouts or reversals. A MACD crossover coinciding with a price move outside the Bollinger Bands can signal a strong trend continuation or a potential trend reversal, depending on the context.
Common MACD Mistakes
Even with carefully optimized settings, certain common mistakes can undermine the effectiveness of the MACD and lead to suboptimal trading outcomes. Awareness of these pitfalls is crucial for maximizing the indicator’s potential.
Over-Reliance on MACD
One of the most common mistakes traders make is relying solely on MACD signals without seeking confirmation from other technical analysis tools or considering the broader market context. Treating MACD signals in isolation can lead to an increased number of false positives and potentially losing trades. It’s essential to always seek confirmation from other indicators, price action analysis, or even fundamental factors before making trading decisions based on MACD signals.
Sensitive Settings in Volatile Markets
While faster MACD settings can be tempting for capturing short-term price movements, using overly sensitive settings in highly volatile market conditions can lead to a barrage of false signals. The increased price fluctuations in volatile markets can cause the MACD lines to cross frequently, generating numerous unreliable signals. Finding the right balance between sensitivity and reliability is crucial, and it often involves adjusting the settings based on the prevailing market volatility.
Opofinance Services
Looking for a reliable and regulated broker for forex trading? Consider Opofinance. They are committed to providing a secure and efficient trading environment.
- ASIC Regulated: Trade with confidence knowing Opofinance adheres to the stringent regulatory standards of the Australian Securities and Investments Commission (ASIC).
- Social Trading: Leverage the wisdom of the crowd with Opofinance’s social trading features. Follow and copy the trades of experienced traders to potentially enhance your own performance.
- MT5 Brokers List: Opofinance is officially featured on the prestigious MetaTrader 5 brokers list, offering access to a powerful and versatile trading platform.
- Safe and Convenient Deposits and Withdrawals: Enjoy peace of mind with secure and hassle-free deposit and withdrawal methods.

Ready to elevate your trading experience? Visit opofinance.com today to learn more!
Your Best 1H MACD
Ultimately, determining the best MACD settings for the 1-hour chart is a personalized endeavor, contingent upon your individual trading style, risk tolerance, and the specific characteristics of the markets you trade.
Key Points Recap
Throughout this guide, we have explored the fundamental components of the MACD, discussed the limitations of default settings on the 1-hour chart, and examined various optimized settings favored by experienced traders. We have also emphasized the importance of considering factors such as market volatility, asset class, and trading style when adjusting MACD parameters. Furthermore, we have delved into common MACD trading strategies, highlighted the necessity of backtesting and forward testing, and explored the benefits of combining the MACD with other technical indicators.
Experiment & Adapt Settings
The journey to discovering your ideal MACD settings is an ongoing process of experimentation and refinement. We encourage you to actively experiment with different MACD parameters, meticulously backtest your results on historical data, and adapt your approach based on your personal trading experiences and the ever-evolving dynamics of the market. Continuous learning and adaptation are key to unlocking the full potential of the MACD and achieving consistent success in your trading endeavors.
Conclusion
Mastering the MACD on the 1-hour chart is a journey that combines understanding its core principles with the art of tailoring its settings to your unique trading approach. By diligently experimenting with different parameters, rigorously backtesting your strategies, and strategically combining the MACD with other complementary indicators, you can unlock its full potential and gain a significant competitive edge in the dynamic world of trading. Remember that continuous learning, adaptation, and a disciplined approach are the cornerstones of long-term success in the markets.
Key Takeaways
The default MACD settings (12, 26, 9) may not be ideally suited for the faster-paced environment of the 1-hour chart. Consider adjusting your MACD settings to values like 24, 52, and 18 for potentially improved responsiveness on the 1-hour timeframe. Factors such as market volatility, the specific asset class you are trading, and your individual trading style should all influence your choice of MACD settings. Always prioritize backtesting and forward testing your chosen MACD settings before deploying them in live trading scenarios. Enhance the reliability of MACD signals by combining them with other technical indicators such as the RSI, moving averages, and volume analysis. Avoid the common pitfall of over-relying on the MACD in isolation and be mindful of the potential for false signals, especially in volatile market conditions.
Can I use the same MACD settings for all currency pairs on the 1-hour chart?
While certain settings might exhibit effectiveness across multiple currency pairs, it is generally advisable to backtest and potentially fine-tune MACD settings for individual currency pairs due to their inherent differences in volatility and trading characteristics.
How often should I re-evaluate my MACD settings for the 1-hour chart?
It is prudent to periodically review your MACD settings, particularly if you observe significant shifts in market volatility or if your trading style undergoes changes. A quarterly review or whenever you notice a substantial alteration in market behavior is a recommended practice.
Is it possible to be consistently profitable using only the MACD on the 1-hour chart?
While the MACD is a valuable and powerful tool, relying solely on any single indicator is generally not recommended for achieving consistent profitability in the long run. Integrating the MACD with other forms of analysis, such as price action interpretation and fundamental analysis, will significantly enhance your trading success and robustness.


