

Are you striving for consistent profitability in your daily trading endeavors? Imagine a scenario where you could confidently identify optimal trading opportunities, effectively sidestepping those frustrating false signals that often lead to losses. The Relative Strength Index (RSI) is a powerful momentum indicator, but using the wrong settings can be detrimental to your trading performance.
The default settings, while widely used, aren’t always the best fit for every timeframe, especially when analyzing daily charts. This article will reveal the best RSI settings for 1 day chart, providing you with a comprehensive guide to optimize your trading strategy and potentially boost your profitability. We’ll delve deep into how to tailor the RSI for daily charts, ensuring you’re capturing the most reliable signals and making informed decisions. If you’re looking to refine your daily trading approach, particularly with a reliable online forex broker, then you’ve come to the right place.
We’ll explore how to use the RSI effectively, ensuring you’re making informed decisions in your daily trading endeavors, and maximizing your potential for success. This guide will empower you to take control of your trading and make the RSI work for you.
Understanding RSI for Daily Charts
The Relative Strength Index (RSI) is a cornerstone of technical analysis, acting as a momentum oscillator that measures the speed and change of price movements. It’s an indispensable tool for traders, helping to identify overbought or oversold conditions in the market. Think of it as a speedometer for price action, showing you how quickly a price is moving up or down. Unlike shorter timeframes, daily charts provide a broader, more comprehensive view of market trends, making the RSI a crucial indicator for identifying potential reversals or continuations.
The key is to adapt your RSI settings to this longer timeframe, as what works on a 1-minute chart will almost certainly not work effectively on a 1-day chart. Understanding this fundamental difference is crucial for effective daily trading and maximizing your trading potential. This understanding forms the foundation for successful RSI application.
Read More: Best ema settings for 1 day chart
RSI as a Momentum Indicator
The RSI’s core function is to act as a momentum indicator, signaling when a price is potentially overextended in either direction. This helps traders anticipate potential pullbacks or continuations of trends. By understanding how the RSI works, you can better gauge the strength of a trend and make more informed trading decisions. The RSI helps you identify when a trend is losing steam or gaining strength, allowing you to time your entries and exits more effectively. It provides a valuable perspective on the underlying momentum of price movements.
Daily Time Frame Importance
Adapting RSI settings for daily time frames is crucial because daily charts capture longer-term trends, which require a different approach than shorter-term charts. The default settings, often optimized for shorter timeframes, can generate too many false signals on a daily chart, leading to confusion and potential losses. Therefore, adjusting the RSI parameters is essential for accurate analysis and for filtering out the noise that is inherent in shorter timeframes. This ensures that you are focusing on the more significant, longer-term trends that are relevant to daily trading. The daily timeframe provides a broader perspective, requiring a more nuanced approach to RSI settings.
RSI Calculation: A Detailed Look
Before we delve into the best RSI settings for 1 day chart, let’s take a more detailed look at how the RSI is calculated. This understanding will help you appreciate why adjustments are necessary for daily charts and how different parameters can affect the indicator’s behavior. The RSI formula compares average gains to average losses over a specific period, resulting in a value between 0 and 100. This value is then used to identify potential overbought or oversold conditions. A thorough understanding of the calculation is essential for effective application.
The RSI Formula Explained
The RSI is calculated using the following formula:
RSI = 100 – [100 / (1 + (Average Gain / Average Loss))
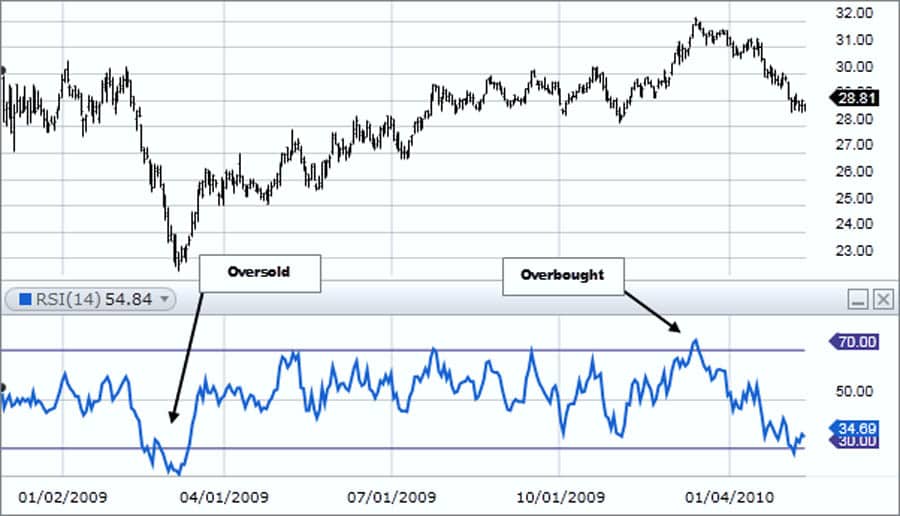
This calculation results in a value between 0 and 100. A reading above 70 typically indicates an overbought condition, suggesting that the price may be due for a pullback, while a reading below 30 suggests an oversold condition, indicating that the price may be due for a bounce. However, these levels are not set in stone, and the default 14-period RSI may not be the most effective for daily charts. The formula essentially measures the magnitude of recent price changes to evaluate overbought or oversold conditions, providing a numerical representation of momentum.
Why Default Settings May Fail on Daily Charts
The default 14-period RSI is often too sensitive for daily charts, leading to numerous false signals and whipsaws. This is because daily charts capture broader trends, and a shorter period RSI will react too quickly to minor price fluctuations, generating signals that are not aligned with the overall trend. Therefore, adjusting the period is crucial for filtering out noise and focusing on significant trends that are more relevant to daily trading. Using the default settings on a daily chart can lead to confusion, missed opportunities, and ultimately, losses. Understanding this limitation is key to optimizing your RSI settings.
Optimal RSI Parameters for 1-Day Trading
Now, let’s get to the core of the matter: the optimal RSI parameters for 1-day trading. The key is to find settings that balance sensitivity and reliability, providing clear signals without generating excessive false alarms. This involves adjusting the period length and the overbought/oversold thresholds to better suit the characteristics of daily charts. Finding the right balance is crucial for effective daily trading and for maximizing the potential of the RSI indicator.

Adjusting Period Length for Daily Charts
Consider increasing the period length to 21 or even 25. This will smooth out the RSI line, reducing the number of false signals and providing a clearer picture of the underlying trend. A longer period makes the RSI less reactive to short-term price fluctuations, which is beneficial for daily trading. This adjustment helps in focusing on the more significant, longer-term trends that are relevant to daily trading, and it reduces the impact of short-term noise on the indicator. The longer period provides a more stable and reliable signal for daily trading.
Refining Overbought/Oversold Thresholds
While 70/30 are the standard thresholds, you might find that 80/20 or even 75/25 work better for daily charts. These adjusted levels can help you avoid premature exits in strong trends and provide more reliable signals. These thresholds are not rigid and should be adjusted based on the specific market, the volatility of the asset, and your trading style. Experimentation is key to finding the thresholds that work best for you and your specific trading strategy. The right thresholds can significantly improve the accuracy of your RSI signals.
Balancing Sensitivity and Noise Reduction
The goal is to find a balance between sensitivity and noise reduction. A shorter period will be more sensitive but also more prone to false signals, while a longer period will be less sensitive but may miss some early opportunities. Experiment with different settings to find what works best for your trading style and the specific market you’re trading. This balance is crucial for effective daily trading and for ensuring that you are capturing the most reliable signals without being overwhelmed by noise. Finding this balance is a key aspect of mastering the RSI.
Read More: What is RSI Indicator
Combining RSI with Other Indicators for Daily Trading
The RSI is a powerful tool on its own, but it becomes even more effective when combined with other indicators. This helps to confirm signals, filter out false positives, and provide a more comprehensive view of the market. Let’s explore some effective combinations for daily trading that can enhance your trading strategy and improve your decision-making process.

RSI and Moving Averages for Trend Confirmation
Use a 50-day or 200-day Simple Moving Average (SMA) to confirm the overall trend. If the price is above the SMA and the RSI is showing an oversold condition, it could be a strong buy signal. Conversely, if the price is below the SMA and the RSI is overbought, it could be a sell signal. This combination provides a clearer picture of the trend and potential entry/exit points, helping you to align your trades with the prevailing market direction. The moving average acts as a filter, helping you to avoid trading against the trend and increasing the probability of successful trades.
RSI and Bollinger Bands for Volatility Analysis
Bollinger Bands can help you identify periods of high and low volatility. When the RSI reaches an overbought or oversold level and the price is near the upper or lower Bollinger Band, it can provide a more reliable signal. This combination can help filter out false signals, especially in volatile markets. The bands help in identifying potential breakouts or reversals, and they provide context for the RSI signals. This combination is particularly useful in volatile markets where the RSI alone may generate false signals, providing a more robust trading strategy.
Adjusting RSI Settings for Market Volatility
Market volatility can significantly impact the effectiveness of your RSI settings. It’s crucial to adapt your approach based on the current market conditions to ensure that your RSI signals remain reliable and effective. Here’s how to adjust your RSI settings for varying levels of volatility to optimize your trading strategy and maintain consistent performance.
Shortening Periods During High Volatility
When the market is highly volatile, consider shortening the RSI period to 9 or 11. This will make the RSI more sensitive to price changes, allowing you to capture short-term opportunities. However, be aware that this can also increase the risk of false signals. This adjustment is useful for capturing quick price movements during volatile periods, but it should be used with caution and in conjunction with other indicators to confirm the signals and reduce the risk of false positives. This approach allows you to adapt to changing market dynamics.
Raising Thresholds in Strong Trending Markets
In a strong uptrend, the RSI may remain in overbought territory for an extended period. To avoid premature exits, consider raising the overbought threshold to 80 or even 85. This will allow you to stay in the trade longer and potentially capture more profits. This adjustment helps in maximizing profits during strong trending markets and prevents you from exiting a trade too early due to a temporary overbought condition. It allows you to ride the trend for longer and capture more of the potential profit.
Dynamic Adjustment Guidance
Adapting your RSI settings dynamically based on changing market conditions is a crucial skill for any serious trader. Here’s a step-by-step guide on how to transition between different RSI settings in response to increased market volatility:
- Monitor Market Volatility: Keep a close eye on market volatility using indicators like the Average True Range (ATR) or by observing price action. Increased volatility is often characterized by larger price swings and wider trading ranges.
- Transition from 21 to 14-Period RSI: When you observe a significant increase in market volatility, consider transitioning from a 21-period RSI to a 14-period RSI. This will make the RSI more sensitive to price changes, allowing you to capture short-term opportunities.
- Adjust Thresholds Accordingly: When shortening the RSI period, you may also need to adjust your overbought/oversold thresholds. For example, you might consider using 75/25 thresholds instead of 80/20 to account for the increased sensitivity.
- Confirm with Other Indicators: Always confirm your RSI signals with other indicators, such as moving averages or Bollinger Bands, to reduce the risk of false signals.
- Revert to Original Settings: Once market volatility subsides, revert back to your original RSI settings (e.g., 21-period RSI with 80/20 thresholds) to maintain a balance between sensitivity and reliability.
By following these steps, you can dynamically adjust your RSI settings to adapt to changing market conditions and improve your trading performance.
Backtesting RSI Strategies on Daily Charts
Before implementing any new RSI settings, it’s crucial to backtest them on historical data. This will give you a better understanding of how the settings perform in different market conditions and help you to refine your trading strategy. Backtesting is an essential step in validating your trading approach and ensuring its effectiveness.

Analyzing Historical Testing Results
For example, you could compare the performance of RSI-14 versus RSI-21 on the S&P 500 over a specific period. Backtesting can reveal the strengths and weaknesses of different settings and help you fine-tune your strategy. This process helps in identifying the most effective settings for your specific trading style and the market you are trading. It also allows you to assess the risk and reward of different settings, providing valuable insights into their performance.
Learning from Case Studies with Custom Settings
Case studies have shown that customized RSI settings can significantly improve profitability compared to using default parameters. These studies highlight the importance of tailoring your settings to the specific market and timeframe you are trading. This is a crucial step in optimizing your trading strategy and maximizing your potential for success. Learning from these case studies can provide valuable insights into how to optimize your own RSI settings and improve your trading outcomes.
Common Mistakes to Avoid with Daily RSI Settings
Many traders make common mistakes when using the RSI on daily charts. Avoiding these pitfalls can significantly improve your trading performance and help you to avoid unnecessary losses. Let’s look at some common errors to avoid when using the RSI on daily charts to ensure you are using it effectively.
Avoiding Over-Reliance on Default Parameters
Don’t assume that the default 14-period RSI is the best setting for all markets and timeframes. Always experiment with different settings to find what works best for your specific needs. This is a common mistake that can lead to missed opportunities and losses. It’s important to understand that the default settings are not a one-size-fits-all solution and that customization is key to success.
Recognizing and Acting on Divergence Signals
Divergence occurs when the price makes a new high or low, but the RSI fails to do the same. This can be a powerful signal of a potential trend reversal. Ignoring divergence signals can lead to missed opportunities and potential losses. Recognizing divergence is a key skill for effective RSI trading and can help you to anticipate potential trend changes, allowing you to make more informed trading decisions.
Read More: Three Inside Up Candlestick Pattern
Advanced Techniques for Daily RSI Optimization
For advanced traders, there are several techniques to further optimize your RSI settings and enhance your trading strategy. These techniques can provide a more nuanced view of market momentum and improve the accuracy of your trading signals. Let’s explore some advanced techniques for optimizing your RSI settings and taking your trading to the next level.

Using Multiple RSI Periods for Enhanced Analysis
Consider using two RSI periods, such as 7 and 14, on the same chart. This can provide a more comprehensive view of momentum. When both RSI lines are in agreement, it can provide a stronger signal. This technique helps in identifying stronger and more reliable trading signals and provides a more complete picture of market momentum, allowing you to make more confident trading decisions.
Incorporating Volume-Weighted RSI for Accuracy
Volume-weighted RSI takes into account the volume of trading activity, which can provide a more accurate picture of market momentum. This can be particularly useful in volatile markets. This approach adds another layer of analysis, improving the accuracy of your trading decisions and providing a more reliable signal, especially in volatile market conditions. It helps to filter out false signals and provides a more robust view of market momentum.
Pro Tips
Here are some pro tips to help you get the most out of your RSI trading and to enhance your overall trading strategy:
- Don’t be afraid to experiment: The best RSI settings for 1 day chart are not universal. What works for one trader may not work for another. Experiment with different settings and find what works best for your trading style and the specific market you’re trading.
- Use a demo account: Before implementing any new RSI settings on a live account, test them on a demo account. This will allow you to see how the settings perform without risking real money.
- Keep a trading journal: Track your trades and the RSI settings you used. This will help you identify patterns and fine-tune your strategy over time.
- Combine RSI with other indicators: Don’t rely solely on the RSI. Use it in conjunction with other indicators like moving averages and Bollinger Bands for confirmation.
- Stay updated on market conditions: Market conditions can change, so it’s important to stay updated and adjust your RSI settings accordingly.
- Be patient and disciplined: Trading requires patience and discipline. Don’t get discouraged by losses, and stick to your trading plan.
Opofinance Services
- Opofinance is a reputable ASIC-regulated broker, ensuring a secure and transparent trading environment for all traders.
- Benefit from Opofinance’s social trading service, allowing you to learn from and copy the strategies of experienced traders, enhancing your trading knowledge and skills.
- Opofinance is officially featured on the MT5 brokers list, providing access to a powerful and versatile trading platform, equipped with advanced charting tools and features.
- Enjoy safe and convenient deposit and withdrawal methods, making your trading experience seamless and hassle-free.

Ready to elevate your trading? Click here to explore Opofinance and discover how our services can enhance your trading journey and help you achieve your financial goals.
Conclusion
Finding the best RSI settings for 1 day chart is not about finding a magic number, but rather about understanding how the RSI works and adapting it to your specific needs and trading style. By adjusting the period length, overbought/oversold thresholds, and combining the RSI with other indicators, you can significantly improve your trading results and increase your potential for profitability. Remember to backtest your strategies, avoid common mistakes, and continuously refine your approach. With the right approach and a solid understanding of the RSI, it can be a powerful tool in your daily trading arsenal, helping you to achieve your trading goals.
Key Takeaways
- The default 14-period RSI may not be optimal for daily charts and can lead to false signals.
- Consider increasing the RSI period to 21 or 25 for smoother signals and reduced noise.
- Adjust overbought/oversold thresholds to 80/20 or 75/25 for better trend clarity and to avoid premature exits.
- Combine the RSI with moving averages and Bollinger Bands for confirmation and to filter out false signals.
- Backtest your strategies on historical data before implementing them to ensure their effectiveness.
- Avoid over-reliance on default parameters and ignoring divergence signals, which can lead to missed opportunities.
- Experiment with multiple RSI periods and volume-weighted RSI for advanced analysis and to enhance your trading strategy.
- Dynamically adjust your RSI settings based on changing market conditions to maintain optimal performance.
- Use MT5 and other resources to backtest your strategies and validate their effectiveness.
Can I use the same RSI settings for all currency pairs on a daily chart?
While you can start with a base setting, it’s often beneficial to fine-tune your RSI parameters for each currency pair. Different pairs can exhibit varying levels of volatility and trend characteristics, which may require slightly different RSI settings for optimal performance. Experimentation and backtesting are key to finding the best fit for each pair and to maximizing your trading potential. Tailoring your settings to each pair can significantly improve your trading outcomes.
How often should I adjust my RSI settings on a daily chart?
You don’t need to constantly adjust your RSI settings. However, it’s wise to review them periodically, especially if there are significant changes in market conditions or volatility. If you notice that your current settings are no longer providing reliable signals, it might be time to tweak them. A good practice is to re-evaluate your settings every few months or after major market events to ensure that your settings remain effective and aligned with the current market dynamics.
Is it possible to use RSI alone for daily trading, or do I always need other indicators?
While the RSI can be a powerful tool on its own, it’s generally recommended to use it in conjunction with other indicators for confirmation. Relying solely on the RSI can lead to false signals and missed opportunities. Combining it with indicators like moving averages, Bollinger Bands, or volume analysis can provide a more comprehensive view of the market and improve the reliability of your trading signals, enhancing your overall trading strategy and increasing your chances of success. A multi-indicator approach is generally more robust and reliable.


