

Are you finding it challenging to identify high-probability trading setups on the fast-paced 15-minute chart? Do you experience frustration with whipsaws and premature signals hindering your intraday trading performance? Many traders navigating the intricacies of short-term trading encounter these hurdles. The Relative Strength Index (RSI) is a valuable tool for analyzing momentum, but its effectiveness is intrinsically linked to its configuration.
The optimal best rsi settings for 15 minute chart often necessitate a departure from standard parameters to effectively capture rapid price fluctuations. This article provides an in-depth exploration of optimizing your RSI for the 15-minute timeframe, examining various configurations and empowering you to refine your strategy for enhanced precision. Understanding the nuances of the best rsi settings for 15 min chart is paramount for traders seeking a competitive edge in this dynamic environment.
RSI Fundamentals for 15-Minute Analysis
Prior to delving into specific configurations, a firm understanding of the Relative Strength Index (RSI) and its application to short-term analysis is crucial. This widely used technical indicator, developed by J. Welles Wilder Jr., functions as a momentum oscillator. It quantifies the velocity and magnitude of recent price movements, providing insights into potential overbought or oversold conditions.
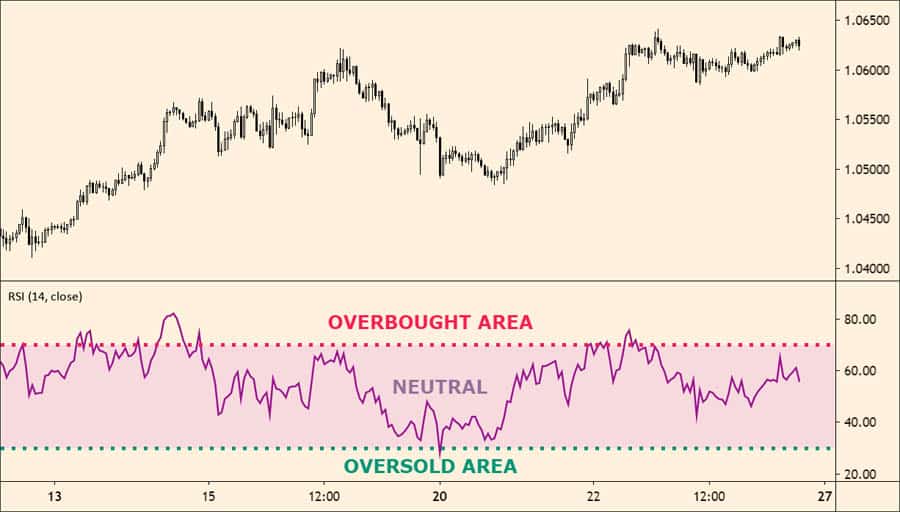
The RSI oscillates within a bounded range of 0 to 100. A reading exceeding 70 typically suggests an overbought state, potentially indicating an impending price correction. Conversely, a reading below 30 often signals an oversold condition, hinting at a possible price rebound. The standard RSI calculation involves comparing the average of upward price changes to the average of downward price changes over a defined lookback period, providing a smoothed representation of price momentum. Grasping these core principles is foundational for effectively applying the RSI to the demands of the 15-minute chart and identifying the best RSI settings for 15-Minute Trading.
Read More: Best 15 minute forex trading strategy
RSI Measurement and Range
The Relative Strength Index (RSI) is a momentum indicator used in technical analysis that measures the magnitude of recent price changes to evaluate overbought or oversold conditions in the price of a stock or other asset. It is displayed as an oscillator (a line graph that moves between two extremes) and can have a reading from 0 to 100.
- RSI quantifies momentum, velocity, and price change magnitude.
- Standard calculation compares average gains to average losses over a defined period.
- The RSI range is bounded between 0 and 100.
Interpreting Extremes: Overbought/Oversold
The conventional interpretation of the RSI involves identifying potential price extremes. These levels can suggest possible inflection points in price. However, on a 15-minute chart, these signals require careful consideration due to the inherent volatility of the timeframe. Identifying the Optimal RSI Settings for 15-Minute Charts involves understanding how these extremes manifest.
- RSI above 70 is typically considered overbought, suggesting potential downside pressure.
- RSI below 30 is typically considered oversold, suggesting potential upside pressure.
Default RSI (14-Period) Applicability on M15

The default RSI setting of 14 periods is a common starting point across various timeframes, aiming to balance responsiveness and signal smoothness. However, the 15-minute chart (M15) presents a unique set of challenges due to its accelerated price action. While the 14-period RSI provides a general indication of momentum, its inherent smoothing can introduce a degree of latency when applied to such a compressed timeframe.
This latency can potentially lead to missed entry opportunities or delayed exit signals, ultimately impacting profitability. Consider a rapid price surge – the 14-period RSI might only register overbought conditions after a significant portion of the move has already transpired. Therefore, while the 14-period RSI is not inherently ineffective, it may not represent the most agile configuration for capturing the transient opportunities characteristic of M15 trading. Traders seeking the best rsi settings for 15 min chart often explore alternative period lengths to mitigate this lag.
Read More: What is RSI Indicator
Rationale for 14-Period Calculation
The 14-period setting, popularized by J. Welles Wilder Jr., is often considered a benchmark for its ability to capture a reasonable amount of price data without excessive sensitivity to short-term fluctuations. This makes it a standard for many applications, but its suitability for the Best RSI Settings for 15-Minute Trading needs further examination.
Limitations in High-Frequency Trading
When applied to the high-frequency environment of a 15-minute chart, the 14-period RSI can exhibit limitations. The smoothing effect, while advantageous on longer timeframes, can result in delayed signals in the context of rapid intraday price movements. This is a key consideration when determining the RSI Settings for 15-Minute Scalping.
- Potential for signal lag in identifying short-term opportunities.
- Reduced responsiveness to swift price changes.
Shorter RSI Periods: Enhancing Responsiveness
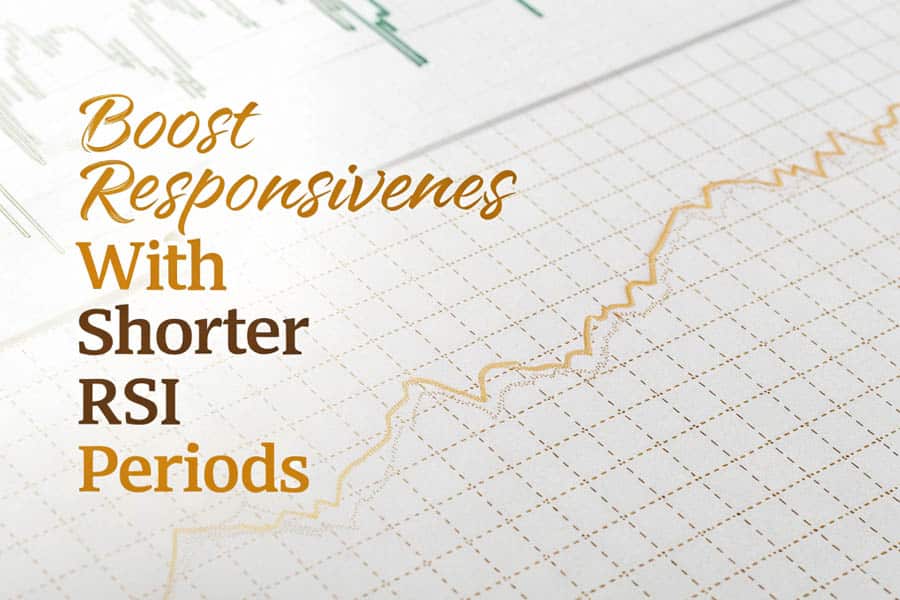
To address the potential latency associated with the 14-period RSI on the 15-minute chart, many active traders experiment with shorter lookback periods. Configurations such as 7, 9, or 10 periods can significantly enhance the indicator’s responsiveness to recent price action. Consider this as narrowing the observational window – a shorter lookback period places greater emphasis on immediate price changes.
This heightened responsiveness allows the RSI to react more swiftly to nascent trends and potential reversals, potentially providing earlier entry and exit signals. For instance, a 9-period RSI will incorporate price data from the preceding nine 15-minute bars, rendering it more sensitive to short-term fluctuations compared to a 14-period RSI. This can be particularly beneficial for scalpers aiming to capitalize on small price increments within compressed timeframes. However, it is crucial to acknowledge the inherent trade-off: increased responsiveness can also lead to a higher incidence of spurious signals or “noise.”
The RSI might oscillate more frequently above and below the overbought and oversold thresholds, necessitating careful interpretation and corroboration with other technical analysis methodologies. Identifying the best rsi settings for 15 min chart often involves finding an equilibrium between responsiveness and signal reliability.
Accelerated Signal Generation
Utilizing shorter RSI periods on a 15-minute chart can provide traders with accelerated signal generation, potentially enabling them to capitalize on quicker price movements that might be overlooked with a longer period. This is a core principle in determining the Best RSI Settings for 15-Minute Trading.
- Shorter periods (e.g., 7, 9, or 10) exhibit faster reaction times to price changes.
- Potential for capturing short-term trading opportunities.
Increased Susceptibility to Noise
The enhanced responsiveness of shorter RSI periods comes with a potential drawback: a heightened susceptibility to encountering false signals or “noise.” This necessitates traders to exercise prudence and seek confirmation from supplementary indicators or price action analysis when using RSI Settings for 15-Minute Scalping.
- Higher sensitivity can lead to more frequent, potentially misleading fluctuations.
- Elevated risk of false positive or negative signals.
Longer RSI Periods: Smoothing Volatility
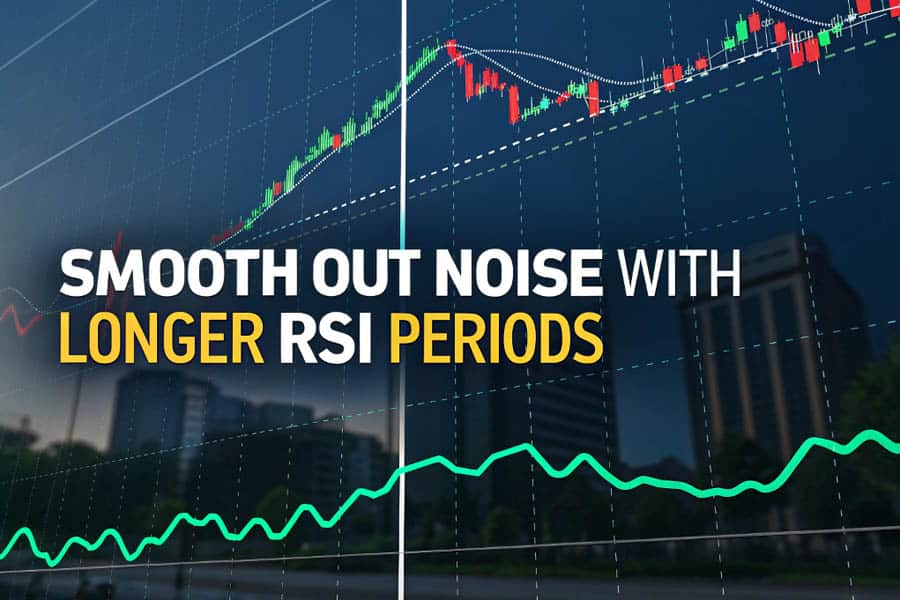
While shorter RSI periods offer enhanced responsiveness, they can also be prone to whipsaws and misleading signals, particularly in volatile or range-bound market conditions. To mitigate this “noise,” some traders prefer employing slightly longer RSI periods on the 15-minute chart, such as 20 or 25. These extended periods smooth out price data, yielding a more stable and less erratic RSI trajectory. This approach can be particularly advantageous for identifying more robust, sustained trends and filtering out transient price fluctuations that may be inconsequential to your trading strategy.
A 20-period RSI, for example, considers a larger sample of recent price action, rendering it less susceptible to abrupt, short-lived price spikes. The trade-off, however, is that you might forgo capturing some of the initial momentum of a price movement, as the RSI will react with a degree of delay. The decision between shorter and longer periods hinges on your individual trading methodology, risk appetite, and the prevailing market dynamics. Determining the Optimal RSI Settings for 15-Minute Charts requires careful consideration of these factors.
Noise Reduction Techniques
Employing longer RSI periods on a 15-minute chart can be advantageous for reducing inherent market noise, potentially leading to more reliable signals, particularly for identifying established trends. This is a key consideration when selecting the best rsi settings for 15 min chart.
- Longer periods (e.g., 20 or 25) provide a smoothing effect on price fluctuations.
- Enhanced ability to identify more persistent trends.
Potential for Delayed Signals
The smoothing effect of longer RSI periods, while beneficial for noise reduction, can also result in delayed signal generation, potentially causing traders to miss the initial phases of significant price movements. This is a trade-off to consider when evaluating the Best RSI Settings for 15-Minute Trading.
- Potential for delayed entry or exit signals.
- Possibility of missing the onset of rapid price changes.
Read More: Best EMA Settings for 15 Minute Chart
Optimizing Threshold Levels for M15 Trading
Beyond the RSI period itself, the standard overbought (70) and oversold (30) threshold levels may also benefit from adjustment to better align with the specific characteristics of the 15-minute chart. In strongly trending markets, the RSI can persist in overbought or oversold territory for extended durations. Strictly adhering to the conventional 70/30 levels might trigger premature exit signals, causing traders to miss out on potential profits as the trend continues its trajectory.
Consider exploring more extreme thresholds, such as 80/20, to mitigate the occurrence of false signals during pronounced trends. Conversely, in range-bound or sideways markets, the RSI might infrequently reach the standard 70 or 30 thresholds. In such scenarios, narrowing the range to 60/40 could yield more relevant and timely signals. Experimenting with these threshold levels and meticulously observing the RSI’s interaction with price action on your chosen assets is crucial for identifying the optimal boundaries for your specific 15-minute trading strategy. Identifying the best rsi settings for 15-minute scalping often involves fine-tuning these thresholds.
Customizing Overbought/Oversold Zones
The standard overbought (70) and oversold (30) levels of the RSI may not always be optimal for the accelerated dynamics of a 15-minute chart. Adjusting these zones can aid in filtering out spurious signals and better synchronize the indicator with prevailing market conditions when determining the Optimal RSI Settings for 15-Minute Charts.
Utilizing Extreme Thresholds (80/20)
In markets exhibiting strong directional momentum, the RSI can remain in overbought or oversold territory for prolonged periods. Employing more extreme thresholds like 80/20 can help minimize false signals and allow traders to remain in profitable positions longer, a key consideration for the best rsi settings for 15 min chart.
Narrowing Ranges in Consolidation (60/40)
In sideways or consolidating markets, the RSI may not frequently reach the standard 70 or 30 levels. Narrowing the range to levels like 60/40 can provide more pertinent signals under these conditions, aiding in the selection of the Best RSI Settings for 15-Minute Trading.
Integrating RSI with Price Action on M15
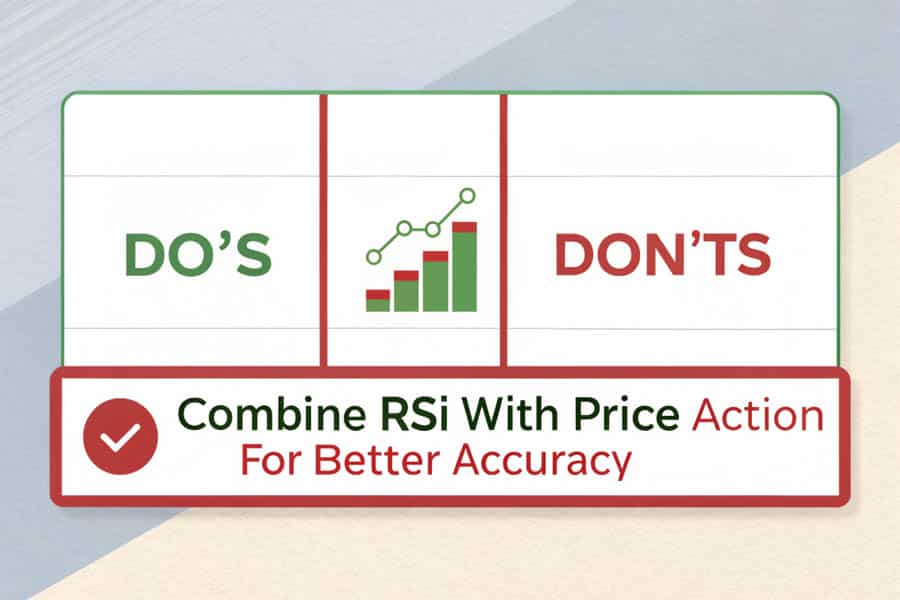
The RSI is a potent momentum indicator, but its efficacy is significantly amplified when integrated with price action analysis. Solely relying on RSI signals can be inherently risky. Instead, seek confluence – instances where RSI signals align with observable price action patterns. For example, if the RSI is approaching oversold territory concurrently with the formation of a bullish engulfing candlestick pattern at a key support level, this convergence provides a significantly stronger buy signal than relying on the RSI in isolation.
Conversely, if the RSI is signaling overbought conditions and a bearish pin bar emerges at a significant resistance level, it reinforces the potential for a downward price movement. Price action provides the essential context, while the RSI serves to validate the underlying momentum. Developing proficiency in interpreting candlestick patterns, identifying key support and resistance levels, and recognizing common chart patterns will substantially enhance the reliability of your RSI analysis on the 15-minute chart. This integrated approach is paramount for effectively utilizing the best rsi settings for 15 min chart.
Price Pattern Confirmation Techniques
Combining RSI signals with price action analysis can substantially improve the reliability of trading decisions on a 15-minute chart. Look for instances where RSI signals are corroborated by specific candlestick patterns or chart formations to optimize your RSI Settings for 15-Minute Scalping.
Illustrative Examples of Confluence
Identifying scenarios where RSI signals converge with price action can yield higher-probability trading setups. For instance, an oversold RSI reading coupled with a bullish engulfing pattern can signal a robust buying opportunity, highlighting the importance of the Optimal RSI Settings for 15-Minute Charts.
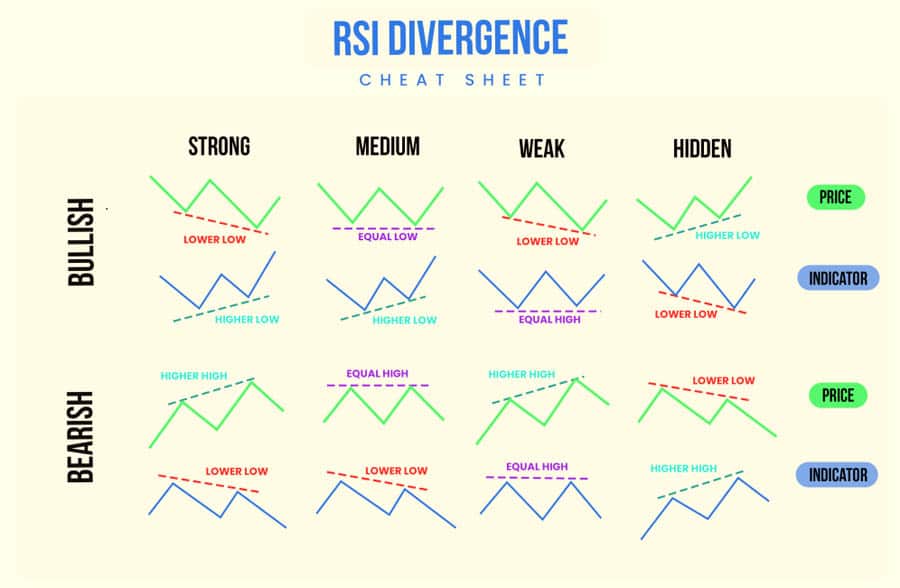
Identifying Reversals with RSI Divergence on M15
RSI divergence is a valuable technique for identifying potential trend reversals, particularly within the compressed timeframe of the 15-minute chart. Bullish divergence occurs when price establishes lower lows, but the RSI simultaneously registers higher lows. This discrepancy suggests a weakening of selling momentum, indicating a potential upward reversal. Conversely, bearish divergence materializes when price records higher highs, but the RSI registers lower highs, suggesting a waning of buying momentum and a potential downward reversal.
While divergence can serve as a valuable early warning signal, it is crucial to remember that it is not a definitive predictor of a reversal. Always seek further confirmation through price action, volume analysis, or other technical indicators before acting solely on divergence signals. On the fast-paced 15-minute chart, early identification of divergence can provide a significant advantage, allowing traders to strategically position themselves for potential shifts in market direction when using the best rsi settings for 15 min chart.
Bullish and Bearish Divergence Patterns
RSI divergence occurs when the indicator’s movement deviates from the price action, potentially signaling an impending trend reversal. Recognizing both bullish and bearish divergence patterns is crucial for traders operating on the 15-minute chart and seeking the Best RSI Settings for 15-Minute Trading.
Importance of Corroboration
While RSI divergence can be a valuable indicator, it is essential to seek corroboration from other indicators or price action before making trading decisions. Sole reliance on divergence can lead to premature or inaccurate signals, even with the best rsi settings for 15 minute chart.
Personalized Optimization: Backtesting RSI Configurations
There is no universally optimal “best” RSI configuration that guarantees profitability for every trader and every asset on the 15-minute chart. The ideal settings are highly subjective and contingent upon your individual trading style, the specific assets you are trading, and the prevailing market conditions. This is where the practice of backtesting becomes indispensable. Backtesting involves applying different RSI configurations to historical price data to simulate their past performance.
This rigorous process allows for an objective evaluation of the effectiveness of various settings, enabling the identification of those that have historically yielded the most favorable results for your chosen assets and trading strategies. Analyze key performance metrics such as win rate, drawdown, and profit factor for different RSI periods and overbought/oversold levels. Once promising configurations have been identified through backtesting, it is crucial to then forward test them in a demo environment before deploying them with live capital. This allows for observation of their performance in real-time market conditions without financial risk. This iterative process of backtesting and forward testing is essential for discovering your personalized best rsi settings for 15 min chart.
Leveraging Historical Data for Analysis
Backtesting various RSI configurations on historical data relevant to your chosen assets and trading strategy is paramount for identifying which settings have historically demonstrated the strongest performance when determining the Optimal RSI Settings for 15-Minute Charts.
Analyzing Performance Metrics
Meticulously analyze the results of your backtesting endeavors to identify RSI configurations that yield the most desirable outcomes based on your specific trading objectives and risk parameters. This is crucial for selecting the best rsi settings for 15 min chart.
Simulated Trading for Validation
Prior to implementing any RSI configurations in live trading, it is highly advisable to forward test them in a demo account. This allows for the observation of their performance in live market conditions without exposing actual capital to risk, ensuring the chosen Best RSI Settings for 15-Minute Trading are robust.
Avoiding Common Pitfalls in M15 RSI Usage
Effective utilization of the RSI on the 15-minute chart necessitates discipline and a keen awareness of potential pitfalls. One prevalent error is placing excessive reliance on RSI signals without adequately considering the broader market context or the prevailing trend. Initiating trades counter to a strong trend solely based on an overbought or oversold RSI reading can be a costly mistake.
Another common pitfall is the tendency to frequently alter RSI settings without engaging in proper backtesting and a thorough understanding of the implications. Switching between different settings based on recent losing trades can lead to confusion and inconsistent results. Adherence to settings that have demonstrated efficacy through rigorous backtesting and a comprehensive understanding of the rationale behind those choices is crucial. Remember, the RSI is a valuable tool, but its effectiveness is ultimately determined by the skill and knowledge of the user employing it when seeking the best rsi settings for 15 min chart.
Mitigating Over-reliance on Signals
One of the most frequent errors traders commit is placing excessive emphasis on RSI signals without factoring in other elements such as the overarching market trend or price action when using RSI Settings for 15-Minute Scalping.
Considering Market Dynamics and Trend
Neglecting to consider the broader market dynamics and the prevailing trend can lead to misinterpreting RSI signals and initiating trades against the dominant momentum, even with the best rsi settings for 15 minute chart.
Maintaining Configuration Consistency
Frequently adjusting RSI settings without proper backtesting and a solid understanding can lead to inconsistent outcomes and impede the development of a sound trading strategy, highlighting the importance of finding the right Optimal RSI Settings for 15-Minute Charts and sticking with them.
OpoFinance: Empowering Your Trading Journey
Seeking a dependable and regulated forex broker to execute your 15-minute chart strategies? Consider OpoFinance, an ASIC regulated forex trading broker committed to delivering a secure and efficient trading environment.
- ASIC Regulation: Trade with confidence knowing OpoFinance adheres to the stringent regulatory standards of the Australian Securities and Investments Commission (ASIC).
- MT5 Platform: Access powerful charting tools and indicators, including the RSI, through the widely acclaimed MetaTrader 5 (MT5) platform. OpoFinance is officially featured on the mt5 brokers list, ensuring a seamless trading experience.
- Social Trading: Connect and learn from experienced traders through OpoFinance’s social trading features, potentially gaining valuable insights into different RSI strategies and settings.
- Safe and convenient Deposits and Withdrawals: Enjoy peace of mind with a variety of safe and convenient methods for funding your account and withdrawing your profits.

Ready to elevate your trading? Visit opofinance.com to explore their services and open an account today.
Conclusion: Tailoring RSI for Your M15 Trading Methodology
Within the dynamic context of 15-minute chart trading, identifying the best rsi settings for 15 minute chart is an ongoing process of discovery and refinement. A singular, universally applicable solution does not exist. The key lies in cultivating a comprehensive understanding of the RSI’s intricacies, diligently experimenting with various periods and thresholds, and rigorously backtesting your selections.
Remember the significance of integrating RSI signals with price action analysis and remaining vigilant regarding potential pitfalls. Ultimately, the most effective RSI settings are those that seamlessly align with your individual trading methodology, risk parameters, and the specific characteristics of the assets you are trading. Embrace a mindset of continuous learning and adaptation, and you will be well-positioned to unlock the full potential of the RSI on the 15-minute chart.
Key Takeaways:
- Shorter RSI periods (e.g., 7-10) can enhance responsiveness on the 15-minute chart but may increase the incidence of false signals.
- Longer RSI periods (e.g., 20-25) can smooth signals, potentially reducing noise but also introducing latency.
- Adjusting overbought/oversold thresholds (e.g., 80/20 or 60/40) can be advantageous depending on prevailing market conditions.
- Integrating RSI analysis with price action significantly improves the reliability of trading signals.
- Backtesting is essential for identifying the optimal RSI configurations tailored to your specific trading style and chosen assets.
How does market volatility influence optimal RSI configurations on a 15-minute chart?
Elevated market volatility might necessitate shorter RSI periods to capture rapid price fluctuations, but it also amplifies the risk of false signals. Conversely, reduced volatility might permit slightly longer periods to filter out minor oscillations. Adjusting overbought/oversold thresholds might also be necessary to accommodate expanded or contracted price ranges.
Can optimal RSI configurations for a 15-minute chart vary across different currency pairs or assets?
Yes, distinct currency pairs and assets exhibit varying degrees of volatility and trading characteristics. Consequently, the optimal RSI configurations can indeed differ. It is recommended to backtest and optimize RSI settings for each specific asset you intend to trade on the 15-minute chart.
Are there specific times of day when certain RSI configurations perform better on the 15-minute chart?
Market activity and volatility often fluctuate throughout the trading day. During periods of high liquidity and volatility, such as the confluence of major market sessions, shorter RSI periods might prove more effective. In quieter periods, slightly longer periods could provide more reliable signals. Observing intraday volatility patterns can aid in refining your RSI configurations.


