

Are you ready to supercharge your trading strategy and pinpoint high-probability trades? Imagine effortlessly identifying optimal entry and exit points in the fast-paced world of forex trading. The secret weapon? Mastering the Relative Strength Index (RSI) on the 4-hour chart. Many traders, especially those using a regulated forex broker, seek reliable tools to navigate market volatility. This article dives deep into the best RSI settings for 4 hour chart analysis, revealing how to fine-tune this powerful indicator for maximum profitability. Forget guesswork and embrace precision – discover the optimal rsi settings for 4 hour chart and transform your trading today.

RSI & Trading Importance

Technical analysis is the backbone of informed trading decisions, and within its vast arsenal, the Relative Strength Index (RSI) stands out as a remarkably versatile and insightful indicator. For traders aiming to capture significant market movements without being glued to minute-by-minute charts, the 4-hour timeframe offers a sweet spot. But to truly harness its power, understanding and optimizing your RSI settings is paramount. Let’s explore why RSI is indispensable and how it becomes even more potent on the 4-hour chart.
What is RSI?
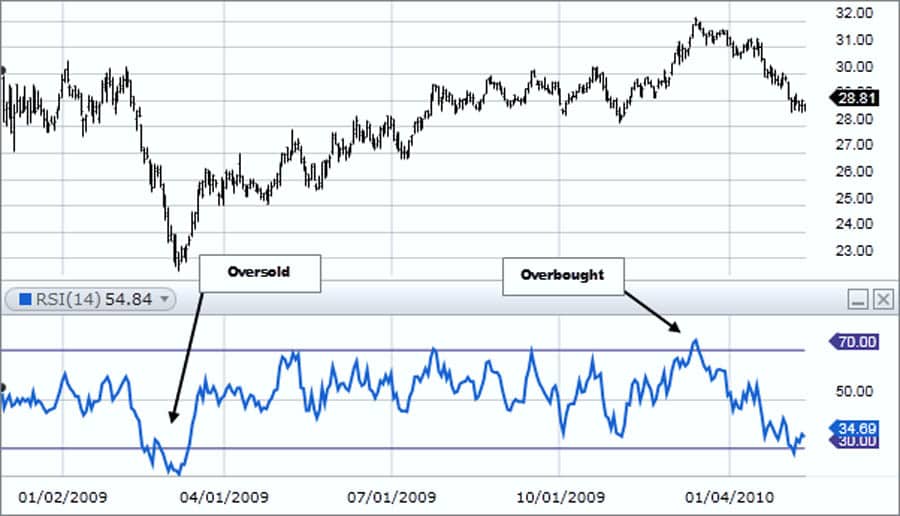
The Relative Strength Index (RSI), developed by J. Welles Wilder Jr., is a momentum oscillator that measures the speed and change of price movements. Essentially, it oscillates between 0 and 100 and is primarily used to identify overbought and oversold conditions in the market. When the RSI climbs above 70, it suggests an asset might be overbought and poised for a potential pullback.
Conversely, when it dips below 30, it indicates an oversold condition, hinting at a possible price increase. However, the RSI is more than just a simple overbought/oversold gauge; it’s a dynamic tool that can reveal underlying market strength and weakness, providing crucial clues for strategic trading. Understanding what is RSI is the first step to finding the best RSI settings for 4 hour chart.
Why RSI Matters for Traders
Traders gravitate towards the RSI for several compelling reasons. Firstly, it provides a clear, visual representation of momentum, making it easier to grasp market sentiment at a glance. Secondly, RSI can help anticipate potential trend reversals by highlighting divergences between price action and indicator movement. For instance, if the price is making new highs, but the RSI is forming lower highs, it could signal weakening momentum and a possible trend change.
Furthermore, the RSI is adaptable and can be used across various markets, from stocks and forex to cryptocurrencies, making it a universally valuable tool in a trader’s toolkit. By understanding and correctly interpreting RSI signals, traders can enhance their entry and exit timing, manage risk more effectively, and ultimately improve their trading performance. This is especially true when using optimal RSI settings for 4-hour timeframe trading.
RSI Across Timeframes: Focus on 4-Hour Chart
While the RSI is effective across multiple timeframes, its application and interpretation can vary. On shorter timeframes like 1-minute or 5-minute charts, RSI reacts rapidly to price fluctuations, generating numerous signals, many of which might be noise. Conversely, on longer timeframes like daily or weekly charts, RSI signals are more robust but less frequent, potentially missing out on shorter-term trading opportunities.
The 4-hour chart strikes a compelling balance. It filters out much of the short-term noise prevalent in lower timeframes, providing clearer, more reliable signals suitable for swing trading and medium-term analysis. Using the RSI on a 4-hour chart allows traders to capture significant trends while avoiding the whipsaw action often seen on intraday charts. This makes it an ideal timeframe for traders who seek a balance between signal frequency and signal reliability, especially when determining the optimal RSI settings for 4-hour timeframe trading.
Read More: 4 hour forex trading strategy
Understanding 4-Hour Chart

The 4-hour chart holds a unique position in the world of trading timeframes, revered by many seasoned traders for its ability to bridge the gap between short-term volatility and long-term trends. It’s not just a longer timeframe; it’s a strategic vantage point that offers a clearer perspective on market dynamics. Let’s delve into why the 4-hour chart is so popular and the specific benefits it brings to swing and day traders alike.
4-Hour Chart Popularity
The popularity of the 4-hour chart stems from its remarkable ability to filter out intraday noise while still capturing meaningful price movements. Unlike shorter timeframes that can be heavily influenced by fleeting market fluctuations and news events, the 4-hour chart provides a smoother, more stable view of price action. This stability is invaluable for traders seeking to identify genuine trends and avoid being whipsawed by short-term volatility.
Moreover, the 4-hour chart aligns well with the rhythm of the trading day, providing actionable signals at regular intervals without requiring constant monitoring. For those who balance trading with other commitments, the 4-hour chart offers a practical and efficient way to engage with the markets, making it a favorite among both part-time and full-time traders. Its balanced perspective is key to understanding why finding the best RSI settings for 4-hour chart trading is so crucial for many.
4-Hour Chart Benefits for Trading Styles
For swing traders, the 4-hour chart is particularly advantageous as it helps identify medium-term trends that can last for several days or weeks. It provides ample time to analyze market conditions, plan entries and exits, and manage trades without the pressure of constant intraday monitoring. The reduced noise on the 4-hour chart also leads to fewer false signals, increasing the probability of successful swing trades. Day traders, while typically focused on shorter timeframes, can also benefit from the 4-hour chart by using it to establish the broader intraday trend.
By understanding the prevailing trend on the 4-hour chart, day traders can align their shorter-term trades with the larger market direction, increasing their odds of success. Whether you are a swing trader looking for substantial moves or a day trader seeking context for your intraday strategies, the 4-hour chart offers a powerful and versatile tool. Mastering the RSI indicator settings for 4-hour chart analysis further enhances its utility for both trading styles.
Default RSI Settings & Limitations
When you first load the Relative Strength Index (RSI) onto your trading platform, it typically comes with a default setting of 14 periods. This 14-period RSI has become an industry standard, widely used across various markets and timeframes. However, while default settings offer a starting point, they are not always optimal for every trading style or timeframe, especially the 4-hour chart. Understanding the default settings and their limitations is crucial to unlocking the full potential of RSI.
Default 14-Period RSI Explained
The 14-period RSI calculates the average gain and average loss over the past 14 periods (e.g., 14 bars on a chart) to measure the momentum of price movements. This setting was initially proposed by Wilder and has been adopted as a standard due to its perceived balance between responsiveness and smoothness. A 14-period RSI reacts reasonably quickly to price changes, providing timely signals without being overly erratic.
It’s considered a middle-ground setting, aiming to capture both short-term fluctuations and medium-term trends. For many traders, especially beginners, the 14-period RSI serves as a reliable starting point for learning and applying RSI analysis. However, it’s essential to recognize that “default” doesn’t necessarily mean “best,” particularly when seeking the best RSI settings for 4-hour chart trading.
Why Default RSI May Not Be Optimal for 4-Hour Chart
While the 14-period RSI is a solid general-purpose setting, it may not be perfectly tailored for the nuances of the 4-hour chart. The 4-hour timeframe, as discussed, filters out short-term noise and emphasizes medium-term trends. A 14-period RSI on a 4-hour chart might still be slightly too reactive, generating signals that are influenced by minor price swings rather than the more significant, sustained movements that 4-hour traders aim to capture.
Furthermore, market conditions evolve, and what worked well historically might not be optimal in the current environment. Over-reliance on default settings can lead to missed opportunities or increased false signals, especially in the context of the 4-hour chart where precision and signal quality are paramount. Therefore, exploring and potentially adjusting the RSI period is a vital step in optimizing your trading strategy for the 4-hour timeframe and finding the most effective rsi settings for 4 hour chart analysis.
Read More: Best ema settings for 4 hour chart
Best RSI Settings for 4-Hour Chart
Moving beyond the default 14-period RSI, let’s delve into settings that are often considered more attuned to the 4-hour chart’s characteristics. The goal is to find settings that enhance signal accuracy, reduce noise, and align with the medium-term trends typically observed on this timeframe. While there’s no one-size-fits-all answer, certain RSI periods tend to perform exceptionally well on the 4-hour chart.
Recommended RSI Periods: 9, 10, 12
Many experienced traders advocate for shorter RSI periods when using the 4-hour chart, often suggesting settings like 9, 10, or 12 periods. These shorter periods make the RSI more sensitive to recent price changes, allowing it to react more quickly to potential shifts in momentum on the 4-hour timeframe. A 9-period RSI, for instance, will be more responsive than a 14-period RSI, potentially providing earlier signals of overbought or oversold conditions and trend reversals.
Similarly, a 10 or 12-period RSI offers a slightly smoother response than the 9-period but remains more sensitive than the default 14-period setting. The choice between 9, 10, or 12 often comes down to personal preference and the specific market being traded. Experimenting with these settings and observing their performance on your chosen assets is crucial to determining the best RSI settings for 4-hour chart trading that suit your individual style and market dynamics.
Adjusting RSI Settings for Accuracy
Adjusting RSI settings for improved accuracy is not about finding a magic number but rather about fine-tuning the indicator to match your trading style and the specific characteristics of the assets you trade. One effective approach is to backtest different RSI periods on historical 4-hour chart data. This involves systematically testing various settings (e.g., 8, 9, 10, 11, 12, 13, 14) and evaluating their performance based on your trading strategy. Look for settings that generate timely and reliable signals, minimize false positives, and align with your risk tolerance.
Another technique is to visually analyze charts with different RSI settings applied. Observe how each setting reacts to price movements, identify potential overbought and oversold zones, and assess the clarity and usefulness of the signals generated. Remember, the “best” setting is subjective and context-dependent. Continuous evaluation and adjustment based on market conditions and your trading results are key to maintaining optimal RSI indicator settings for 4-hour chart analysis.
Optimizing RSI for 4-Hour Chart
While choosing the right RSI period is a significant step, optimizing RSI for the 4-hour chart goes beyond just setting the period. To truly maximize its effectiveness, it’s crucial to integrate RSI with other technical analysis tools and employ strategic techniques for interpreting its signals. Combining RSI with complementary indicators and understanding how to use overbought and oversold levels effectively can significantly enhance your trading decisions.
Combining RSI with Other Indicators
RSI, while powerful on its own, becomes even more potent when used in conjunction with other technical indicators. Moving averages, for example, can help confirm the trend direction identified by RSI. If the price is above a rising moving average and RSI signals an oversold condition, it strengthens the bullish signal. Conversely, if the price is below a falling moving average and RSI indicates overbought, it reinforces the bearish signal. The Moving Average Convergence Divergence (MACD) is another excellent companion to RSI.
MACD helps identify changes in momentum and trend strength, complementing RSI’s overbought/oversold readings. For instance, if RSI is approaching overbought levels, but MACD shows increasing bullish momentum, it might suggest that the overbought condition is part of a strong uptrend and not necessarily a signal to sell immediately. By strategically combining RSI with other indicators, you create a more robust and nuanced trading strategy, improving the reliability of your signals and increasing your confidence in your trading decisions when using the optimal RSI settings for 4-hour timeframe.
Effective Use of RSI Overbought/Oversold Levels
The traditional overbought level for RSI is 70, and the oversold level is 30. However, these levels are not absolute buy or sell signals. In strong trending markets, price can remain in overbought or oversold territory for extended periods. Therefore, it’s crucial to use these levels contextually. Instead of automatically selling when RSI hits 70 or buying when it hits 30, look for confirmation signals. For example, in an uptrend, wait for RSI to move into overbought territory and then look for bearish candlestick patterns or divergence to confirm a potential reversal.
Similarly, in a downtrend, wait for RSI to reach oversold levels and then seek bullish candlestick patterns or divergence to signal a possible bounce. Furthermore, adjusting the overbought and oversold levels can be beneficial. In strongly trending markets, you might consider raising the overbought level to 80 or even 90 and lowering the oversold level to 20 or 10 to reduce premature signals. Effective use of overbought and oversold levels involves understanding market context, seeking confirmation, and potentially adjusting levels to suit specific market conditions, all while utilizing the best RSI settings for 4-hour chart you’ve identified.
Read More: What is RSI Indicator
Backtesting RSI Settings
Before deploying any RSI settings in live trading, especially on the 4-hour chart where decisions can have significant implications, backtesting is an indispensable step. Backtesting involves applying your chosen RSI settings to historical data to simulate how they would have performed in the past. This process provides valuable insights into the effectiveness of your settings and helps you refine your strategy before risking real capital.

Importance of RSI Backtesting
Backtesting is crucial for several reasons. Firstly, it allows you to objectively evaluate the historical performance of different RSI settings. By analyzing past trades generated by specific settings, you can identify which settings have historically produced the most profitable and reliable signals on the 4-hour chart. Secondly, backtesting helps you understand the strengths and weaknesses of your chosen settings in various market conditions. You can assess how they perform during trending periods, ranging markets, and periods of high volatility.
This understanding is vital for adapting your strategy to changing market dynamics. Thirdly, backtesting builds confidence in your trading approach. Seeing positive backtesting results can significantly boost your conviction in your strategy, making it easier to execute trades with discipline and consistency in live market conditions. Ultimately, backtesting is a risk-free way to validate your optimal RSI settings for 4-hour timeframe and refine your trading edge.
Step-by-Step RSI Backtesting Guide
To effectively backtest RSI settings on the 4-hour chart, follow these steps:
- Choose a Backtesting Platform: Select a trading platform or software that offers robust backtesting capabilities. Many charting platforms, like TradingView or MetaTrader 5, provide tools for historical data analysis and strategy simulation.
- Define Your Trading Strategy: Clearly outline your trading rules based on RSI signals. For example, specify entry rules (e.g., buy when RSI crosses below 30 and then crosses back above 30), exit rules (e.g., sell when RSI crosses above 70 or at a predetermined profit target), and risk management rules (e.g., stop-loss levels).
- Select Historical Data: Gather historical 4-hour chart data for the assets you intend to trade. Ensure you have a sufficient data period to capture various market conditions (e.g., at least one to two years of data).
- Test Different RSI Settings: Systematically test different RSI periods (e.g., 9, 10, 12, 14) one at a time. For each setting, run your backtest using your defined trading strategy and historical data.
- Analyze Backtesting Results: Evaluate the backtesting results for each RSI setting. Key metrics to consider include:
- Profitability: Net profit, profit factor, and maximum drawdown.
- Signal Quality: Win rate, number of trades, and average trade duration.
- Risk Metrics: Maximum drawdown, Sharpe ratio, and Sortino ratio.
- Optimize and Refine: Based on your backtesting analysis, identify the RSI settings that performed best according to your chosen metrics. You may need to iterate and refine your settings and trading rules based on the backtesting outcomes.
- Forward Testing (Optional): After backtesting, consider forward testing your optimized RSI settings on a demo account using real-time market data before deploying them in live trading. This helps validate your backtesting results in a live, but risk-free, environment.
By diligently following these steps, you can rigorously backtest and optimize your best RSI settings for 4-hour chart trading, significantly increasing your chances of success in the live markets.
Pro Tips for Advanced Traders
For seasoned traders looking to push the boundaries of RSI application on the 4-hour chart, here are some advanced techniques to consider:
- RSI Divergence Mastery: Deepen your understanding of RSI divergence. Beyond regular bullish and bearish divergence, explore hidden divergence, which can provide high-probability continuation signals. Mastering divergence patterns can significantly enhance your ability to anticipate trend reversals and continuations using your chosen rsi settings for 4 hour chart.
- Dynamic RSI Levels: Instead of fixed overbought/oversold levels (70/30), consider using dynamic levels that adapt to market volatility. For example, you could use Bollinger Bands to dynamically adjust RSI overbought and oversold thresholds based on current volatility conditions.
- Multi-Timeframe RSI Analysis: Combine RSI analysis across multiple timeframes. Use the 4-hour chart for primary signal generation but consult higher timeframes (e.g., daily) to confirm the broader trend context and lower timeframes (e.g., 1-hour) for refined entry timing. This multi-layered approach can provide a more holistic view of market dynamics.
- RSI with Volume Confirmation: Integrate volume analysis with RSI signals. For example, look for RSI breakouts from overbought or oversold levels accompanied by a surge in volume to confirm the strength of the signal. Volume can add an extra layer of validation to your RSI-based trading decisions.
- Adaptive RSI Period: Explore adaptive RSI periods that automatically adjust based on market volatility. Volatility-adjusted RSI settings can be particularly useful in dynamic markets where fixed periods may become less effective.
By incorporating these advanced techniques, you can elevate your RSI analysis on the 4-hour chart to a more sophisticated level, potentially unlocking even greater trading precision and profitability with your best RSI settings for 4-hour chart trading.
Opofinance: Your Trusted Forex Broker
In your journey to master forex trading and optimize your RSI strategies, choosing the right broker is paramount. Opofinance stands out as a premier, ASIC-regulated forex broker, providing a secure and innovative trading environment. Here’s why Opofinance is the ideal choice for discerning traders:
- ASIC Regulation: Trade with confidence knowing Opofinance is regulated by the Australian Securities and Investments Commission (ASIC), a leading global regulatory body, ensuring the highest standards of security and transparency.
- MT5 Platform: Access the powerful MetaTrader 5 (MT5) platform, renowned for its advanced charting tools, algorithmic trading capabilities, and comprehensive analytical resources. Opofinance is officially featured on the MT5 brokers list, highlighting its commitment to providing top-tier trading technology.
- Social Trading: Leverage the wisdom of the crowd with Opofinance’s social trading features. Connect with and learn from experienced traders, copy their strategies, and enhance your trading knowledge and potential profitability.
- Safe & Convenient Transactions: Enjoy peace of mind with a wide array of secure and convenient deposit and withdrawal methods, ensuring seamless transactions and easy access to your funds.
- Exceptional Support: Benefit from dedicated customer support, ready to assist you with any queries and ensure a smooth and efficient trading experience.

Ready to elevate your trading experience? Partner with a regulated forex broker that prioritizes your success. Discover Opofinance today and unlock your full trading potential!
Conclusion: Mastering RSI on 4-Hour Chart
In conclusion, mastering the Relative Strength Index (RSI) on the 4-hour chart is a powerful endeavor for any trader seeking to enhance their market analysis and trading precision. While the default 14-period RSI provides a starting point, exploring and optimizing your settings, particularly towards shorter periods like 9, 10, or 12, can significantly improve signal responsiveness and accuracy on this timeframe. Remember, the best RSI settings for 4-hour chart trading are not static; they require ongoing evaluation, backtesting, and adaptation to market conditions and your individual trading style.
By combining optimized RSI settings with complementary indicators, effective use of overbought and oversold levels, and advanced techniques like divergence analysis, you can unlock the full potential of RSI on the 4-hour chart. Embrace continuous learning, rigorous backtesting, and disciplined application of your refined RSI strategies to navigate the markets with greater confidence and achieve your trading goals.
Key Takeaways
- 4-hour chart balances noise and trends for trading.
- Default 14-period RSI may be slow; consider 9, 10, or 12 periods.
- Combine RSI with MAs and MACD for signal confirmation.
- Use overbought/oversold levels with confirmation; adjust dynamically.
- Backtest RSI settings on 4-hour data for validation.
- Advanced RSI techniques enhance trading precision.
Can RSI be used alone for 4-hour chart trading?
While RSI is powerful, using it alone for 4-hour chart trading is not recommended. Combine RSI with other tools like moving averages or MACD to confirm signals and improve reliability. This integrated approach reduces false signals and enhances decision-making.
How often re-evaluate RSI 4-hour settings?
Re-evaluate your RSI settings for the 4-hour chart periodically, ideally every few months or when market conditions change significantly. Regular reviews and backtesting ensure your settings remain optimal and effective in the current market environment.
Are best RSI 4-hour settings same for all pairs?
While 9, 10, or 12 RSI periods are generally effective on the 4-hour chart across pairs, truly optimal settings can vary. Backtest and fine-tune RSI settings for each currency pair to account for unique volatility and price action characteristics for best results.


One Response
Always informative