Are you looking to refine your gold trading strategy and pinpoint those lucrative entry and exit points? The Relative Strength Index (RSI) is a powerful tool in a trader’s arsenal, but finding the best RSI settings for gold can feel like searching for a gold nugget in a vast mine. The direct answer is: there’s no single “magic number.” However, understanding how to tailor your RSI settings to the unique characteristics of gold trading can significantly enhance your ability to identify potential opportunities.

This article will delve deep into the world of RSI, exploring optimal RSI settings for gold, examining various trading strategies, and providing you with the insights needed to make informed decisions. Whether you’re a seasoned trader or just starting your journey, mastering RSI for gold can be a game-changer. And for those seeking a reliable partner in their trading endeavors, consider exploring the services of a regulated forex broker like those featured on reputable platforms.
RSI & Gold Trading: Why It Matters

The Relative Strength Index (RSI), developed by J. Welles Wilder Jr., is a momentum oscillator that measures the speed and change of price movements. It oscillates between 0 and 100, providing valuable insights into whether an asset is overbought or oversold. In the context of gold trading, understanding these conditions is paramount. Gold, often considered a safe-haven asset, exhibits unique price behavior influenced by factors like inflation, interest rates, and geopolitical events.
RSI: A Momentum Oscillator Explained
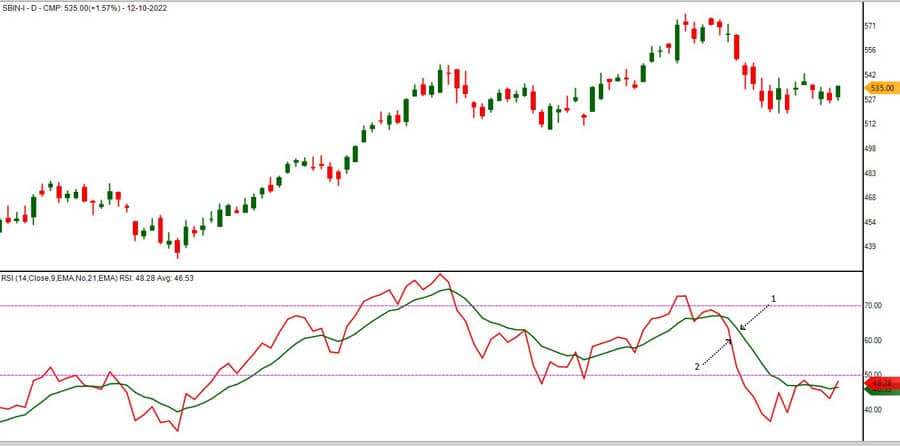
The RSI operates on the principle of comparing the average gains of an asset during up periods with the average losses during down periods over a specified lookback period. This calculation generates a value between 0 and 100. A reading above 70 typically suggests that the asset is overbought, indicating that buying pressure may be unsustainable and a potential price correction could be imminent.
Conversely, a reading below 30 generally signals an oversold condition, implying that selling pressure might be exhausted and a price rebound could be on the horizon. The beauty of the RSI lies in its ability to visually represent the ebb and flow of buying and selling momentum, offering traders a clearer picture of the underlying market forces at play.
Why Use RSI for Gold?
Gold, often revered as a safe-haven asset and a hedge against inflation, exhibits distinct price behavior influenced by a complex interplay of macroeconomic factors, including interest rate decisions, currency fluctuations, and geopolitical events. Precisely identifying overbought and oversold conditions in this unique market can provide significant advantages:
- Early Warning Signals: RSI can signal potential trend reversals before they become fully apparent on the price chart. When the RSI reaches extreme levels, it suggests that the current price momentum may be unsustainable.
- Confirmation of Trends: RSI can be used to confirm the strength of an existing trend. For instance, during an uptrend, the RSI should ideally remain above 50, indicating continued bullish momentum.
- Identifying Divergence: RSI divergence, where the price makes new highs (or lows) but the RSI fails to do so, can be a powerful indicator of an impending trend reversal. This is particularly valuable in the volatile gold market.
Understanding Gold RSI Settings
The default RSI setting, widely adopted across trading platforms, typically employs a 14-period lookback. This signifies that the RSI calculation considers the average gains and losses over the preceding 14 periods, whether those periods represent days on a daily chart, hours on an hourly chart, or any other chosen timeframe. While the 14-period RSI serves as a reasonable starting point and a widely recognized benchmark, it’s absolutely crucial to grasp its specific relevance to the nuances of gold trading and, more importantly, how strategic adjustments to this setting can significantly optimize its performance and accuracy in this unique market.
Default RSI (14-Period) for Gold
The 14-period RSI offers a balanced perspective on recent price activity, striking a compromise between sensitivity and smoothness. It possesses sufficient responsiveness to capture short-term shifts in momentum, making it useful for identifying potential entry and exit points. Simultaneously, it incorporates enough historical data to avoid being overly whipsawed by insignificant price fluctuations, providing a degree of stability in its signals. For gold, a market prone to periods of both intense volatility and sideways consolidation, the 14-period RSI can indeed provide a reliable baseline for analysis. However, it’s vital to acknowledge that its effectiveness can fluctuate depending on the specific timeframe you are employing for your gold trading activities.
Adjusting RSI for Gold Timeframes
The key to unlocking the full potential of the RSI lies in understanding that the “best” settings are not static; they are dynamic and should be adapted to the specific timeframe you are analyzing. Different timeframes inherently capture different levels of market noise and momentum, necessitating adjustments to the RSI’s sensitivity:
- Shorter Timeframes (e.g., 1-hour, 30-minutes): For scalping or day trading gold, a shorter RSI period, such as 9 or even 7, can be more effective. These shorter periods react more quickly to price changes, providing faster signals for short-term opportunities. However, be aware that shorter periods can also generate more false signals.
- Medium Timeframes (e.g., 4-hour): The default 14-period RSI often works well on the 4-hour chart, providing a good balance between sensitivity and reliability for swing trading gold.
- Longer Timeframes (e.g., Daily, Weekly): For long-term investors or position traders in gold, a longer RSI period, such as 20 or 25, can be more appropriate. These longer periods filter out short-term noise and provide a clearer picture of the overall trend.
Pro Tip: Experiment with different RSI periods on a demo account to see which settings align best with your trading style and the specific timeframe you prefer for trading gold. Pay attention to how the RSI reacts to significant price movements and identify settings that provide timely and accurate signals.
Read More: Best Indicator for Gold Scalping
Best RSI Settings for Gold Strategies
The notion of the “best” RSI settings is inherently subjective and intricately linked to your chosen trading strategy and overarching financial objectives. What works optimally for a scalper will likely differ significantly from the ideal settings for a long-term investor. Let’s delve into recommended settings tailored for various approaches to navigating the gold market:
RSI for Scalping Gold
In the fast-paced world of scalping, where every pip counts and decisions are made in seconds, capturing fleeting opportunities requires a highly responsive RSI. Consider RSI periods in the range of 7 to 9. The primary focus here is to swiftly identify short-term overbought or oversold conditions that can be exploited for quick entries and exits, aiming for small but frequent profits.
RSI for Swing Trading Gold
For swing traders seeking to capitalize on medium-term price swings, the 14-period RSI often proves to be a robust and reliable choice. Focus on identifying RSI readings that reach extremes: above 70, suggesting potential short entry points as the market becomes overbought, and below 30, indicating potential long entry points as the market becomes oversold.
RSI for Long-Term Gold Trading
For investors with a longer investment horizon, where the emphasis is on capturing substantial, long-term trends, RSI periods ranging from 20 to 25 can provide a more stable and less noisy view of gold’s underlying momentum. The focus shifts to identifying major trend reversals and confirming the strength of established long-term trends, filtering out the short-term fluctuations that are less relevant to this approach.
Optimal Gold Overbought/Oversold Levels
While the conventional overbought threshold is set at 70 and the oversold threshold at 30, these levels are not immutable and can be strategically adjusted to better suit the specific characteristics of gold trading.
- Adjusting Gold Overbought/Oversold Zones: Given gold’s propensity for exhibiting strong, sustained trends, particularly during periods of heightened market uncertainty or economic instability, consider slightly widening the conventional overbought and oversold zones. For instance, employing 80 as the overbought level and 20 as the oversold level can prove beneficial in filtering out some premature or false signals that might arise during periods of robust trending price action. This adjustment allows the RSI to remain in overbought or oversold territory for a longer duration, reflecting the strength of the prevailing trend.
- Context is Key for Gold RSI: It’s absolutely crucial to emphasize that relying solely and blindly on these fixed levels is a recipe for potential misinterpretations and trading errors. Always consider the broader market context, including the prevailing trend direction, key support and resistance levels, and signals from other technical indicators, before making any trading decisions based solely on overbought or oversold RSI readings. A holistic approach to analysis is paramount for success.
Advanced Gold RSI Strategies

Beyond the fundamental application of identifying overbought and oversold zones, the RSI offers a repertoire of more sophisticated techniques that astute gold traders can leverage to gain a deeper understanding of market dynamics and enhance their trading precision.
Using Gold RSI Divergence
RSI divergence is a powerful phenomenon that occurs when the price action of gold diverges from the indications provided by the RSI. This discrepancy can often foreshadow potential shifts in the prevailing trend.
- Bearish Gold RSI Divergence: Bearish divergence materializes when the price of gold achieves a new higher high, indicating continued upward momentum, but the RSI simultaneously fails to reach a new higher high, instead forming a lower high. This divergence suggests a weakening of bullish momentum and signals a potential price reversal to the downside. Traders often interpret this as an opportunity to initiate short positions.
- Bullish Gold RSI Divergence: Conversely, bullish divergence occurs when the price of gold establishes a new lower low, suggesting continued bearish pressure, but the RSI, in contrast, forms a higher low. This divergence indicates a weakening of bearish momentum and hints at a potential price reversal to the upside. Traders often view this as a potential signal to enter long positions.
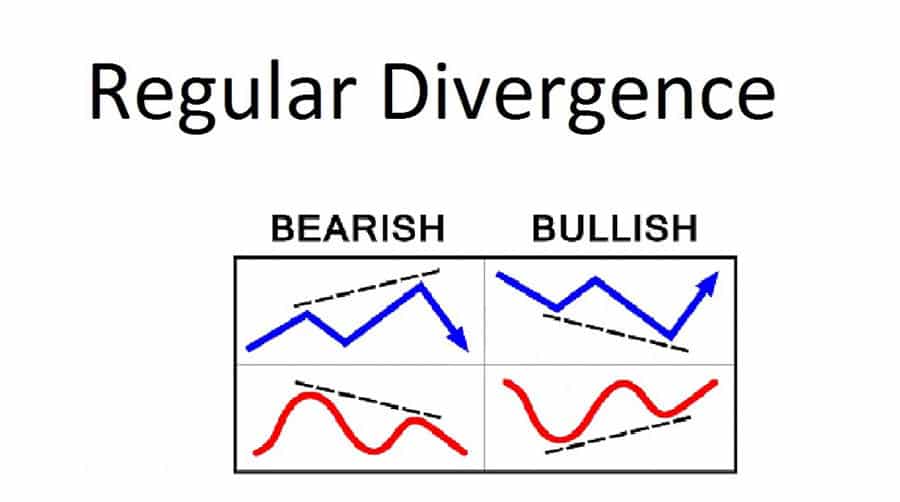
Divergence can be an exceptionally potent signal, particularly within the often-volatile landscape of the gold market, where identifying trend reversals early can lead to significant profit opportunities. However, it’s absolutely critical to exercise patience and wait for confirmation of the divergence signal before acting upon it. Confirmation can come in various forms, such as a break of a significant trendline, the emergence of a specific candlestick pattern indicating a change in sentiment, or corroborating signals from other technical indicators.
Combining Gold RSI with Other Indicators
Employing the RSI in isolation can, at times, lead to ambiguous or even misleading signals. To enhance the robustness and reliability of your trading decisions, consider integrating the RSI with other complementary technical indicators. This synergistic approach can significantly improve the accuracy of your analysis.
- RSI & Gold Moving Averages: Utilize moving averages to establish the overarching trend direction in the gold market. Moving averages smooth out price fluctuations, providing a clearer picture of the dominant trend. Once the trend is identified, employ the RSI to pinpoint potential entry points that align with that trend. For example, if the price of gold is trading above a key moving average, indicating an uptrend, look for oversold RSI readings as potential buying opportunities within the context of the prevailing bullish momentum.
- RSI & Gold Bollinger Bands: Bollinger Bands are volatility indicators that plot bands above and below a moving average, representing price volatility. When the price of gold touches the upper Bollinger Band and the RSI simultaneously registers an overbought condition, it can signal a potential short entry opportunity, suggesting that the price may be overextended and due for a pullback. Conversely, when the price touches the lower Bollinger Band and the RSI indicates an oversold condition, it can signal a potential long entry opportunity, suggesting that the price may be undervalued and poised for a rebound.
Pro Tip: Before deploying any combined strategies in live trading, rigorously backtest them on historical gold price data. This crucial step allows you to objectively assess their effectiveness across various market conditions and identify the optimal parameters for different scenarios. Backtesting not only builds confidence in your chosen approach but also helps you avoid potentially costly mistakes when real capital is at stake.
Read More: what is xauusd in forex
Setting Up Gold RSI on MT4/MT5
MetaTrader 4 (MT4) and MetaTrader 5 (MT5) stand as the dominant platforms favored by traders for accessing the gold market, offering a comprehensive suite of tools and functionalities. Here’s a detailed guide on how to seamlessly integrate and customize the RSI indicator on these platforms:
Adding Gold RSI to MT4/MT5
- Launch your MT4 or MT5 trading platform.
- Open the chart for gold (typically represented as XAUUSD).
- Navigate to the “Insert” menu, then select “Indicators,” followed by “Oscillators,” and finally, click on “Relative Strength Index.”
- A settings window will appear, allowing you to customize the RSI parameters:
- Period: Enter your desired RSI lookback period, such as 14, 9, or 20, depending on your strategy and timeframe.
- Apply to: The standard setting is “Close,” which calculates the RSI based on the closing prices of each period.
- Levels: Here, you can add or modify the overbought and oversold levels. The default values are 70 and 30, but you can adjust them to 80 and 20, for example, as discussed earlier.
- Style: Customize the visual appearance of the RSI line by selecting its color, thickness, and style to enhance readability on your charts.
- Once you have configured the settings to your preferences, click “OK” to apply the RSI indicator to your gold chart.
Interpreting Gold RSI Signals
- Understanding Gold Overbought/Oversold: As previously discussed, RSI readings that ascend above the designated overbought level (e.g., 70 or 80) suggest that gold may be overvalued and potentially poised for a downward correction or pullback. Conversely, readings that descend below the oversold level (e.g., 30 or 20) indicate that gold may be undervalued and could be due for a bounce or upward move. However, remember to consider these signals within the broader market context.
- The Gold RSI Centerline: The 50 level on the RSI acts as a crucial demarcation point, often serving as a dynamic level of support or resistance. A decisive move by the RSI above the 50 level is generally interpreted as a sign of strengthening bullish momentum, suggesting potential buying opportunities. Conversely, a drop below the 50 level indicates increasing bearish momentum, potentially signaling selling opportunities.
- Confirming Gold Trends with RSI: In the context of an established uptrend in gold prices, the RSI should ideally consistently remain above the 50 level, providing confirmation of the ongoing bullish momentum. If the RSI starts to consistently fall below 50 during an uptrend, it could signal weakening momentum and a potential trend reversal. Similarly, in a downtrend, the RSI should generally stay below 50. Failure to do so might indicate a loss of bearish momentum.
Avoiding Common Gold RSI Mistakes
While the RSI is an invaluable asset in a gold trader’s toolkit, it’s crucial to be aware of and actively avoid common pitfalls that can lead to misinterpretations of signals and, ultimately, trading losses.
Don’t Over-rely on Gold RSI Overbought/Oversold
One of the most prevalent mistakes among novice traders is treating overbought and oversold RSI readings as infallible buy or sell signals in isolation. Simply observing the RSI entering overbought or oversold territory is not a guaranteed precursor to an immediate price reversal. It’s imperative to consider the overarching market context, including the prevailing trend direction, significant support and resistance levels, and any relevant fundamental factors, before acting solely on these signals. For instance, during a robust uptrend fueled by strong fundamental drivers, the RSI can remain in overbought territory for extended periods without necessarily signaling an imminent reversal.
Use Multi-Timeframe Analysis for Gold RSI
Failing to conduct multi-timeframe analysis when utilizing the RSI can lead to a myopic view of gold’s momentum. Analyzing the RSI across multiple timeframes, such as examining the daily and hourly charts concurrently, provides a more comprehensive and nuanced understanding of the prevailing trend. For example, if the daily RSI indicates a strong upward trend, but the hourly RSI is showing an overbought reading, it might suggest a short-term pullback or consolidation within the larger bullish trend, rather than a major reversal. This multi-faceted approach helps traders avoid making decisions that contradict the dominant trend on higher timeframes.
Pro Tip: Always strive to corroborate RSI signals with other forms of technical and fundamental analysis. Avoid treating the RSI as a standalone, infallible system. Instead, integrate it with price action analysis, the identification of chart patterns, and the assessment of other relevant indicators to develop a more robust and well-rounded trading strategy.
Opofinance Services
Looking for a reliable and regulated broker to trade gold and other assets? Opofinance, an ASIC-regulated broker, offers a secure and user-friendly trading environment.
- ASIC Regulation: Trade with confidence knowing Opofinance is regulated by the Australian Securities and Investments Commission (ASIC), a reputable financial authority.
- MT5 Platform: Opofinance is officially featured on the MT5 brokers list, providing access to the powerful MetaTrader 5 platform with advanced charting tools and indicators, including RSI.
- Social Trading: Learn from experienced traders and potentially copy their trades through Opofinance’s social trading features. This can be a valuable tool for both beginners and seasoned traders looking for new strategies.
- Safe and Convenient Deposits and Withdrawals: Enjoy a hassle-free experience with a variety of secure deposit and withdrawal methods.

Ready to explore the opportunities in gold trading? Visit opofinance.com to learn more and open an account today.
Conclusion: Maximizing Gold Profits with RSI
Mastering the application of the RSI for gold trading is an ongoing journey of continuous learning, diligent experimentation, and strategic refinement. It’s crucial to reiterate that a singular, universally “best” setting remains an elusive concept. The optimal RSI configuration is intrinsically linked to your individual trading style, the specific timeframe you are analyzing, and the prevailing market conditions. By diligently studying the intricacies of the RSI, skillfully combining it with other complementary technical analysis tools, and consciously avoiding common pitfalls, you can significantly enhance your ability to identify high-probability trading opportunities within the dynamic and often lucrative gold market.
Read More: What is RSI Indicator
Tips for Improving Your Gold RSI Strategy
- Consistent Gold RSI Backtesting: Make backtesting an integral part of your trading routine. Regularly test your RSI-based strategies on historical gold price data to objectively evaluate their performance and pinpoint areas where adjustments or improvements can be made.
- Stay Updated on Gold Market News: The gold market is in a constant state of flux, influenced by a multitude of global events. Stay informed about relevant market news, economic indicators, and geopolitical developments, and be prepared to adapt your strategies accordingly.
- Manage Risk When Trading Gold: Regardless of your confidence in your RSI signals or your trading strategy, always adhere to sound risk management principles. Employ appropriate position sizing, utilize stop-loss orders, and never risk more capital than you can comfortably afford to lose.
Key Takeaways
- The “best RSI settings for gold” are not fixed and are highly dependent on your individual trading strategy and the timeframe you are analyzing.
- For scalping strategies, consider employing shorter RSI periods (e.g., 7-9); for swing trading, the default 14-period often provides a solid foundation; and for long-term trading approaches, longer periods (e.g., 20-25) may be more suitable for filtering out noise.
- RSI divergence is a valuable tool for identifying potential trend reversals in gold prices, but always seek confirmation before acting on divergence signals.
- Combining the RSI with other technical indicators, such as moving averages and Bollinger Bands, can significantly enhance the accuracy and reliability of your trading signals.
- Avoid the common mistake of over-relying on overbought and oversold signals in isolation. Always consider the broader market context and the prevailing trend.
Can I use forex RSI settings for gold?
While there might be some overlap in the general principles of RSI application, gold possesses unique characteristics, including its volatility profile and responsiveness to specific macroeconomic factors, that differentiate it from many forex pairs. Therefore, it’s generally advisable to optimize your RSI settings specifically for gold, taking into account its distinct trading behavior. Experimenting with different periods and overbought/oversold levels tailored to gold’s nuances is crucial for achieving optimal results.
How often to adjust gold RSI settings?
You don’t need to be constantly tweaking your RSI settings. However, it’s prudent to periodically review their effectiveness, particularly if you observe significant shifts in market volatility or if you decide to adapt your trading strategy. Consider re-evaluating your settings every few months or whenever you notice a decline in the accuracy or reliability of the signals generated by your current RSI configuration.
Is RSI enough to trade gold?
No, relying solely on the RSI as your sole indicator is generally not recommended. While the RSI is undoubtedly a valuable and versatile tool, it functions best when used in conjunction with other forms of technical analysis. Integrating the RSI with price action analysis, the identification of chart patterns, trendlines, and potentially other complementary indicators provides a more holistic and robust view of the market, helping to confirm trading signals and leading to more informed and potentially profitable trading decisions.


