

Seeking to refine your 1-hour chart trading strategy for enhanced precision? Many traders find themselves searching for that extra edge to improve their entry and exit points. If you’re trading on the 1-hour timeframe, are you leveraging the Stochastic Oscillator to its fullest potential? The key to unlocking more consistent results could be optimizing your indicator settings. Specifically, understanding and implementing the best stochastic settings for 1 hour chart can significantly impact your trading outcomes.
This guide is designed to provide you with a clear path to mastering the stochastic settings for 1 hour chart. We will reveal the optimal stochastic settings for 1 hour trading and provide you with practical insights to elevate your technical analysis and trading decisions, especially when selecting a suitable forex broker. Discover how to fine-tune your Stochastic Oscillator for the 1-hour timeframe and start trading with greater confidence.
Understanding the Stochastic Oscillator
The Stochastic Oscillator is a vital momentum indicator in technical analysis. It’s designed to show the location of the current close relative to the high-low range over a set number of periods. This helps traders identify potential overbought or oversold conditions and anticipate possible shifts in market momentum. Its bounded nature makes it particularly effective for pinpointing market turning points.
What is Stochastic?
The Stochastic Oscillator is a bounded oscillator, ranging from 0 to 100. It’s based on the observation that in an uptrend, prices tend to close near their high, and in a downtrend, prices tend to close near their low. It uses two lines to generate trading signals:
The Stochastic Oscillator is calculated using these formulas:
%K = (Current Close – Lowest LowN) / (Highest HighN – Lowest LowN) * 100
%D = SMA(%K, M)
Where:
- N = Number of periods for %K calculation
- M = Number of periods for %D smoothing (using Simple Moving Average – SMA)
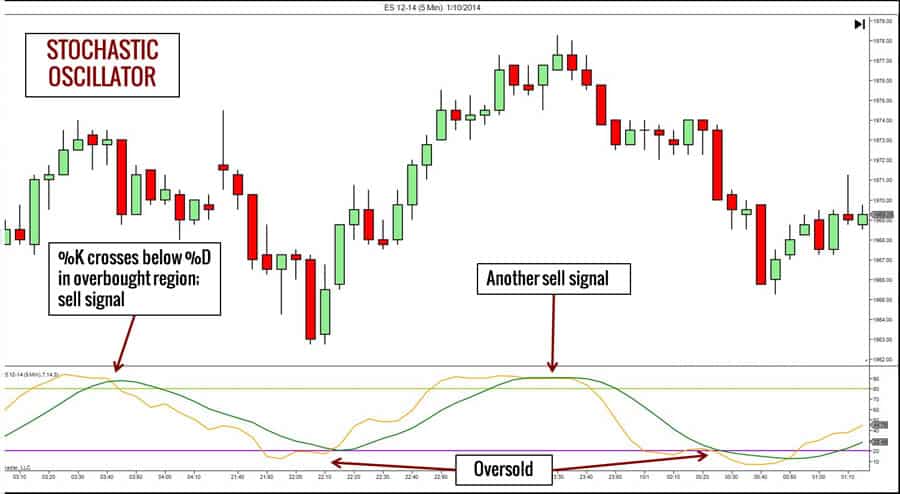
Traders interpret signals from crossovers between the %K and %D lines, as well as when these lines reach overbought (above 80) or oversold (below 20) levels.
Importance for 1-Hour Charts
The 1-hour chart is a popular timeframe for traders seeking a balance between short-term and medium-term analysis. It’s detailed enough to capture intraday movements while reducing the noise found in shorter timeframes. Using the Stochastic Oscillator on the 1-hour chart is particularly useful for identifying intraday momentum shifts and potential reversals, making it a valuable tool for hourly trading strategies. It helps refine entry and exit points, crucial for maximizing profits in a dynamic market.
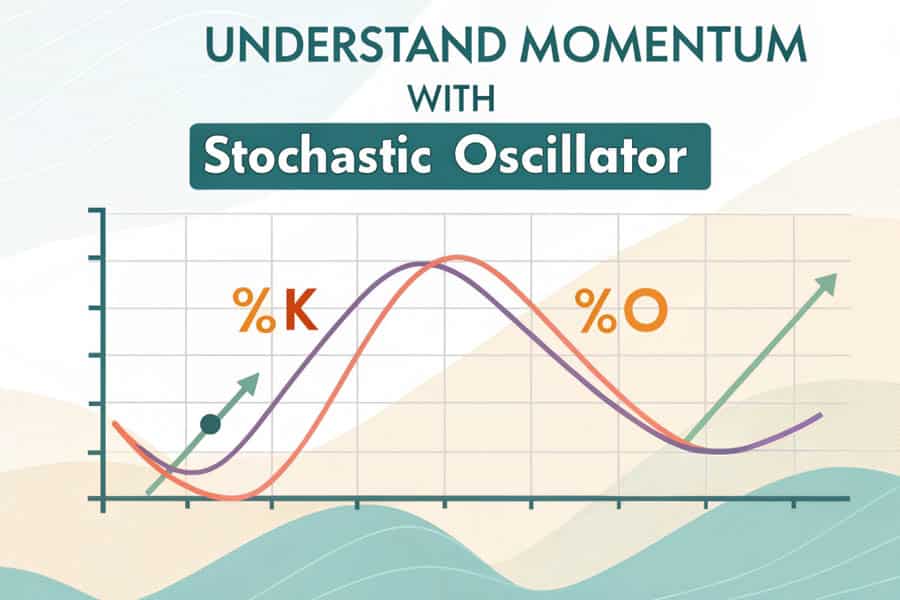
%K and %D Line Mechanics
The interaction of the %K and %D lines is central to interpreting the Stochastic Oscillator. The %K line, being the faster line, is more reactive to price changes, offering quicker, albeit potentially noisier, signals. The %D line, a smoothed moving average of %K, provides confirmation by filtering out some of the erratic movements of the %K line. Crossovers of %K and %D are key signals, indicating potential shifts in momentum, especially when considered alongside overbought and oversold conditions.
Read More: Stochastic Oscillator in Forex
Decoding Stochastic Oscillator Settings
To harness the Stochastic Oscillator effectively, understanding its settings is paramount. These settings dictate the indicator’s sensitivity and the nature of the trading signals it produces. The primary settings are the %K Period, %D Period (Smoothing), and Slowing Period, each playing a distinct role in shaping the oscillator’s behavior.
Key Parameter Explanation
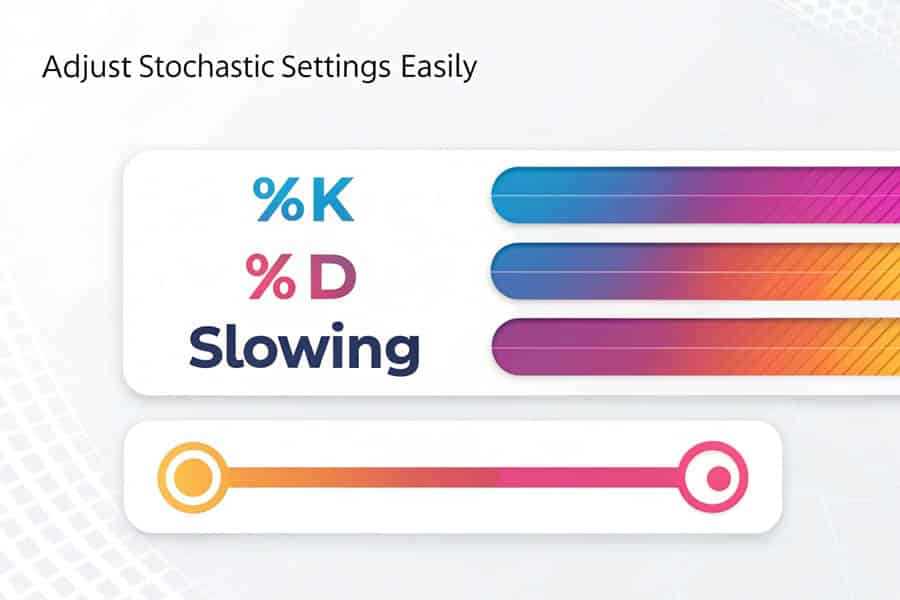
The Stochastic Oscillator’s behavior is controlled by three main parameters:
- %K Period: This parameter defines the lookback period for calculating the %K line. A shorter %K period makes the oscillator more sensitive to recent price changes, leading to faster reactions and potentially more frequent signals. Conversely, a longer %K period smooths the line, reducing sensitivity and noise.
- %D Period (Smoothing): This setting determines the period for the Simple Moving Average (SMA) applied to the %K line to create the %D line. A larger %D period results in a smoother %D line, which further reduces sensitivity and provides more stable, albeit potentially lagging, signals.
- Slowing Period: This optional setting adds an extra layer of smoothing directly to the %K calculation. A slowing period greater than 1 smooths the %K line before the %D line is calculated, making the oscillator less sensitive overall.
By adjusting these parameters, traders can tailor the Stochastic Oscillator to their specific trading style and the unique characteristics of the instruments they are trading.
Sensitivity vs. Reliability
Choosing the right stochastic settings involves balancing sensitivity and reliability. Highly sensitive settings, achieved with shorter %K periods and minimal smoothing, react quickly to price fluctuations, potentially providing early entry and exit signals. However, this heightened sensitivity can also increase the likelihood of false signals, especially in volatile or choppy market conditions.
More reliable settings, using longer %K periods and greater smoothing, filter out market noise and reduce false signals. While this improves signal accuracy, it may also delay signals, potentially causing traders to miss out on the very beginning of price movements. For 1-hour chart trading, the key is to find settings that are responsive enough to capture intraday opportunities while still being robust enough to avoid whipsaws and unreliable signals.
Optimal Stochastic Settings for 1 Hour Chart
Determining the best stochastic settings for 1 hour chart trading is essential for maximizing signal effectiveness and trading profitability. While no single setting is universally perfect, certain configurations are widely recognized for their strong performance on this timeframe. These recommended settings are designed to strike a balance between sensitivity and reliability, making them well-suited for a variety of 1-hour chart trading strategies.
Recommended and Optimized Settings
Two primary setting combinations are particularly effective for 1-hour chart analysis and optimization:
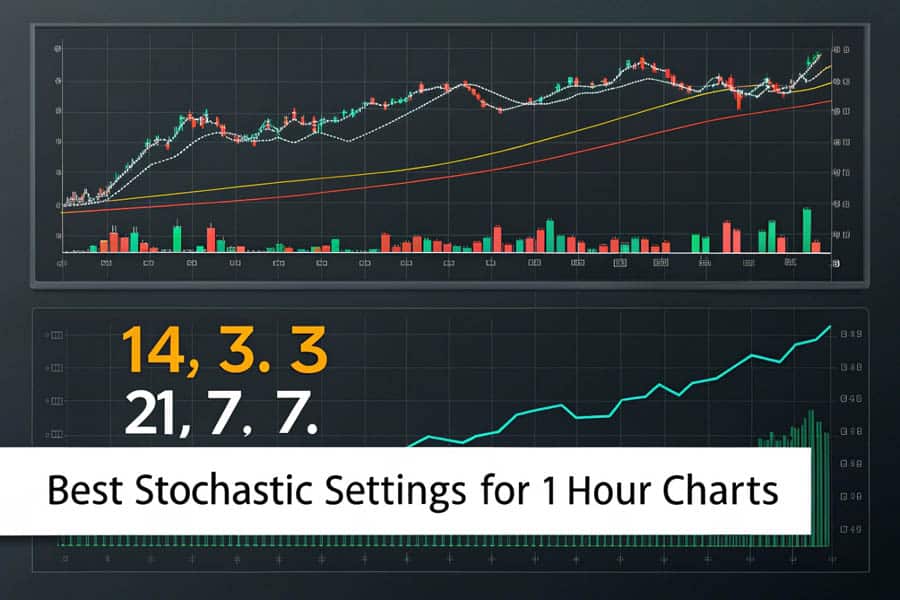
- 14, 3, 3 Configuration:
With a %K Period of 14, a %D Period of 3, and a Slowing Period of 3, these settings offer a balanced approach. The 14-period %K is responsive enough to capture intraday momentum shifts, while the 3-period smoothing for both %D and slowing helps to filter out some of the market noise without causing excessive signal delay. This configuration is a popular choice for day traders who need timely signals on the 1-hour chart.
- 21, 7, 7 Configuration:
Using a %K Period of 21, a %D Period of 7, and a Slowing Period of 7 results in a less sensitive but potentially more reliable oscillator. The longer 21-period %K and the increased smoothing with 7-period %D and slowing provide stronger noise filtering, leading to fewer false signals. While signals may be slightly less timely compared to the 14, 3, 3 settings, the 21, 7, 7 configuration can be advantageous in choppier markets or for swing traders who prefer higher-probability setups with fewer whipsaws on the 1-hour timeframe.
Why These Settings Excel on 1-Hour Charts
The effectiveness of these optimal stochastic settings for 1 hour trading is rooted in their suitability for the specific characteristics of the 1-hour timeframe. The %K periods of 14 and 21 are responsive enough to capture intraday momentum shifts that are relevant on the 1-hour chart, while also providing sufficient smoothing to filter out short-term noise. The smoothing provided by the %D and slowing periods is crucial for reducing false signals, which are more prevalent on shorter timeframes.
These settings strike a good balance between sensitivity and reliability, offering a useful frequency of trading signals without overwhelming traders with excessive noise. Furthermore, these settings are adaptable starting points that can be fine-tuned based on specific market conditions and individual trading styles, making them versatile for a range of stochastic indicator settings for 1 hour timeframe strategies. Market volatility should also be considered when choosing between these settings or further optimizing them.
Read More: 1-hour forex trading strategy
Volatility-Based Adjustments for Optimal Performance
To further optimize your stochastic settings for 1 hour chart trading, consider adjusting them based on prevailing market volatility. Different volatility regimes can significantly impact the performance of the Stochastic Oscillator, and tailoring your settings accordingly can enhance their effectiveness.
- High Volatility Markets:
In highly volatile markets, characterized by rapid and erratic price movements, it’s often beneficial to increase the %K period. A longer lookback period will smooth out the oscillator, making it less sensitive to short-term price spikes and reducing the number of false signals. Additionally, increasing the smoothing by using larger %D and slowing periods can further filter out noise and improve the reliability of signals in turbulent conditions. In such markets, focusing on divergence signals can be particularly useful, as they may indicate potential reversals even amidst high volatility.
- Low Volatility Markets:
Conversely, in low volatility, range-bound markets, you might want to decrease the %K period to increase the oscillator’s sensitivity. Shorter periods will make the Stochastic Oscillator more responsive to smaller price movements within the trading range. Reducing smoothing by using smaller %D and slowing periods can also help the oscillator react more quickly to subtle shifts in momentum. In these conditions, overbought and oversold levels become more relevant, as they can effectively signal potential reversals at the extremes of the trading range. More sensitive stochastic settings can help capture these range-bound opportunities.
Pro Tip: Monitor the Average True Range (ATR) indicator on your 1-hour chart to objectively assess market volatility. Higher ATR values indicate higher volatility, suggesting that you should consider using settings with more smoothing. Lower ATR values suggest lower volatility, potentially allowing for more sensitive settings to capture smaller price fluctuations.
Strategies for Balancing Sensitivity and Reliability
Finding the right balance between sensitivity and reliability is crucial when optimizing stochastic settings for 1-hour trading. Settings that are too sensitive can lead to an excess of false signals, resulting in whipsaws and increased trading costs, especially in choppy markets. On the other hand, settings that are too reliable may lag price action, causing you to miss early entry and exit opportunities and potentially reducing your profit potential. To achieve this balance, start with the recommended settings (14, 3, 3 or 21, 7, 7) and then incrementally adjust them based on observed market conditions.
Rigorously backtest any setting adjustments on historical 1-hour chart data and validate them through paper trading before deploying them in live markets. Be prepared to dynamically adapt your settings as market conditions change, as volatility regimes can shift rapidly. Regularly reassess and fine-tune your Stochastic Oscillator parameters to maintain optimal performance. This iterative process of adjustment and validation is key to tailoring your stochastic settings for 1 hour chart trading to your specific needs and market dynamics.
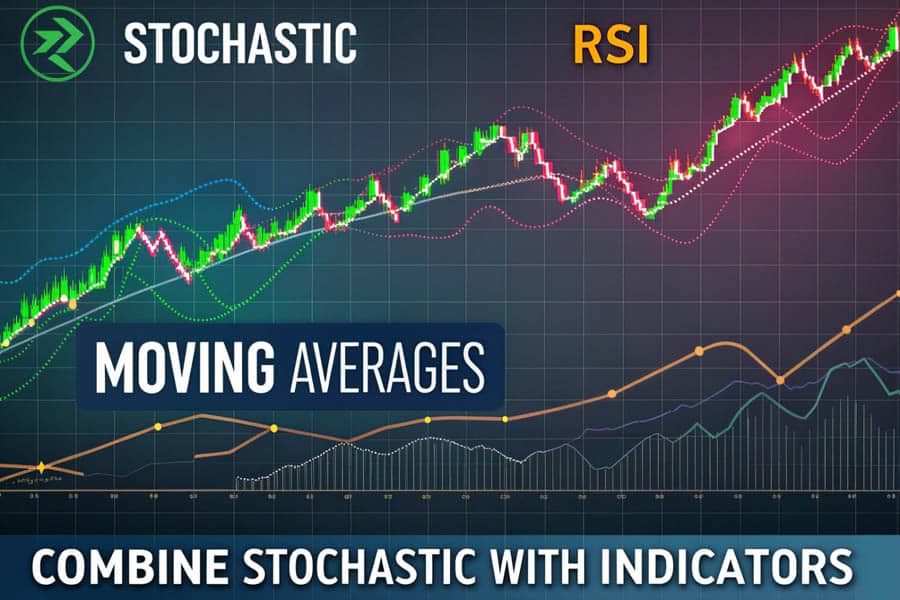
Combining Stochastic with Other Tools
To further enhance the effectiveness of your best stochastic settings for 1 hour chart trading, consider integrating the Stochastic Oscillator with other complementary technical indicators. This multi-indicator approach can provide stronger confirmation, filter out noise, and improve the overall reliability of your trading signals.
Using Complementary Indicators
Enhance the robustness of your Stochastic signals by combining them with the following complementary indicators:
- Moving Averages:
Incorporate moving averages, such as the 200-period Exponential Moving Average (EMA) for identifying the long-term trend and the 20-period EMA for short-term trend direction on the 1-hour chart. Use moving averages to filter Stochastic signals, taking only buy signals when the price is above relevant moving averages in an uptrend, and sell signals when the price is below moving averages in a downtrend. Moving average crossovers, like the 9 and 21 period EMA crossover, can further confirm trend direction and align with Stochastic signals for higher-conviction setups.
- Relative Strength Index (RSI):
Utilize the RSI to confirm overbought and oversold conditions identified by the Stochastic Oscillator. Look for confluence where both indicators signal similar conditions to increase signal reliability. Use RSI divergence to reinforce Stochastic divergence signals, as divergence across multiple momentum indicators can significantly increase the probability of a valid reversal. Assess momentum strength using RSI to validate Stochastic signals; stronger RSI readings can enhance the conviction of Stochastic signals, while weak RSI readings may warrant caution.
- Trendlines and Chart Patterns:
Combine Stochastic signals with trendline analysis to identify high-probability trading opportunities. Look for Stochastic buy signals near trendline support in uptrends and Stochastic sell signals near trendline resistance in downtrends. Use Stochastic signals to confirm chart patterns, such as triangles, flags, or head and shoulders, on the 1-hour chart. For example, a Stochastic buy signal occurring as price breaks out of a bullish chart pattern can provide strong confirmation. Validate breakouts above resistance or breakdowns below support with Stochastic confirmation to ensure that momentum is supporting the price movement, increasing the reliability of breakout trades.
Multi-Indicator Strategy Benefits
Employing multi-indicator strategies can significantly enhance the accuracy and reliability of Stochastic Oscillator signals on the 1-hour chart. By combining different types of indicators—momentum, trend, and volatility—you create a more robust and comprehensive trading approach. This approach helps filter out weaker signals and focuses your trading on higher-probability setups where multiple indicators converge to suggest a strong trading opportunity.
For example, a multi-indicator strategy might integrate a 200-period EMA to filter trades based on the long-term trend, the Stochastic Oscillator (14, 3, 3) to identify momentum shifts and overbought/oversold conditions, and the RSI (14-period) for additional confirmation of momentum and divergence. Adding volume analysis to confirm signal strength can further refine the strategy. Such integrated strategies provide a more holistic view of market dynamics, leading to improved signal accuracy and overall trading effectiveness on the 1-hour chart.
Read More: Best EMA Settings for 1 Hour Chart
Backtesting Stochastic Settings for 1 Hour Chart
Before you start trading with real money, backtesting your stochastic settings for 1 hour chart strategy is absolutely essential. Backtesting allows you to rigorously evaluate the historical performance of your chosen settings and trading strategies, providing you with crucial data on their potential profitability and risk characteristics.
Why Backtesting is Essential
Backtesting offers numerous critical benefits for traders:
- Performance Benchmarking: Backtesting enables you to quantify the historical profitability and win rate of your stochastic settings and trading strategy. This provides you with concrete performance metrics to assess their potential effectiveness.
- Risk Assessment: Through backtesting, you can evaluate key risk metrics such as potential drawdowns, maximum consecutive losses, and the overall risk profile associated with your trading approach. This allows for better risk management planning and position sizing.
- Setting Optimization: Backtesting provides a systematic way to experiment with different stochastic settings and parameters. You can test various configurations to identify the most effective settings for your specific markets and 1-hour timeframe strategies, leading to data-driven optimization.
- Strategy Validation: Backtesting helps validate the overall robustness of your trading strategy. By simulating historical trades, you can identify potential weaknesses or flaws in your strategy rules and make necessary improvements before risking real capital.
- Confidence Building: Gaining data-backed evidence of your strategy’s historical performance through backtesting builds confidence in your trading approach. This can reduce emotional biases and encourage more disciplined and consistent trade execution in live markets.
While it’s important to remember that backtesting is based on historical data and past performance is not necessarily indicative of future results, it remains an invaluable tool for data-driven strategy development and refinement. It provides empirical evidence to support your trading decisions and helps you approach live trading with greater preparation and confidence.
Tools and Effective Backtesting Methods
There are several tools and effective methods available for backtesting stochastic indicator settings for 1 hour timeframe strategies:
- Trading Platform Strategy Testers: Many advanced trading platforms, such as MetaTrader 5 and TradingView, offer built-in strategy testers. These tools allow you to automate the backtesting process by coding your trading strategy and running it on historical data. They typically provide detailed performance reports and metrics.
- Historical Data Replay: Some platforms offer historical data replay features that allow you to manually step through historical price action tick-by-tick or bar-by-bar. This enables manual backtesting, where you can visually assess how your strategy would have performed and make trading decisions as if you were trading in real-time.
- Spreadsheet Analysis: For simpler strategies or for initial exploratory backtesting, you can use spreadsheet programs like Excel or Google Sheets. Manually analyze historical 1-hour chart data, calculate Stochastic values based on different settings, identify trading signals according to your strategy rules, and simulate trades to track hypothetical performance and calculate basic metrics.
- Coding and Programming: For more sophisticated and automated backtesting, you can use programming languages like Python with specialized libraries such as `backtrader` or `zipline`. These tools offer greater flexibility and control over backtesting parameters and analysis. TradingView’s Pine Script language is also excellent for coding and backtesting strategies directly within the TradingView platform, offering a balance of ease of use and powerful features.
- Dedicated Backtesting Software: For traders who require advanced features, detailed analytics, and more sophisticated backtesting capabilities, dedicated backtesting software platforms like Forex Tester, Trading Blox, or AmiBroker are available. These platforms often offer features like variable spread simulation, slippage modeling, and comprehensive performance reporting.
To ensure effective backtesting, follow these best practices:
- Clearly define your trading strategy’s entry and exit rules based on Stochastic signals and any other confirmation criteria you plan to use. Ambiguous rules can lead to inconsistent backtesting results.
- Simulate realistic market conditions in your backtests by including historical spreads, slippage (the difference between expected and actual execution price), and commission costs. These factors can significantly impact net profitability.
- Use a sufficiently long historical data period for backtesting to capture a wide range of market conditions, including bull and bear markets, high and low volatility periods, and different economic cycles. A longer backtesting period provides a more robust assessment of your strategy’s performance.
- Implement walk-forward testing techniques to avoid overfitting your strategy to specific historical periods. Walk-forward testing involves optimizing your strategy on one portion of historical data and then testing its performance on a subsequent, unseen portion to assess its out-of-sample robustness.
- Track comprehensive performance metrics during backtesting, including win rate, profit factor, drawdown (peak-to-trough decline in equity), average profit per trade, maximum consecutive losses, and Sharpe ratio (risk-adjusted return). These metrics provide a holistic view of your strategy’s performance and risk profile.
- Adopt an iterative approach to backtesting. Treat backtesting as an ongoing process of refinement. Test your strategy, carefully analyze the results, identify areas for improvement, adjust your settings or strategy rules, and then re-backtest to see if the changes have improved performance. This iterative cycle of testing and refinement is key to developing a robust and profitable trading strategy.
By diligently backtesting your stochastic settings for 1 hour chart and trading strategies, you can significantly increase your understanding of their historical performance, identify potential weaknesses, and optimize your approach for more effective and confident 1-hour chart trading.
Opofinance: Your Regulated Forex Broker
For traders seeking a reliable and secure trading environment, Opofinance is a leading regulated forex broker choice. Officially recognized among mt5 brokers, Opofinance is ASIC regulated, providing a secure and transparent platform for your trading activities.
- ASIC Regulated Security: Trade with confidence knowing Opofinance is regulated by the Australian Securities and Investments Commission (ASIC), ensuring adherence to strict financial standards.
- Advanced MT5 Platform: Access the MetaTrader 5 platform, renowned for its sophisticated charting tools, algorithmic trading capabilities, and user-friendly interface.
- Social Trading Advantages: Leverage social trading features to learn from and potentially copy the trades of experienced traders, enhancing your trading knowledge and strategies.
- Safe Transactions: Benefit from safe and convenient deposit and withdrawal methods, ensuring seamless and secure management of your trading funds.
Enhance your forex trading experience with a trusted, regulated broker.

Conclusion: Mastering Stochastic for Hourly Trading Success
Mastering the Stochastic Oscillator with the best stochastic settings for your 1 hour chart is a journey that can significantly enhance your trading precision and potential profitability. By dedicating time to understand the nuances of the %K and %D lines, optimizing your settings for varying market volatility, and consistently applying robust trading strategies, you empower yourself to unlock the full potential of this versatile indicator. The path to successful 1-hour chart trading with the Stochastic Oscillator involves continuous learning, adaptation, and disciplined practice. Embrace this journey, and you can confidently navigate the markets with greater insight and achieve your trading goals.
Key Summary
To effectively leverage stochastic settings for 1 hour chart trading, remember these essential points:
- Stochastic Fundamentals: Understand the core principles of the Stochastic Oscillator, including the %K and %D lines and their relationship to price momentum and overbought/oversold conditions.
- Setting Optimization: Utilize recommended starting settings like 14, 3, 3 and 21, 7, 7 as robust baselines. Adapt settings based on market volatility—increase periods for high volatility, decrease for low volatility to maintain responsiveness.
- Practical Application: Skillfully implement your chosen settings on your trading platform and accurately interpret buy/sell signals generated by %K/%D crossovers and overbought/oversold levels.
- Confirmation is Essential: Always prioritize seeking confirmation from price action, chart patterns, and complementary indicators to validate Stochastic signals and effectively filter out false signals.
- Backtesting Imperative: Rigorously backtest your stochastic settings and trading strategies to comprehensively evaluate historical performance and optimize your approach based on empirical data.
- Multi-Indicator Synergy: Enhance signal accuracy and reliability by strategically combining the Stochastic Oscillator with moving averages, RSI, or trendlines for a more holistic market analysis.
- Continuous Learning and Adaptation: Recognize that the market is dynamic. Commit to continuous learning, be adaptable in your strategies, and consistently refine your stochastic indicator settings for 1 hour timeframe to stay ahead of evolving market conditions.
Are there specific times of day when Stochastic Oscillator is more effective on the 1-hour chart?
Yes, the Stochastic Oscillator’s effectiveness on the 1-hour chart can vary with trading sessions. Higher liquidity and volatility periods, like the London-New York overlap (8:00 AM to 12:00 PM EST), often yield more reliable signals due to increased price action. Conversely, low liquidity sessions may produce choppier conditions and less consistent signals. Backtesting across different sessions is recommended to understand performance variations and adjust trading approaches accordingly.
Can I use Stochastic Oscillator effectively in trending and ranging markets on the 1-hour chart?
Yes, the Stochastic Oscillator is versatile for both trending and ranging markets on the 1-hour chart. In trends, it helps identify pullbacks for entries, while in ranges, it signals reversals at range boundaries. Adjust strategy to focus on crossovers in trends and overbought/oversold levels in ranges for optimal use in different market conditions.
What are some common mistakes traders make when using Stochastic Oscillator on the 1-hour chart?
Common mistakes include over-relying on isolated Stochastic signals without confirmation, ignoring market context like trend and support/resistance, failing to adjust settings for volatility changes, and neglecting risk management. Avoiding these pitfalls through comprehensive analysis, disciplined trading, and continuous learning is essential for effective Stochastic Oscillator usage.


