

Tired of missing out on those lightning-fast profit opportunities in the 1-minute trading arena? You see the price flickering, the potential for quick gains, but pinpointing the perfect entry and exit feels like chasing a ghost. The secret weapon many traders are turning to is the stochastic oscillator. And the key to unlocking its power on these ultra-short timeframes lies in the settings. So, what are the best stochastic settings for 1 minute trading? This article dives deep, providing you with the insights to fine-tune your stochastic oscillator, identify those fleeting moments of opportunity, and potentially sharpen your edge with your chosen regulated forex broker.
Understanding the Stochastic Oscillator for Scalping
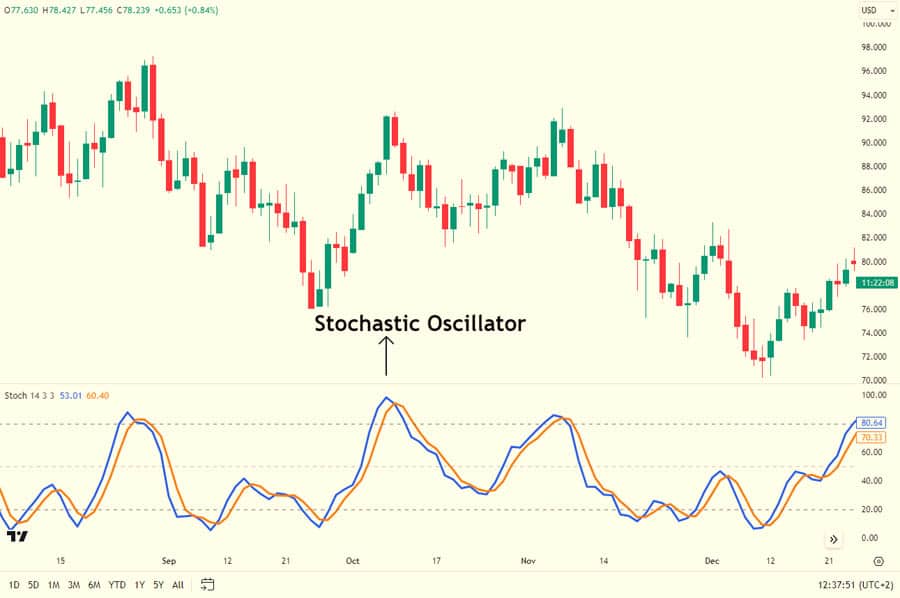
Before we jump into specific numbers, let’s solidify why the stochastic oscillator is a go-to tool for traders focused on the rapid movements of 1-minute charts. This momentum indicator works by comparing a security’s closing price to its price range over a defined period. Essentially, it reveals where the current price sits within its recent high-low spectrum. In the blink-and-you’ll-miss-it world of 1-minute trading, this relative positioning can be incredibly valuable for spotting potential turning points.
The Power of Relative Price Positioning
Think about it: when prices are trending strongly upwards, they tend to close near the high of their recent range. Conversely, in a downtrend, closing prices often hover near the low. The stochastic oscillator is designed to capture this behavior, giving you potential early warnings of overbought or oversold conditions – signals that are amplified in the compressed timeframe of a 1-minute chart.
Key Stochastic Settings for 1-Minute Charts

The stochastic oscillator isn’t a one-size-fits-all tool. Its behavior is governed by three primary settings, each acting as a lever to adjust its sensitivity and responsiveness. Understanding these settings is crucial to tailoring the indicator to the specific demands of 1-minute trading.
%K Period: Setting the Lookback Window
The %K period is the engine of the stochastic oscillator. This setting dictates the number of periods the indicator looks back to calculate the initial raw stochastic value. A shorter %K period means the oscillator will react more swiftly to recent price changes, generating more frequent signals. Conversely, a longer period smooths out the oscillator’s movements, leading to fewer, potentially more stable signals.
Finding the Right %K for Speed
For the rapid-fire environment of 1-minute trading, a shorter %K period is generally favored to capture those quick bursts of momentum. However, setting it too low can introduce excessive noise and an abundance of false signals. The challenge lies in finding the optimal balance – a setting that’s responsive enough to catch the moves but not so sensitive that it’s whipsawed by every minor price fluctuation.
%D Period: Smoothing for Clarity
The %D period acts as a smoothing mechanism for the %K line. It’s calculated as a Simple Moving Average (SMA) of the %K values over the specified period. This smoothing helps to filter out some of the erratic, short-term movements of the %K line, making it easier to discern the underlying trend and potentially reducing the number of misleading crossovers.
Balancing Responsiveness with Filtering
A longer %D period will result in a smoother %D line, further reducing the oscillator’s sensitivity. For 1-minute charts, the goal is to strike a balance. You want enough smoothing to cut through the noise but not so much that you miss timely entry and exit points. The %D line should help confirm the signals given by the %K line, not lag so far behind that the opportunity is gone.
Slowing: Fine-Tuning the Signal
The slowing setting provides an additional layer of smoothing, specifically applied to the %K line before the %D is calculated. A slowing value of 1 effectively turns the oscillator into a “fast stochastic,” making it highly sensitive to price changes. Increasing the slowing value smooths the %K line, creating a “slow stochastic” with fewer and potentially more reliable signals.
Optimizing Slowing for Quick Decisions
In the context of 1-minute trading, where decisions need to be made in seconds, a lower slowing value is often preferred. This keeps the oscillator more responsive to immediate price action, allowing you to react quickly to potential trading opportunities. However, as with the %K period, going too low can increase the risk of false signals.
Read More: 1 minute forex trading strategy
Popular Stochastic Settings for 1-Minute Trading
Now, let’s get down to brass tacks. While the “best” settings can be subjective and depend on factors like the specific currency pair or asset you’re trading and your individual trading style, certain combinations have gained popularity among 1-minute chart enthusiasts. Remember, thorough testing and backtesting are crucial to finding what works best for you.
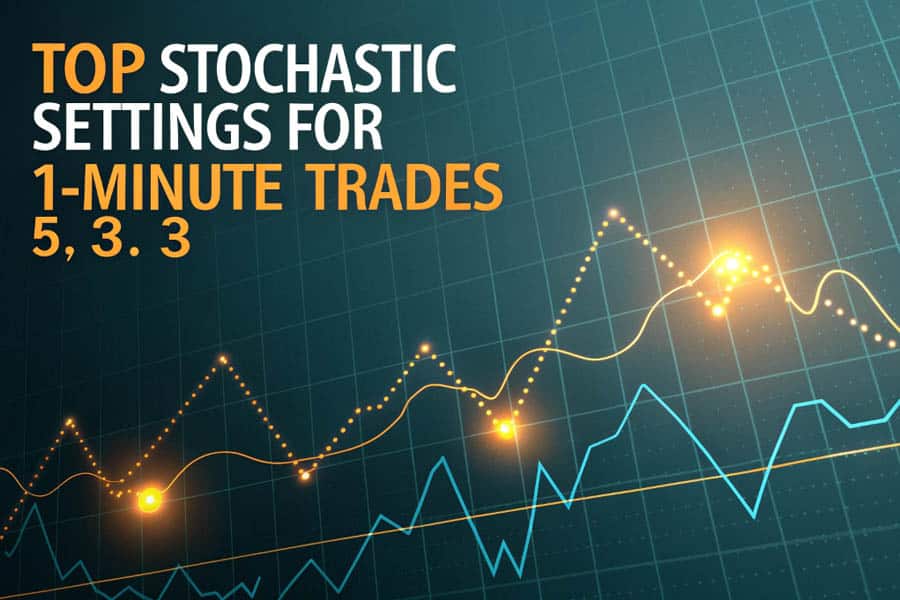
The Balanced Approach: 5, 3, 3
A widely used starting point is a %K period of 5, a %D period of 3, and a slowing value of 3. This combination aims to provide a good balance between capturing short-term momentum and filtering out some of the inherent noise on a 1-minute chart. The relatively short %K period allows the oscillator to react promptly to price shifts, while the smoothing from the %D and slowing values helps to provide a degree of confirmation.
Visualizing the 5, 3, 3 in Action
Imagine a scenario where the price starts to climb. With these settings, the stochastic oscillator will likely rise relatively quickly, potentially signaling an overbought condition sooner than with longer settings. This could alert you to a potential selling opportunity as the upward momentum begins to wane.
The High-Speed Option: 3, 3, 3
For traders who prioritize speed and are comfortable with a higher frequency of signals, a %K period of 3, with both the %D period and slowing value set at 3, can be considered. This configuration makes the oscillator highly reactive to even the smallest price fluctuations, potentially allowing you to capitalize on very short-term momentum shifts. However, be aware that this increased sensitivity also comes with a higher risk of encountering false signals. Disciplined risk management is paramount when using such aggressive settings.
Catching Fleeting Moments with 3, 3, 3
Think of trying to catch the crest of a tiny wave. This faster setting is designed to identify those immediate, fleeting movements in price. It requires quick decision-making and a strong understanding of market dynamics.
The Smoother Perspective: 10, 3, 3
If you find that the 5, 3, 3 setting still generates too many signals that don’t pan out, or if your trading style favors a more conservative approach, consider increasing the %K period to 10 while keeping the %D period and slowing value at 3. This will smooth out the oscillator’s movements, resulting in fewer but potentially more reliable signals. While you might miss some of the very earliest moves, you could also avoid being whipsawed by short-term volatility.
Waiting for Confirmation with 10, 3, 3
This approach is akin to waiting for a slightly larger wave to form before paddling out. You’re seeking more confirmation of a sustained move, potentially sacrificing some early entry opportunities for a higher probability of success on the trades you do take.
Implementing Stochastic Settings in Your 1-Minute Strategy
Simply having the right settings configured on your charting platform is only half the battle. You need a well-defined strategy to interpret the signals generated by the stochastic oscillator and integrate them into your trading decisions.
Leveraging Overbought and Oversold Levels
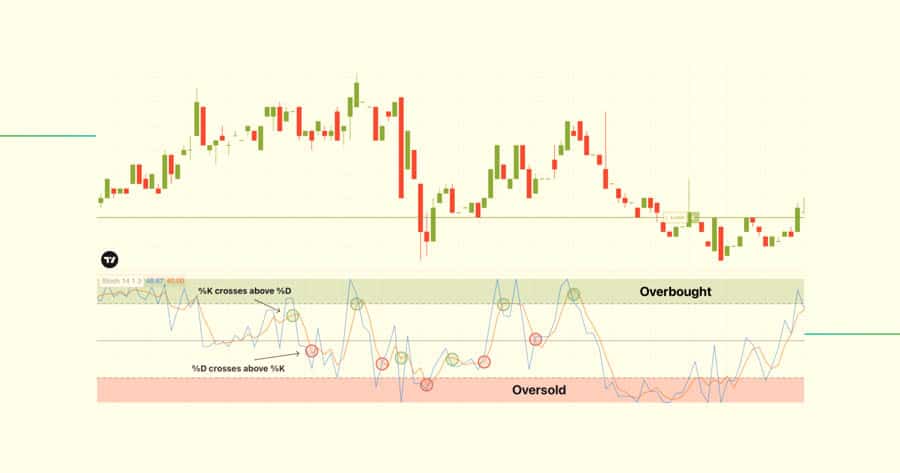
The most fundamental way to utilize the stochastic oscillator is to identify potential overbought and oversold conditions. Generally, when the oscillator’s lines rise above the 80 level, it suggests the asset may be overbought and ripe for a potential pullback. Conversely, when the lines fall below the 20 level, it indicates a possible oversold condition and a potential bounce. On a 1-minute chart, these signals can be incredibly short-lived, requiring swift action.
Acting on Overbought/Oversold Signals
On a 1-minute chart, look for the %K line to cross below the 80 level from above as a potential sell signal. Conversely, watch for the %K line to cross above the 20 level from below as a potential buy signal. Remember that these are just potential signals and should be considered in the context of other factors.
Utilizing %K and %D Crossovers
Another powerful signal generated by the stochastic oscillator is the crossover between the %K and %D lines. When the faster %K line crosses above the slower %D line, it suggests that upward momentum is building and can be interpreted as a potential buy signal. Conversely, when the %K line crosses below the %D line, it indicates strengthening downward momentum and a potential sell signal. On a 1-minute chart, these crossovers can provide timely entry and exit points, particularly when they align with overbought or oversold conditions.
Confirming Momentum Shifts with Crossovers
These crossovers can act as confirmation of a potential trend change. For example, if the oscillator is in oversold territory and the %K line crosses above the %D line, it can provide a stronger buy signal than just the oscillator entering oversold territory alone.
Identifying Divergence for Potential Reversals
Divergence occurs when the price action of an asset and the movement of the stochastic oscillator disagree. For instance, if the price is making new lower lows, but the stochastic oscillator is forming higher lows, this is known as bullish divergence. It suggests that the selling pressure might be weakening and a potential upward reversal could be on the horizon. Conversely, bearish divergence occurs when the price makes new higher highs, but the stochastic oscillator makes lower highs, hinting at potential downward pressure.
Spotting Early Reversal Signs
Identifying divergence on a 1-minute chart can be challenging due to the rapid price fluctuations, but it can also be highly rewarding. It can provide early warnings of potential turning points before they become obvious to most traders.
Read More: Stochastic Oscillator in Forex
Pro Tips for Advanced Stochastic Trading on 1-Minute Charts
Ready to elevate your 1-minute stochastic trading skills? Here are some advanced techniques to consider:
- Combine with Price Action Analysis: Never rely solely on the stochastic oscillator. Look for confluence with price action patterns, such as candlestick formations (e.g., engulfing patterns, dojis) or key support and resistance levels. A stochastic buy signal occurring near a significant support level adds considerable weight to the potential trade.
- Employ Multiple Timeframe Analysis: While your primary focus is the 1-minute chart, take a quick glance at higher timeframes, such as the 5-minute or 15-minute chart, to gain a broader perspective on the prevailing trend. Trading in the direction of the higher timeframe trend can significantly increase your probability of success.
- Experiment Across Different Assets: The optimal stochastic settings can vary slightly depending on the inherent volatility and trading characteristics of the specific asset you’re trading. Dedicate time to backtest different settings for each asset you trade regularly to identify what yields the best results.
- Avoid Overtrading Pitfalls: The sheer volume of signals generated on a 1-minute chart, especially with more sensitive stochastic settings, can be tempting. Resist the urge to overtrade. Be highly selective with your trades, adhering strictly to your predefined trading strategy and risk management rules.
- Master the Art of Risk Management: Given the rapid pace of 1-minute trading, having meticulously defined stop-loss orders is absolutely critical to protect your trading capital. Don’t let a few quick losses wipe out your gains.
Navigating the Emotional Landscape of 1-Minute Trading
Let’s face it, trading on 1-minute charts can be an emotionally charged experience. The rapid-fire price movements can trigger a range of emotions, from exhilaration and greed to fear and anxiety. Maintaining emotional discipline is paramount to avoid making impulsive decisions that can derail your trading plan. Your carefully chosen stochastic settings are designed to provide objective signals, not to fuel emotional trading.
Staying Grounded in the Fast Pace
Imagine the adrenaline rush of entering a trade based on a perfect stochastic signal, only to see the price momentarily move against you. This is where emotional control becomes crucial. Trust in your backtested strategy and avoid the temptation to prematurely exit a trade based on fear or panic.
The Indispensable Role of Backtesting
Before committing real capital to your 1-minute trading endeavors, rigorous backtesting of your chosen stochastic settings and trading strategies is absolutely essential. Backtesting involves analyzing historical price data to simulate how your strategy would have performed in the past. While past performance is not a guarantee of future results, backtesting provides invaluable insights into the potential strengths and weaknesses of your approach and allows you to fine-tune your settings for optimal performance.
Your Practice Ground for Success
Think of backtesting as your personal practice arena. It allows you to refine your technique, identify potential flaws in your strategy, and build confidence in your approach before venturing into the live trading environment.
Read More: Best ema settings for 1 minute chart
Opofinance Services: Empowering Your Trading Journey
Success in the demanding world of 1-minute trading requires not only the right tools and strategies but also a reliable and trustworthy broker. Consider Opofinance, an ASIC-regulated broker dedicated to providing a secure and efficient trading environment for traders of all levels.
- ASIC Regulation for Enhanced Security: Trade with the assurance that you are partnering with a broker that adheres to stringent regulatory standards, prioritizing the safety of your funds.
- Official MT5 Platform Listing: Gain access to the industry-leading MetaTrader 5 platform, a favorite among experienced traders for its powerful charting tools and execution capabilities.
- Secure and Convenient Transactions: Enjoy peace of mind with safe and convenient deposit and withdrawal methods, allowing you to focus entirely on your trading activities.
- Explore the Benefits of Social Trading: Potentially enhance your trading knowledge and connect with a community of traders through Opofinance’s social trading features, gaining valuable insights that can complement your stochastic-based strategies.

Ready to take your 1-minute trading to the next level? Explore the advantages of trading with Opofinance today.
Step-by-Step Guide to Setting Up Stochastic on Different Platforms
For those new to using the stochastic oscillator, here’s a quick guide on how to add and configure it on some popular trading platforms:
MetaTrader 4 & MetaTrader 5
- Open your Charts: Launch your MetaTrader platform and open the chart for the asset you wish to trade.
- Insert Indicators: Click on “Insert” in the top menu, then hover over “Indicators,” then “Oscillators,” and select “Stochastic Oscillator.”
- Configure Settings: A window will appear allowing you to customize the settings.
- %K period (%K): Enter your desired value (e.g., 5, 3, or 10).
- %D period (%D): Enter your desired value (e.g., 3).
- Slowing: Enter your desired value (e.g., 3).
- You can also customize the colors and levels (e.g., 20 and 80 for oversold and overbought).
- Click “OK”: The stochastic oscillator will now appear at the bottom of your chart.
TradingView
- Open your Chart: Go to TradingView and open the chart for your desired asset.
- Indicators Button: Click on the “Indicators” button at the top of the chart (it looks like an “fx”).
- Search for Stochastic: In the search bar, type “Stochastic” and select the “Stochastic RSI” or “Stochastic” indicator (standard stochastic).
- Access Settings: Once added, hover over the indicator name at the top-left of your chart and click the “Settings/Gear” icon.
- Adjust Inputs: In the “Inputs” tab, you can adjust:
- %K Length: This corresponds to the %K Period.
- %D Smoothing: This corresponds to the %D Period.
- K Smoothing: This corresponds to the Slowing value.
- Customize Style: In the “Style” tab, you can change the colors of the %K and %D lines and the overbought/oversold levels.
- Click “OK”: Your customized stochastic oscillator will now be displayed.
Troubleshooting Common Issues with Stochastic on 1-Minute Charts
Using the stochastic oscillator on a 1-minute chart can present unique challenges. Here’s how to address some common issues:
Too Many False Signals
The Problem: With highly sensitive settings or in volatile market conditions, the stochastic oscillator on a 1-minute chart can generate a barrage of signals that don’t lead to profitable trades, resulting in whipsaws and frustration.
Solutions:
- Increase Smoothing: Consider increasing the %D period or the Slowing value to smooth out the oscillator and reduce sensitivity to minor price fluctuations.
- Higher %K Period: Experiment with a slightly longer %K period to make the oscillator less reactive to short-term noise.
- Confirmation is Key: Don’t act on stochastic signals in isolation. Look for confirmation from price action patterns (e.g., candlestick patterns, breakouts), support and resistance levels, or other indicators.
- Filter with Trend: Only take buy signals when the overall trend (on a slightly higher timeframe) is up, and sell signals when the trend is down.
Lagging Signals
The Problem: If your stochastic settings are too smooth, the signals might appear too late, causing you to miss the initial part of a move or enter when the momentum is already fading.
Solutions:
- Reduce Smoothing: Try decreasing the %D period or the Slowing value to make the oscillator more responsive.
- Shorter %K Period: Experiment with a shorter %K period to capture momentum shifts earlier. Be cautious, as this can increase false signals.
- Focus on Crossovers: Pay close attention to the %K and %D line crossovers, as these can sometimes provide earlier signals than waiting for overbought/oversold levels to be reached.
Difficulty Identifying Divergence on Such a Short Timeframe
The Problem: The rapid price fluctuations on a 1-minute chart can make it challenging to accurately identify divergence patterns, as the oscillator and price action can appear erratic.
Solutions:
- Focus on Clear Divergence: Only consider divergence patterns that are very clear and pronounced. Avoid trying to interpret subtle or ambiguous divergence.
- Use Higher Timeframe Confirmation: If you spot potential divergence on the 1-minute chart, check if a similar pattern is forming on a slightly higher timeframe (e.g., 5-minute). This can add more weight to the signal.
- Combine with Price Action: Look for price action confirmation of the divergence. For example, in the case of bullish divergence, wait for a break above a recent high.
- Practice and Patience: Identifying divergence on short timeframes requires practice. Don’t get discouraged if you find it difficult initially. Review charts and analyze past instances of divergence to improve your skills.
Conclusion: Mastering the Stochastic for 1-Minute Gains
Identifying the best stochastic settings for 1 minute trading is an ongoing process of exploration and refinement. While the popular 5, 3, 3 configuration offers a solid foundation, don’t hesitate to experiment and discover the settings that best align with your individual trading style and the specific characteristics of the assets you trade. Remember that the stochastic oscillator is a valuable tool, but it’s just one component of a successful trading strategy. Combine it with robust risk management, a well-defined trading plan, and unwavering emotional discipline to navigate the exciting, yet challenging, landscape of 1-minute charts.
Key Takeaways
- The stochastic oscillator is a powerful momentum indicator for capturing quick profits in 1-minute trading.
- Key settings to understand are the %K period (sensitivity), %D period (smoothing), and the slowing value.
- Popular starting settings include 5, 3, 3 (balanced), 3, 3, 3 (highly sensitive), and 10, 3, 3 (smoother).
- Utilize overbought and oversold levels, %K and %D crossovers, and divergence to generate trading signals.
- Always combine stochastic signals with price action analysis and consider the trend on higher timeframes.
- Thorough backtesting is crucial for optimizing your settings and validating your trading strategy.
- Emotional control and strict risk management are essential for success in the fast-paced environment of 1-minute trading.
Can I use the stochastic oscillator on other timeframes besides the 1-minute chart?
Yes, the stochastic oscillator is a versatile indicator that can be applied to various timeframes, from intraday charts like the 5-minute or 15-minute to daily and weekly charts. However, the optimal settings may need to be adjusted depending on the timeframe. Longer timeframes generally benefit from longer %K periods for smoother signals, while shorter timeframes often use shorter periods for increased sensitivity.
How do I add the stochastic oscillator to my trading platform?
Most modern trading platforms, such as MetaTrader 4 and MetaTrader 5, come with the stochastic oscillator as a built-in indicator. Typically, you can find it in the “Indicators” menu under “Oscillators.” Once selected, you can customize the %K period, %D period, and slowing settings to your desired values.
What are some common mistakes traders make when using the stochastic oscillator on 1-minute charts?
A common mistake is relying solely on the stochastic oscillator without considering other factors like price action or the overall trend. Another pitfall is using overly sensitive settings that generate too many false signals, leading to whipsaws and losses. Failing to backtest different settings and strategies is also a frequent error. Finally, emotional trading, reacting impulsively to every signal without a clear plan, can be detrimental.


