

Finding a reliable trend in the chaotic, fast-paced world of scalping can feel like trying to catch lightning in a bottle. You need precision, speed, and clarity. The wrong tools lead to hesitation and, ultimately, losses. The single best trend indicator for scalping is the Exponential Moving Average (EMA), specifically used in a crossover system, because it prioritizes recent price action, reducing lag. However, no indicator is a magic bullet. This guide moves beyond simple lists to show you how to combine powerful indicators, find the right settings, and build a robust strategy. Whether you’re with an online forex broker or trading crypto, mastering these tools is your key to identifying strong, short-term trends for more profitable scalps.
Key Takeaways
- No Holy Grail: The most effective approach is not a single indicator but a combination of indicators for trend confirmation and momentum.
- EMAs are King for Speed: Exponential Moving Averages (EMAs) are often considered the best foundational trend indicator for scalping due to their responsiveness to recent price changes.
- Context is Crucial: The effectiveness of an indicator heavily depends on the correct settings, the specific market (forex, crypto, stocks), and the timeframe being traded (e.g., 1-minute or 5-minute).
- Price Action First: Indicators should confirm what price action is already suggesting, not be the sole reason for a trade.
- Risk Management is Non-Negotiable: Even the best strategy will fail without strict stop-loss and take-profit rules.
What Makes an Indicator Good for Scalping?
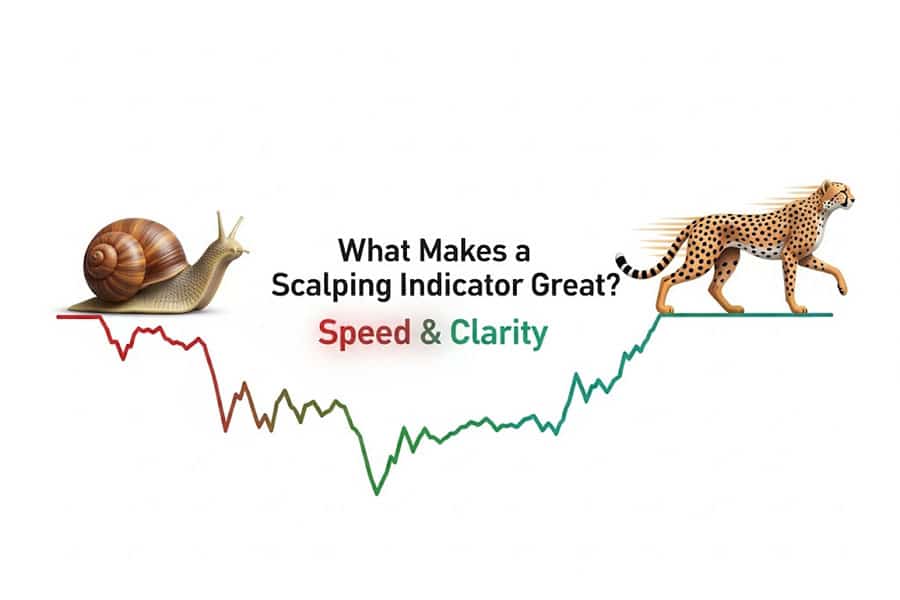
Before diving into the list, it’s essential to understand the criteria. An indicator that works beautifully on a daily chart can be disastrous for a scalper. The high-speed nature of scalping demands specific characteristics from your tools. In my experience, focusing on these three pillars separates winning indicators from the noisy ones.
Responsiveness
Scalping happens on razor-thin margins. An indicator must react to price changes almost instantly. It needs to give more weight to the most recent data to be relevant on a 1-minute chart. This is why lagging indicators, while useful for long-term trends, can be a scalper’s worst enemy.
Clarity
The market moves too fast for you to second-guess your tools. A good scalping indicator provides clean, unambiguous signals. When a signal to buy or sell appears, it should be obvious and require minimal interpretation. Visual simplicity is a massive advantage.
Minimal Lag
This is closely related to responsiveness but deserves its own mention. Lag is the delay between a price move and the indicator signaling that move. For a scalper aiming for a few pips, a lagging signal means you’ve already missed the best entry point, drastically altering your risk-to-reward ratio.
Read More: Mastering scalping in forex
The Top Trend Indicators for Scalping
Here we explore the most effective and widely-used indicators for scalping. I’ll break down not just what they are, but provide practical settings and strategies that I’ve found to be effective in live markets. Remember, the goal is to find the best trend indicator for scalping that fits your personal style.
Exponential Moving Average (EMA)
The EMA is a staple for a reason. Unlike a Simple Moving Average (SMA) that gives equal weight to all data points in its period, the EMA gives more weight to the most recent price action. This makes it react faster, which is exactly what a scalper needs.
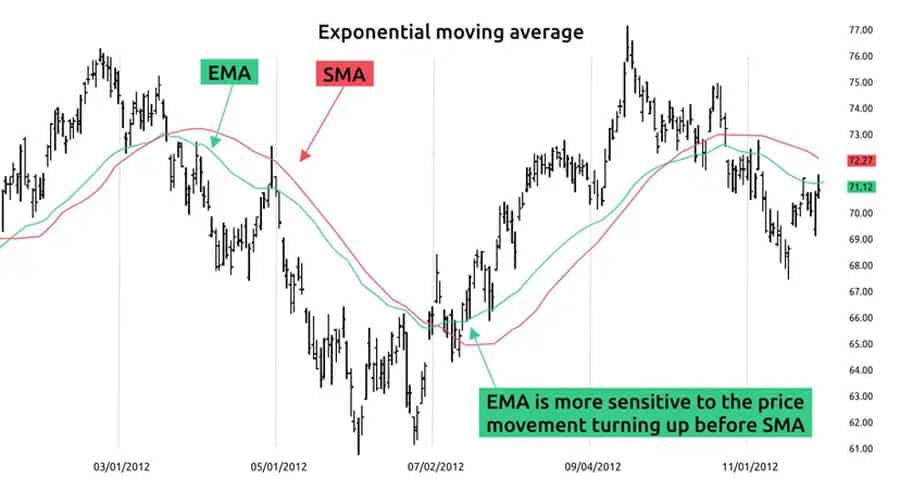
- Why It’s Great for Scalping: Its primary advantage is reduced lag. When you’re on a 1-minute or 5-minute chart, you need to see shifts in trend and momentum as they happen, not several candles later. The EMA delivers this speed.
- Best Settings for Scalping: There’s no single perfect setting, but a common and effective approach is using a two or three-EMA crossover system. A popular combination for 1-minute scalping is the 9-EMA and 21-EMA. For 5-minute charts, some traders prefer slightly wider settings like the 13-EMA and 26-EMA.
- The Strategy in Action:
- Entry Signal: A common entry signal is the crossover. For a long (buy) trade, you would enter when the shorter-period EMA (e.g., 9-EMA) crosses decisively above the longer-period EMA (e.g., 21-EMA). The opposite is true for a short (sell) trade.
- Exit Signal: An exit can be triggered when the EMAs cross back in the opposite direction or when the price closes firmly on the other side of the shorter-period EMA.
Chart Example: Picture a 1-minute chart for EUR/USD. The 9-EMA (a thin blue line) crosses up and over the 21-EMA (a slightly thicker orange line). Two candles later, a small pullback touches the 9-EMA and bounces off it. This is a high-probability entry. Your stop-loss would be placed just below the recent swing low that formed before the crossover.
Parabolic SAR (PSAR)
The Parabolic Stop and Reverse (SAR) is brilliant for its visual simplicity. It places dots on your chart either above or below the price candles, providing instant insight into trend direction and potential reversals.
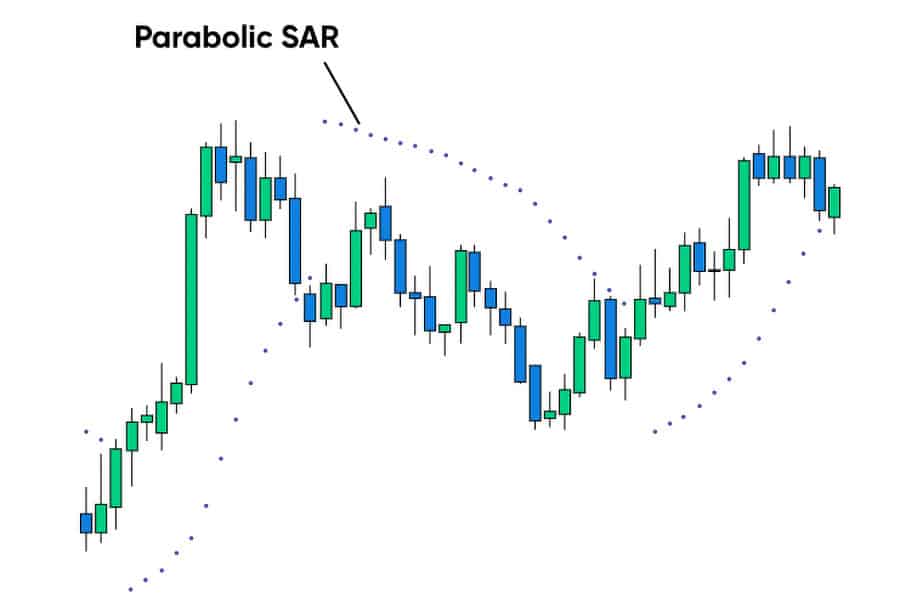
- Why It’s Great for Scalping: It’s incredibly straightforward. Dots below the price mean the trend is bullish; dots above mean it’s bearish. This removes ambiguity and allows for lightning-fast decisions, a key requirement when looking for the best trend indicator for scalping.
- Best Settings for Scalping: The default settings (0.02 step, 0.2 maximum) are often a good starting point. However, for the extreme speed of 1-minute scalping, some traders tighten the settings to a 0.01 step to make it even more sensitive to price changes, though this can increase the number of false signals.
- The Strategy in Action:
- Entry Signal: The simplest entry is when the dots flip. For a long entry, you’d buy when the dots move from above the price to below it. For a short entry, you’d sell when the dots flip from below the price to above it.
- Exit Signal: The PSAR provides a built-in exit mechanism. You simply stay in the trade until the dots flip to the opposite side. This dynamic stop-loss trails the trend for you.
Chart Example: On a 5-minute chart of Tesla (TSLA), you observe three consecutive red candles. The PSAR dots are clearly printed above each candle. Then, a strong green candle forms, and on the next candle, the first dot appears below the price. This flip is your entry signal for a long position. Your initial stop-loss is the PSAR dot itself.
Supertrend Indicator
As the name suggests, the Supertrend is designed to identify the primary trend. It’s an overlay indicator, meaning it plots its line directly on the price chart, making it visually intuitive. It uses the Average True Range (ATR) to gauge volatility and calculate its position.
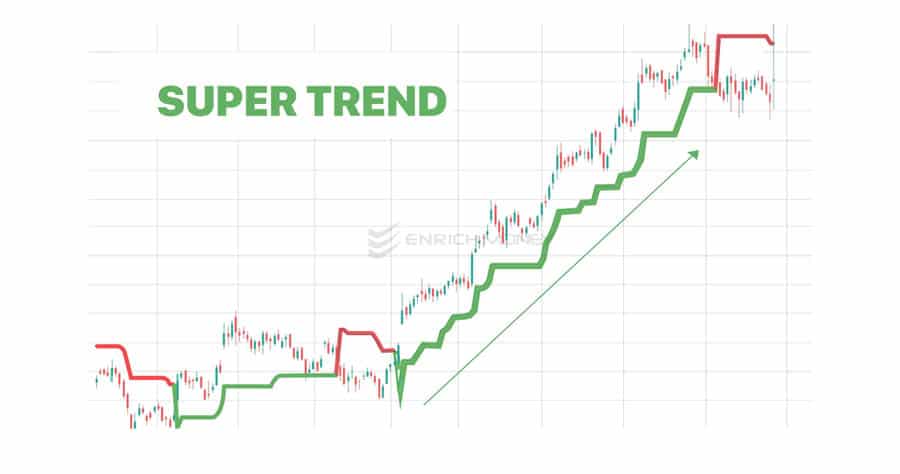
- Why It’s Great for Scalping: The Supertrend gives a very clear, color-coded line. Typically, a green line below the price signifies an uptrend, while a red line above the price signifies a downtrend. There’s no guesswork, which is perfect for the rapid decision-making scalping requires.
- Best Settings for Scalping: A common setting is an ATR period of 10 and a factor (multiplier) of 3. For faster scalping (1-minute charts), you might test a shorter ATR period like 7 or a smaller factor like 2.5 to make it more responsive. Backtesting is key here.
- The Strategy in Action:
- Entry Signal: Enter a long trade when the price closes above the Supertrend line and the line turns green. Enter a short trade when the price closes below the Supertrend line and it turns red.
- Exit Signal: The indicator line itself acts as a dynamic stop-loss. Exit the trade if the price crosses and closes on the opposite side of the Supertrend line.
Chart Example: Imagine a BTC/USD 5-minute chart. The price has been trending down with a red Supertrend line above it. Suddenly, a strong bullish candle breaks and closes above the red line. At the close of that candle, the indicator flips, and a green line appears below the price. That is your buy signal.
MACD (Moving Average Convergence Divergence)
The MACD is a classic momentum and trend-following indicator. While many traders focus only on the MACD line/signal line crossover, scalpers can get more value by focusing on the histogram, which measures the distance between these two lines.
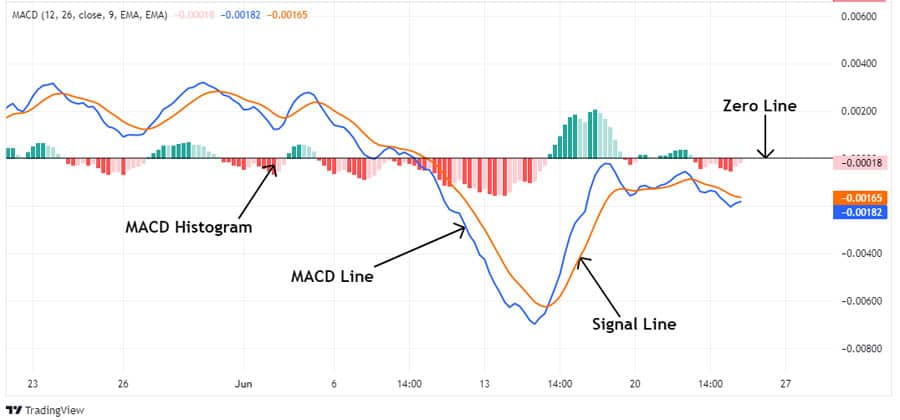
- Why It’s Great for Scalping: The MACD histogram is excellent for spotting shifts in momentum, which often precede a price turn. A histogram that is growing taller indicates strengthening momentum, while a shrinking histogram suggests momentum is fading, giving you an early warning to exit.
- Best Settings for Scalping: The default settings (12, 26, 9) are surprisingly robust, even on lower timeframes. However, some scalpers prefer faster settings like (5, 13, 1) to make the MACD extremely sensitive, essentially turning it into a momentum gauge rather than a crossover system.
- The Strategy in Action:
- Entry Signal: Instead of waiting for a full line crossover, consider entering a long position when the histogram crosses above the zero line and starts getting larger. This indicates that bullish momentum is building.
- Exit Signal: An excellent early exit signal is when the histogram starts to form lower peaks (in an uptrend) or higher troughs (in a downtrend), signaling that momentum is waning before the price even turns.
Chart Example: On a GBP/JPY 1-minute chart, you see the price making a new low, but the MACD histogram below makes a higher low. This is a classic bullish divergence—a powerful signal that the downtrend is losing steam and a reversal is likely. This is a high-probability entry setup.
Ichimoku Cloud (Kumo)
The Ichimoku Cloud may look intimidating, but for scalping, you can simplify it. The “Kumo” or Cloud itself is a fantastic tool for quickly gauging trend direction and identifying areas of support and resistance.
- Why It’s Great for Scalping: The Cloud provides an instant visual summary of the market’s state. If the price is above the Cloud, the overall trend is bullish. If it’s below, the trend is bearish. If it’s inside the Cloud, the market is choppy and best avoided. This quick filter is invaluable.
- Best Settings for Scalping: The standard settings (9, 26, 52) are designed for daily charts. For scalping, these must be adjusted. A common practice is to halve the settings to (5, 13, 26) or something similar to adapt to the faster pace of lower timeframes.
- The Strategy in Action:
- Entry Signal: A simple but effective strategy is the “Kumo Breakout.” Enter a long position when the price breaks out of the top of the Cloud. Enter a short position when it breaks out of the bottom.
- Exit Signal: A simple exit is when the price re-enters the Cloud, signaling that the trend’s conviction is lost. The other side of the Cloud can also serve as a take-profit target.
Chart Example: On a 5-minute chart, you see the price consolidating inside the Kumo. After a few candles, a strong bullish candle closes firmly above the top line of the Cloud (Senkou Span B). This breakout is a clear signal to enter a long trade.
Read More: Trendline Scalping Strategy
The Power of Combination: A Real Strategy
From my trading experience, relying on a single tool is a recipe for disaster. The real magic happens when you combine indicators to filter out bad signals. The best trend indicator for scalping is actually a system of indicators working together.
Let’s build a simple but powerful strategy: The EMA Crossover with an RSI Filter.
- Trend Indicator: 13-EMA and 26-EMA. These will define the primary short-term trend direction.
- Momentum/Confirmation Indicator: Relative Strength Index (RSI) with a period of 14. We will use the 50-level as a filter.
This combination ensures you are only taking trades in the direction of the main trend (defined by the EMAs) when there is sufficient momentum (confirmed by the RSI) to carry the trade.
The Rules of Engagement
- Long Entry Rule: Only enter a long position when the 13-EMA has crossed above the 26-EMA AND the RSI is above 50. The RSI being above 50 suggests that the market is in a bullish regime, adding confirmation to your EMA signal.
- Short Entry Rule: Only enter a short position when the 13-EMA has crossed below the 26-EMA AND the RSI is below 50. This confirms that bears are in control.
Chart Example: Imagine the 13-EMA crosses above the 26-EMA on a 5-minute chart. You check your RSI indicator below. It’s reading 42. You do not take the trade. Two candles later, the price pulls back slightly, the EMAs remain crossed, and the RSI ticks up to 53. Now, you have a valid entry signal. This filter keeps you out of weak, false breakouts.
Common Mistakes to Avoid When Scalping
Even with the best tools, it’s easy to make mistakes in the heat of the moment. Avoiding these common pitfalls is just as important as picking the right indicator.
- Analysis Paralysis: Don’t clutter your chart with ten different indicators. You’ll get conflicting signals and will be too slow to act. Stick to a clean setup with 2-3 indicators that work well together.
- Using Daily Chart Settings: This is a classic error. The settings that work for a long-term investor (like a 200-period moving average) are useless on a 1-minute chart. You must shorten your indicator periods to match your trading timeframe.
- Ignoring Price Action: Never forget that indicators are derived from price. They are secondary. If an indicator gives a buy signal, but the price candle is a massive bearish engulfing pattern, trust the price action, not the indicator.
- Chasing Losses: Scalping involves small wins and small losses. A loss is part of the game. Trying to win it back immediately with a reckless “revenge trade” is the fastest way to blow your account. Stick to your strategy.
- Forgetting the Stop-Loss: The most critical rule. In scalping, a position can turn against you in seconds. Every single trade must have a pre-defined stop-loss. No exceptions. This is not just advice; it’s a requirement for survival.
Opofinance Services
To effectively implement these strategies, you need a reliable and fast trading environment. An ASIC-regulated broker like Opofinance provides the foundation necessary for high-frequency trading styles like scalping. They offer a suite of services designed for modern traders who demand speed, advanced tools, and security.
Here’s what stands out:
- Advanced Trading Platforms: Choose the platform that fits your style. Opofinance supports industry standards like MT4 and MT5, the professional-grade cTrader, and their proprietary OpoTrade platform, ensuring you have the right environment for execution.
- Innovative AI Tools: Gain a competitive edge with cutting-edge technology. Utilize their AI Market Analyzer for deeper insights, get personalized feedback from the AI Coach, and receive instant help from AI Support.
- Social & Prop Trading: Whether you want to follow experienced traders or get funded through proprietary trading, Opofinance offers modern pathways to engage with the markets beyond just self-directed trading.
- Secure & Flexible Transactions: Fund your account with confidence. They offer safe and convenient deposit and withdrawal methods, including crypto payments, with the added benefit of zero transaction fees from their side, which is a significant plus for active traders.
For traders serious about using the best trend indicators for scalping, having a broker that supports your strategy with the right technology is crucial.
Explore the advanced trading tools at opofinance.com
Conclusion
So, what is the best trend indicator for scalping? While the Exponential Moving Average (EMA) is a top contender for its speed and clarity, the real answer is more nuanced. The most successful scalpers know that the “best” indicator is actually a well-tested system of 2-3 tools that complement each other, like an EMA for trend and an RSI for momentum. The indicator itself is useless without the correct settings for your chosen timeframe and a disciplined approach to execution and risk management. Stop searching for a single “holy grail” and start building a complete, personalized strategy. Your consistency and profitability will depend on it.
What is the best indicator for scalping gold?
Gold is known for its volatility and respect for support/resistance levels. A combination of the Supertrend indicator for trend direction and a Volume Profile indicator to identify high-traffic price zones can be very effective for scalping it.
Can I use a Volume indicator for trend scalping?
Yes, but not in isolation. A volume indicator like the On-Balance Volume (OBV) is excellent for confirming the strength of a trend. A rising price accompanied by rising OBV confirms a strong uptrend, making it a great confirmation tool for an EMA crossover or Supertrend signal.
Is scalping profitable in the long run?
Scalping can be highly profitable for disciplined traders who have a robust, backtested strategy and manage risk impeccably. However, it requires significant focus and is not suited for everyone due to high transaction costs (if commissions/spreads are high) and the psychological pressure.
How do I handle flat or ranging markets when scalping?
This is where indicators like the Ichimoku Cloud or Bollinger Bands excel. The Ichimoku Cloud will show price trading inside the Kumo, signaling a range. Bollinger Bands will appear to flatten and contract. During these times, it’s often best to stay out and wait for a clear breakout.
Which is better for scalping, MT4 or TradingView?
Both are excellent. TradingView is renowned for its superior charting tools and a vast library of custom indicators, making it ideal for analysis and strategy development. MT4 is a global standard for execution, famous for its stability and widespread broker support. Many traders perform analysis on TradingView and execute on MT4.


