

The cup pattern in forex is a powerful bullish signal that can precede significant upward moves, making it a favorite among technical traders. Mastering the cup and handle pattern in trading involves identifying a distinct U-shaped price consolidation followed by a minor pullback, which sets the stage for a potential breakout. This guide provides a complete framework for spotting and trading this formation, which can be easily managed through a regulated online forex broker. We will cover its anatomy, confirmation signals, and a step-by-step strategy for execution.

Key Takeaways
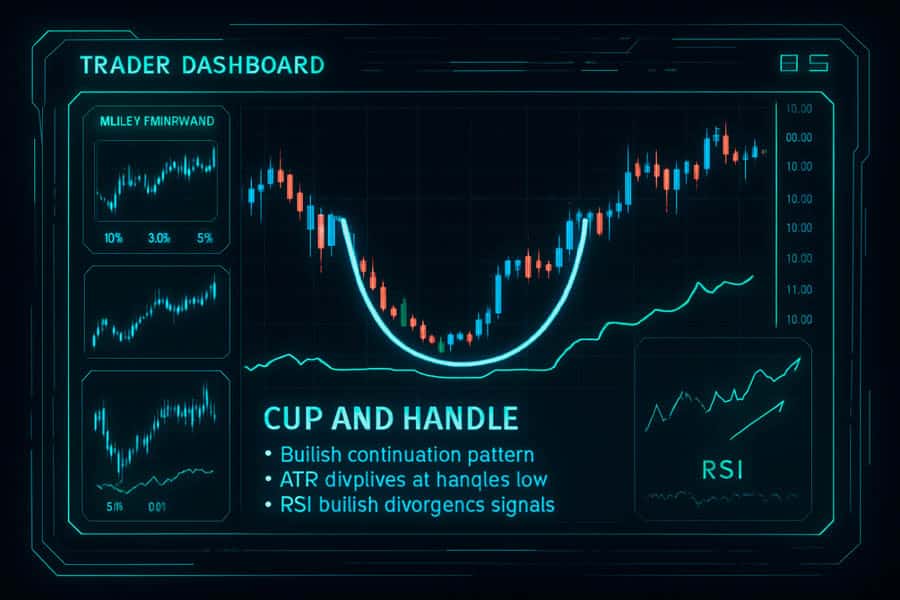
- Pattern Anatomy: The cup and handle pattern in trading consists of a “U”-shaped rounded bottom (the cup) and a slight downward drift (the handle). This structure signals a consolidation period followed by a potential bullish continuation.
- Bullish Signal: It is primarily a bullish continuation pattern, indicating that a prior uptrend is likely to resume after a pause. It can occasionally act as a reversal pattern at market bottoms.
- Confirmation is Crucial: A breakout above the neckline (the resistance level connecting the cup’s peaks) on increased volume is the primary confirmation signal. Trading without this confirmation is a common mistake.
- Best Timeframes: The cup pattern in forex is most reliable on higher timeframes like the daily and weekly charts, as they represent more significant market conviction.
- Clear Targets & Stops: The pattern provides a logical price target, typically measured by adding the cup’s depth to the breakout point. Stop-losses are usually placed below the handle’s low for effective risk management.
Quick-Start Trading Checklist
For traders who want to get straight to the action, here is a concise checklist. This is the distilled process I run through whenever I spot a potential cup and handle pattern in trading on my charts. It’s designed to be fast, efficient, and rooted in high-probability setups.
- Context Check: Is there a clear, pre-existing uptrend? The pattern is strongest as a continuation signal. If the market is in a downtrend, the pattern is far less reliable unless it’s a multi-month bottoming formation.
- Cup Shape: Does it form a gentle, rounded “U” shape? Avoid sharp “V” bottoms. A rounded base indicates a period of gradual accumulation and stability, which is a much stronger foundation for a rally.
- Handle Formation: Has a handle formed as a shallow, orderly pullback? It should be a slight drift or a tight channel, retracing no more than one-third of the cup’s height. Volume should ideally decrease during the handle’s formation, showing a lack of selling pressure.
- Neckline Break: Has the price closed decisively above the neckline resistance? I always wait for a daily candle close to confirm the breakout and avoid getting caught in false intra-day spikes. A surge in volume on the breakout candle is the ultimate confirmation.
- Risk & Target Defined: Is the potential reward at least twice the risk? Calculate your target by measuring the cup’s depth and projecting it upward from the breakout point. Place your stop-loss just below the low of the handle. If the risk/reward ratio isn’t favorable, it’s better to skip the trade.
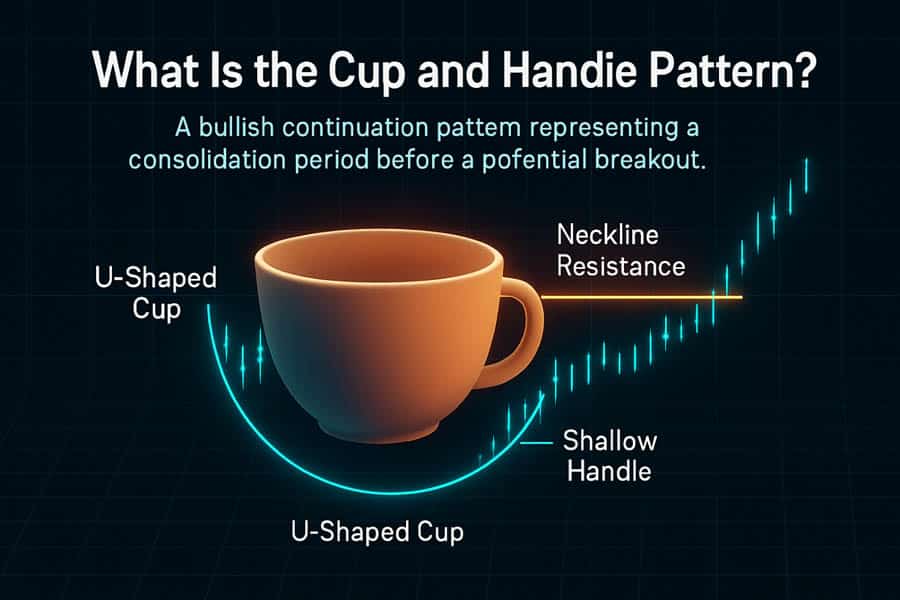
What Is the Cup and Handle Pattern?
The cup and handle pattern in trading is a technical analysis chart pattern that resembles a teacup. It’s a bullish continuation signal, meaning it typically forms during an uptrend and suggests the trend is about to resume. Developed by William J. O’Neil, its power lies in its clear structure, which visually represents a period of market consolidation before the next major move higher. Let’s break down its components.
Anatomy of the Pattern
Understanding the two parts of the formation is fundamental to leveraging the cup pattern in forex.
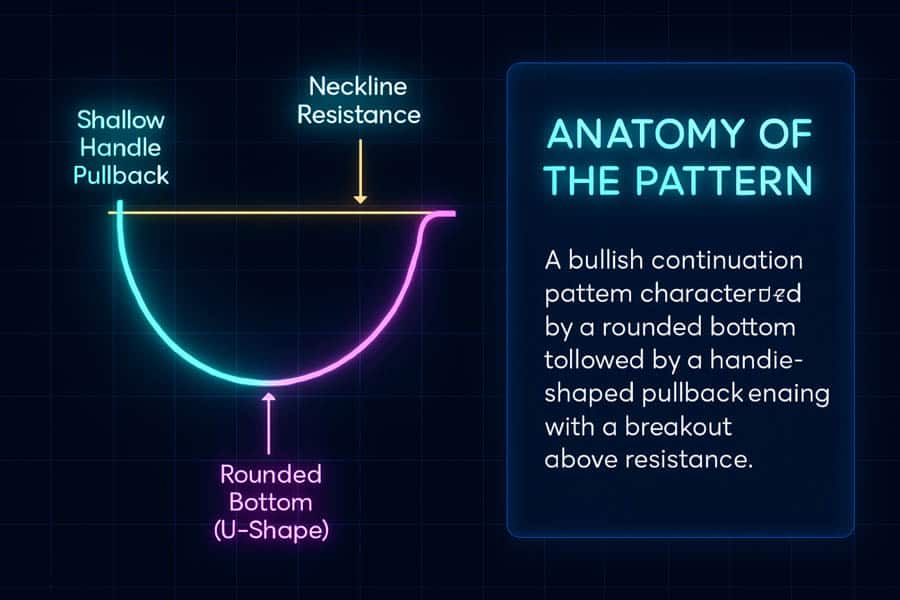
- The Cup: This part of the pattern forms after an advance and looks like a bowl or rounded bottom. The “U” shape is critical because it signifies a gradual consolidation phase where the price finds a stable base. A sharp “V” shape, on the other hand, suggests a more frantic and less stable bottom, making it a weaker signal. The cup’s two peaks should be roughly at the same level, forming a clear resistance line known as the neckline.
- The Handle: Following the completion of the cup, the price action drifts slightly downward or sideways in a tight channel. This is the handle. This phase is a final, brief shakeout of weaker holders before the price breaks out. A valid handle should not retrace more than about 1/3 of the cup’s height. A deeper handle can indicate that selling pressure is too strong, potentially invalidating the pattern. The cup pattern in forex trading often features a handle that looks like a bull flag or a small wedge.
Why It Signals Bullish Continuation

The psychology behind the cup and handle pattern in trading is what makes it so effective. The initial uptrend hits a peak as early buyers take profits. The subsequent decline and rounding bottom of the cup represent a period where the initial selling pressure subsides and new buyers slowly accumulate positions, creating a solid support base. The handle is the final pause. It’s a test of the resistance (neckline) where the last of the sellers are flushed out. When the price finally breaks through the neckline, it signifies that the buyers have absorbed all the selling pressure and are now in firm control, ready to drive the price higher. This is the core of successfully using the cup pattern in forex.
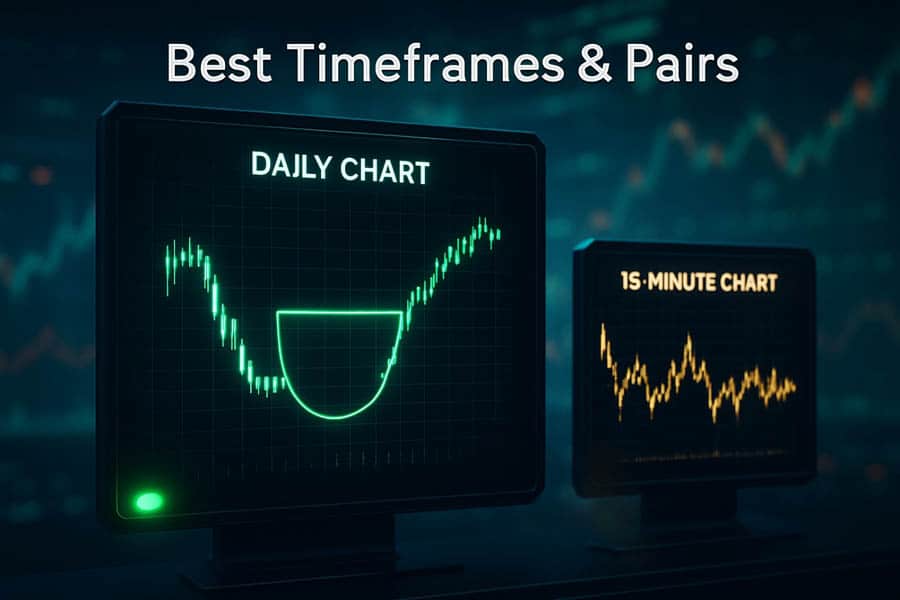
Best Timeframes & Pairs for the Cup Pattern
Not all charts are created equal when it comes to the cup pattern in forex. The reliability of this formation is heavily influenced by the timeframe you trade and the currency pair you choose. Through experience, I’ve found that sticking to certain conditions dramatically increases the probability of success.
Daily and Weekly Charts Reign Supreme
While you might spot a cup and handle pattern in trading on a 15-minute or 1-hour chart, its predictive power is significantly higher on daily and weekly charts. Why? Higher timeframes filter out market “noise.” A daily chart represents a full day of buying and selling, involving a much larger volume of transactions and participation from institutional players. This means a breakout on a daily chart carries far more weight and conviction than one on an intraday chart. A weekly cup pattern in forex trading can signal a major trend shift or continuation that lasts for months, making it ideal for swing and position traders.
Liquid Majors vs. Exotic Pairs
The pattern works best on major and minor currency pairs with high liquidity, such as EUR/USD, GBP/USD, USD/JPY, and AUD/USD. High liquidity ensures smoother price action, which helps in forming the classic rounded shape of the cup. The chart patterns on these pairs tend to be cleaner and more reliable. In contrast, exotic pairs often have lower volume and higher volatility, which can lead to erratic price movements, distorted patterns, and a higher likelihood of false breakouts. While a cup pattern in forex can form on an exotic pair, the risk is inherently greater due to wider spreads and unpredictable swings.
When to Distrust the Pattern
A good trader knows not only when to trade a pattern but also when to ignore it. Here are situations where I would be highly skeptical of a cup and handle pattern in trading:
- High-Impact News Events: Avoid entering a trade just before major economic releases like Non-Farm Payrolls (NFP), central bank interest rate decisions, or inflation reports. These events can trigger extreme volatility that completely disregards technical patterns.
- Ranging or Choppy Markets: The pattern needs a clear prior trend to continue. If the broader market is stuck in a sideways range with no clear direction, the breakout is more likely to fail and get trapped in the chop.
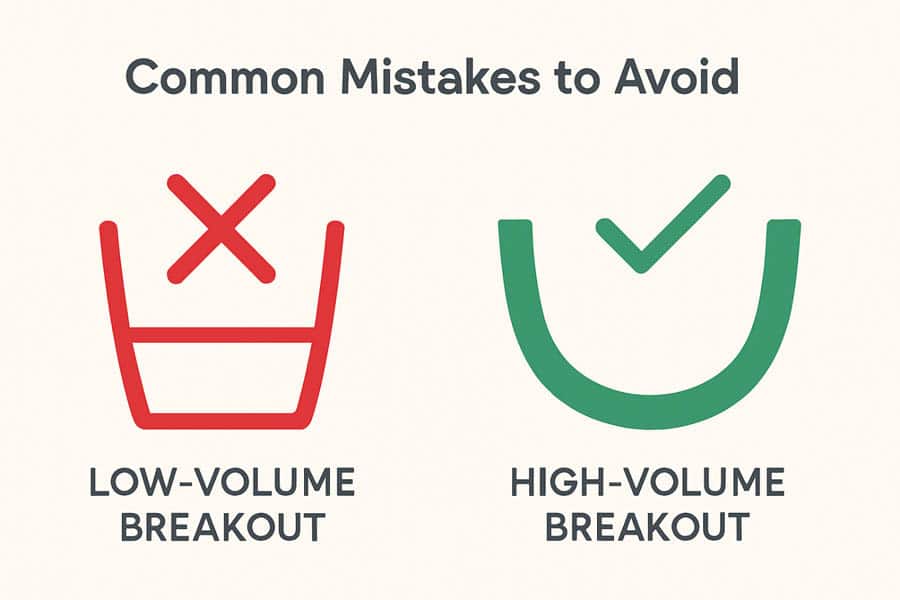
- Low Volume Breakout: Volume is a critical confirmation tool. A breakout above the neckline on weak or declining volume is a major red flag. It suggests a lack of conviction from buyers and a high probability of a “fakeout.” Genuine breakouts are almost always accompanied by a significant spike in volume.
A Step-by-Step Trading Strategy
Now, let’s get into the practical application. Here is a systematic approach to trading the cup pattern in forex, broken down into clear steps from identification to execution. This is the framework I’ve refined over years of trading to ensure I only take the highest-probability setups.
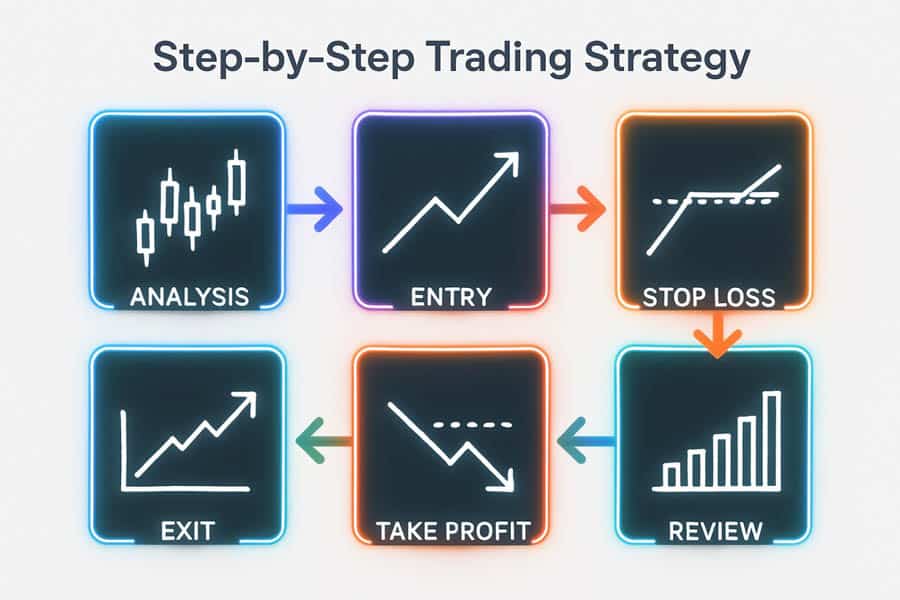
1. Identify a Rounded “U” in an Uptrend
The first step is context. Scan your charts, primarily the daily and 4-hour timeframes, for a currency pair that is in an established uptrend. Look for a period of consolidation that forms a distinct, symmetrical “U” shape. The bottom should be rounded, not V-shaped. This rounding action is crucial as it shows a gradual transfer of power from sellers to buyers, building a strong support base. The depth of the cup can vary, but overly deep cups can sometimes signal excessive weakness.
2. Draw the Neckline and Wait for a Breakout
Once the cup is formed, identify the two peaks on either side. Connect these peaks with a horizontal or slightly sloped trendline—this is your neckline. The neckline acts as the resistance level that needs to be broken to confirm the pattern. The key here is patience. Do not anticipate the breakout. Wait for a strong, decisive close of a candle above this line. An intra-day spike that closes back below the neckline is a classic false breakout trap.
3. Analyze the Handle and Volume
After the cup, the price will typically pull back to form the handle. This is a critical validation step for the cup and handle pattern in trading. The handle should be a small, orderly downward or sideways channel. It must not retrace more than 1/3 of the cup’s total height. A deep handle suggests sellers are still too active. During the handle’s formation, pay close attention to volume. Ideally, trading volume should diminish as the handle forms, indicating that selling interest is drying up. Then, as the price challenges the neckline, you want to see volume surge. This volume spike is your confirmation that buyers are stepping in with force.
4. Choose Your Entry Tactic
You have two primary entry options for the cup pattern in forex trading, each with its pros and cons:
- Enter on the Breakout: This involves placing a buy order as soon as the price closes above the neckline. The advantage is that you won’t miss the move if it takes off quickly. The disadvantage is a higher risk of being caught in a false breakout.
- Enter on the Retest: A more conservative approach is to wait for the price to break the neckline and then pull back to retest it as a new support level. You would enter your buy order once the price bounces off the neckline. This method offers a better entry price and confirmation that the old resistance is now support, but you risk missing the trade if the breakout is so strong that it never looks back.
5. Set Your Stop-Loss
Proper risk management is non-negotiable. For a cup and handle pattern in trading, the most logical place to set your stop-loss is just below the lowest point of the handle. This placement gives the trade enough room to breathe without exposing you to excessive risk. If the price drops back below the handle’s low, it indicates that the breakout momentum has failed, and the pattern is likely invalidated. Setting your stop too tight (e.g., just below the breakout candle) can get you stopped out prematurely by normal market volatility.
6. Determine Your Profit Targets
The classic way to project a profit target for the cup pattern in forex is the “measured move” technique. Measure the vertical distance from the bottom of the cup to the neckline. Then, project this same distance upward from the breakout point. This gives you a logical minimum target for the move. More advanced traders often use a layered approach. Take partial profits at the first measured target, then trail the stop-loss on the remaining position to capture a larger move if the trend continues strongly, targeting subsequent swing highs or resistance levels.
Advanced Tactics for Forex Traders
Once you’ve mastered the basics of the cup pattern in forex, you can begin incorporating more advanced techniques to increase your win rate and improve your risk management. These are tactics that separate consistent traders from novices, helping you filter out mediocre setups and focus only on the highest-quality opportunities.
Multi-Timeframe Confirmation
Never analyze a pattern in isolation. A powerful technique is to use a top-down approach. If you spot a daily cup and handle pattern in trading, zoom out to the weekly chart. Does the weekly chart show a clear uptrend? Is the price bouncing off a key weekly support level? If the higher timeframe confirms the bullish bias, your daily setup has a much greater chance of success. Conversely, if you’re trying to trade a daily bullish pattern while the weekly chart is in a strong downtrend, you’re fighting the current, which is a low-probability trade.
Position Sizing with Average True Range (ATR)
Forex pairs have different volatility profiles. A 50-pip stop-loss on EUR/USD is very different from a 50-pip stop on GBP/JPY. To standardize your risk, use the Average True Range (ATR) indicator. Instead of placing a generic stop-loss, place it at a multiple of the ATR (e.g., 2x ATR) below the handle’s low. This adapts your stop to the pair’s current volatility. You then calculate your position size based on this ATR-adjusted stop to ensure you are risking the same percentage of your account (e.g., 1%) on every trade, which is a cornerstone of professional risk management when dealing with the cup pattern in forex trading.
Combining with RSI Divergence
For added conviction, combine the cup and handle pattern in trading with an oscillator like the Relative Strength Index (RSI). Look for hidden bullish divergence. This occurs when the price forms a higher low during the cup’s formation, but the RSI forms a lower low. This divergence suggests that the underlying momentum is strengthening even as the price consolidates, often preceding a powerful upward move. Spotting this can give you the extra confidence needed to take the breakout trade.
Managing a Winning Trade
Entering the trade is only half the battle. How you manage it determines your profitability. Once your first price objective (the measured move) is hit, consider scaling out by closing a portion of your position (e.g., 50%). Then, move your stop-loss to your entry point (breakeven) on the remaining position. This immediately removes your risk from the trade. From there, you can use a trailing stop-loss (e.g., based on a moving average or previous candle lows) to let the rest of your position run and capture as much of the trend as possible.
Important Pattern Variations
The classic bullish cup pattern in forex is the most well-known, but savvy traders should also be aware of its variations. Recognizing these can open up new trading opportunities and prevent you from being caught on the wrong side of the market. The structure of the cup and handle pattern in trading can invert or appear on different time scales, each requiring a slightly different approach.
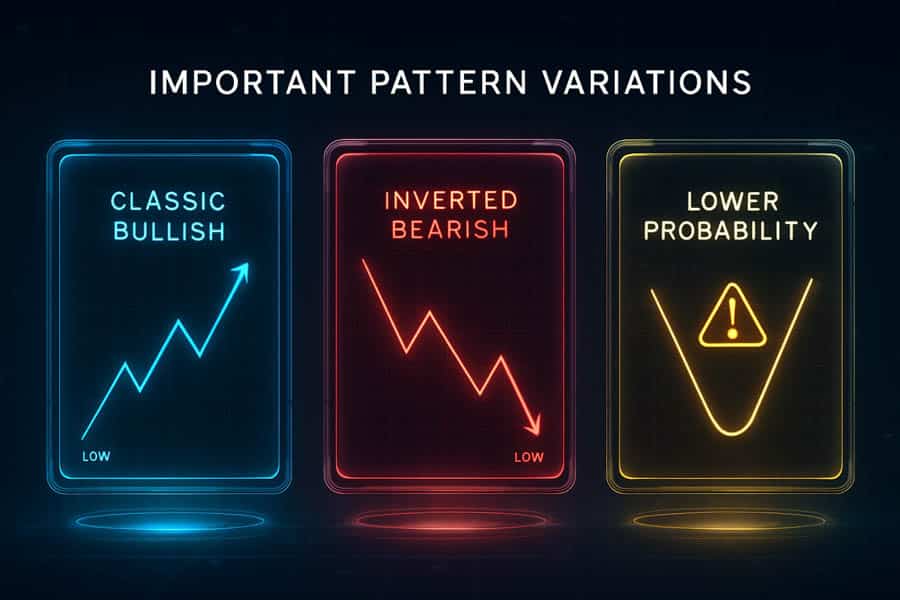
The Inverted Cup and Handle
As the name suggests, this is the bearish counterpart to the classic pattern. It is an upside-down cup and handle that signals a potential continuation of a downtrend or a major market top reversal.
Its components are:
- The Inverted Cup: Forms after a decline, creating an “n”-shaped or rounded top. This shows a period where buyers attempt to push the price up but ultimately fail, with sellers gradually taking control.
- The Inverted Handle: A brief upward bounce or rally that retraces a small portion of the inverted cup. This is a final, weak attempt by buyers before the price breaks down.
The trading strategy is simply reversed. A sell entry is triggered on a decisive close below the neckline (support), with a stop-loss placed just *above* the high of the handle. The price target is calculated by measuring the depth of the inverted cup and projecting that distance downward from the breakdown point.
| Table: Comparison of Bullish vs. Bearish Cup and Handle Patterns | ||
| Feature | Classic Cup and Handle (Bullish) | Inverted Cup and Handle (Bearish) |
| Prior Trend | Uptrend | Downtrend |
| Shape | “U” Shape (Teacup) | “n” Shape (Rounded Top) |
| Signal | Bullish Continuation/Reversal | Bearish Continuation/Reversal |
| Entry Trigger | Breakout above neckline (resistance) | Breakdown below neckline (support) |
| Stop-Loss Placement | Below the handle’s low | Above the handle’s high |
| Volume Confirmation | Spike on breakout | Spike on breakdown |
Intraday vs. Multi-Year Formations
The time scale of the cup and handle pattern in trading dramatically affects its significance. An intraday pattern on a 5-minute chart might lead to a 20-pip move and last for a few hours. A multi-year pattern on a weekly or monthly chart can signal a massive shift in the market’s long-term trend, potentially leading to a move of thousands of pips over many months or even years. While the trading mechanics are the same, the context is entirely different. Longer-term patterns are far more significant because they represent the collective actions of a much larger pool of market participants over an extended period.
Lower Probability Variations
Not every pattern you see will be a textbook example. You will encounter variations that are generally less reliable:
- “V-Bottom” Cups: When the cup has a sharp, V-shaped bottom instead of a rounded one, it signals a more volatile and less stable base. These patterns are more prone to failure because the price hasn’t spent enough time building a solid support foundation.
- Odd or Deep Handles: A handle that is unusually long or retraces more than 50% of the cup’s depth is a warning sign. It shows significant selling pressure that could overwhelm the buyers, invalidating the bullish thesis of the cup pattern in forex.
Common Mistakes and How to Avoid Them
Trading the cup pattern in forex can be highly profitable, but it’s also filled with potential pitfalls that can trap inexperienced traders. Recognizing these common errors is the first step to avoiding them. Here are the mistakes I see traders make most often and how to safeguard your capital.
Forcing the Pattern on the Chart
One of the biggest mistakes is seeing what you want to see. A trader eager for a setup might identify a consolidation that vaguely resembles a cup but lacks the key characteristics—a rounded bottom, a clear neckline, or a proper handle. If you have to squint and force the lines to make it fit, it’s not a valid pattern. The best cup and handle pattern in trading setups are obvious and jump out at you from the chart. If it’s not clean, it’s not a high-probability trade. Stay patient and wait for textbook formations.
Ignoring Volume Confirmation
Price action tells you what is happening, but volume tells you how much conviction is behind it. A breakout above the neckline on low or average volume is a significant red flag. It suggests there isn’t enough buying power to sustain the move, making it highly susceptible to failure. A genuine breakout should be accompanied by a noticeable surge in volume, confirming that institutional money is participating. Always have a volume indicator on your chart when analyzing the cup pattern in forex trading.
Trading the Pattern in Isolation
No technical pattern, no matter how reliable, should be traded in a vacuum. Context is everything. Is the cup pattern in forex forming in the direction of the long-term trend? Is it developing at a key support or resistance level? Is there a confluence of other signals, like a moving average crossover or an indicator divergence? A pattern that aligns with multiple other technical factors has a much higher probability of success than one that appears randomly in choppy price action.
Setting Stops Too Tight
While tight stops are good for limiting risk, placing them too close to your entry can get you knocked out of a perfectly good trade by normal market noise. This is especially true in volatile forex pairs. Placing your stop just a few pips below the breakout candle is a common recipe for getting stopped out on a retest. The logical placement is below the low of the handle. This level represents the last point of support before the breakout momentum is considered to have failed, giving your trade a much better chance of survival.
Opofinance: Trade with a Regulated Edge
Enhance your trading strategy with Opofinance, an ASIC-regulated broker committed to providing a superior trading environment. Access a suite of powerful tools and platforms designed for modern traders.
- Advanced Trading Platforms: Choose from industry-leading platforms including MT4, MT5, cTrader, and the proprietary OpoTrade.
- Innovative AI Tools: Gain a competitive edge with our AI Market Analyzer, AI Coach, and instant AI Support.
- Flexible Trading Options: Explore Social Trading and Prop Trading opportunities to diversify your approach.
- Secure & Zero-Fee Transactions: Enjoy safe and convenient deposits and withdrawals, including crypto payments with zero transaction fees.
Start trading with a broker that empowers your success. Discover the Opofinance advantage today.
Conclusion
The cup pattern in forex remains one of the most reliable and visually intuitive formations available to technical traders. Its strength lies in its clear representation of market psychology—a period of consolidation followed by a confirmed resumption of the trend. By mastering the ability to identify a clean cup and handle pattern in trading, confirming it with volume, and applying a disciplined strategy for entries, exits, and risk management, you can significantly enhance your trading performance and capitalize on high-probability breakout opportunities.
Is the cup and handle pattern only for stocks?
No, the cup and handle pattern is a universal chart pattern that appears in all liquid markets, including forex, commodities, and cryptocurrencies. Its principles of consolidation and breakout are applicable across any asset class.
What is the ideal handle depth?
The ideal handle should be shallow, retracing no more than one-third (about 33%) of the cup’s total height. A deeper retracement suggests too much selling pressure, which reduces the pattern’s reliability.
How long should a cup and handle take to form?
The formation time can vary significantly, from several weeks to many months on a daily chart. There is no fixed rule, but generally, longer and broader patterns tend to lead to more significant breakouts.
Can this pattern give false signals?
Yes, like all technical patterns, it can produce false signals. The most common cause is a breakout on low volume. To filter false signals, always require volume confirmation and look for confluence with the broader market trend.
What if the handle is trending upwards?
A handle should ideally be a downward or sideways consolidation. An upward-sloping handle is a sign of eagerness among buyers, which can sometimes precede a breakout but is considered a less reliable and more aggressive variation of the pattern.
References:


