

In trading, understanding the relationship between correlated assets can provide valuable insights into market dynamics. One such concept that stands out is SMT divergence. But what exactly is SMT divergence, and how can traders use it to their advantage? SMT divergence occurs when two related assets, observed within the same timeframe, show opposite signals. This divergence can be identified by analyzing the highs and lows of each asset, such as one forming a higher low (HL) while the other forms a lower low (LL). SMT divergence is particularly valuable as a confirmation tool for identifying Accumulation/Distribution phases in trading, though it is not typically used as an entry pattern on its own. It also helps traders gain insights into potential Stop Hunts in the market, leading to more informed decisions. For those seeking professional guidance in navigating such complex strategies, a broker for forex can provide valuable expertise and resources.

By the end of this article, you’ll have a solid understanding of SMT divergence and how to apply it effectively in your trading strategy.
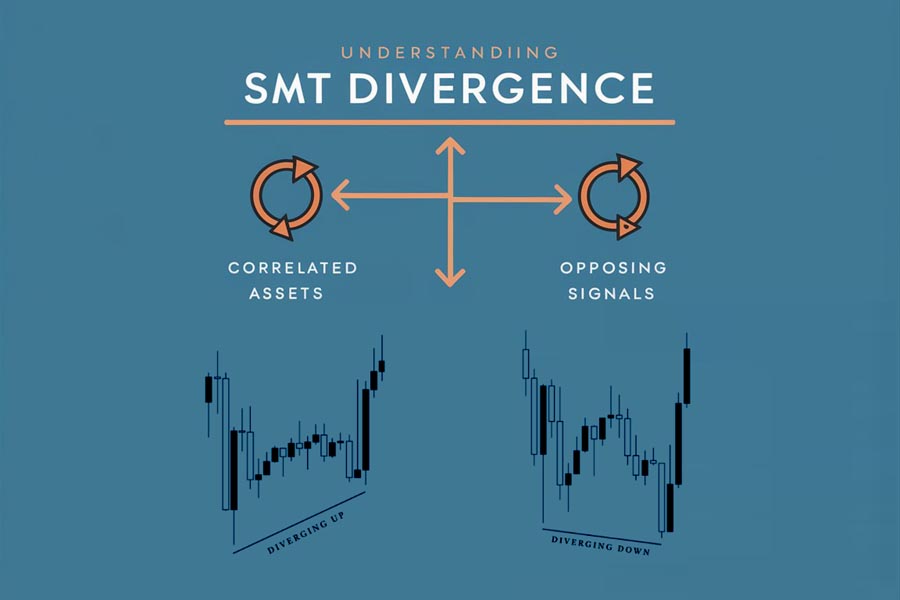
Understanding SMT Divergence
What Is SMT Divergence?
SMT divergence refers to a situation where two correlated assets, observed within the same timeframe, exhibit opposing signals. This can be seen when one asset forms a higher low (HL), indicating strength, while the other forms a lower low (LL), indicating weakness. For SMT divergence to be valid, the two assets must be closely related, such as different currency pairs or stocks within the same sector.
The divergence between these assets can provide traders with crucial information about potential market reversals or continuations. For instance, if one asset shows signs of strength while the other shows weakness, it may indicate a weakening trend in the market. Additionally, SMT divergence serves as a confirmation tool in identifying Accumulation/Distribution phases, helping traders to anticipate market behavior more accurately.
It’s important to note that SMT divergence is most effective when combined with other trading strategies, as it is not typically used as a standalone entry signal.
Bullish and Bearish SMT Divergence
Understanding the difference between bullish and bearish SMT divergence is crucial for effective market analysis:
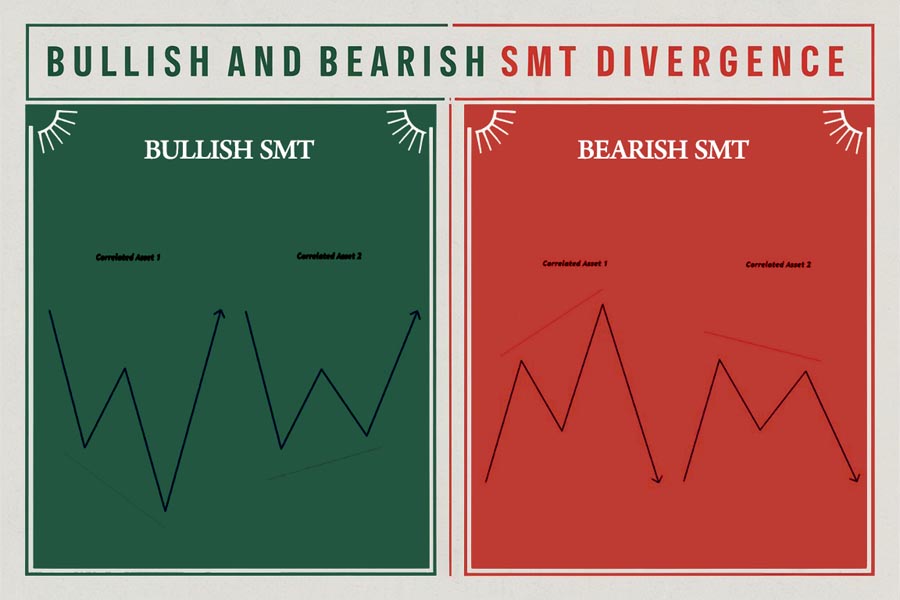
- Bullish SMT Divergence: This occurs when a correlated asset, which is typically moving in tandem with another, shows a lower low (LL) while the other asset shows a higher low (HL). This divergence signals that the asset with the higher low is likely to experience a bullish move, suggesting a potential buying opportunity.
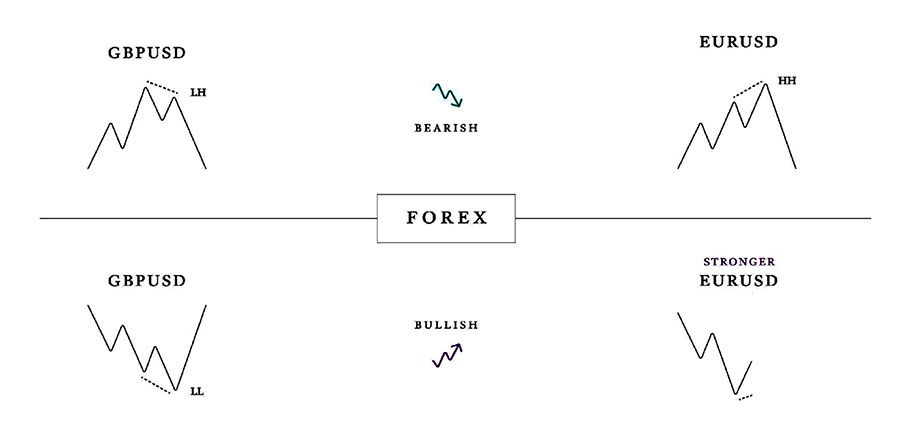
Example: In the forex market, if EUR/USD forms a lower low while GBP/USD forms a higher low, this indicates potential strength in GBP/USD, hinting at a bullish move.
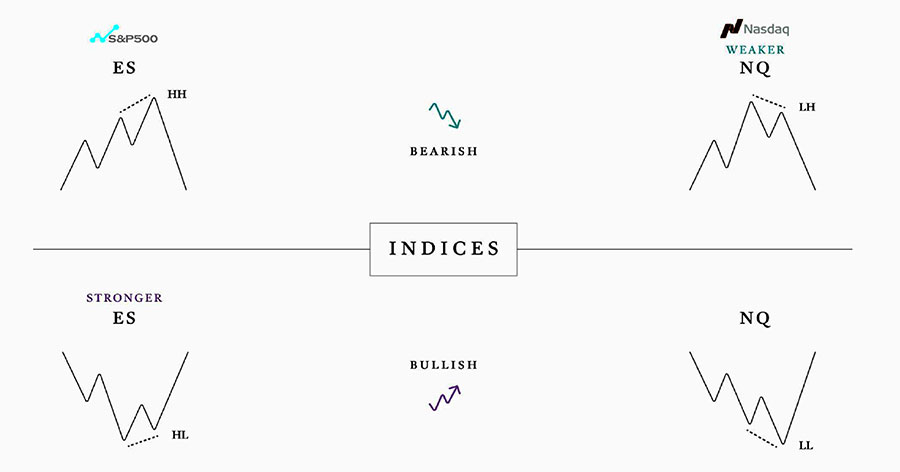
- Bearish SMT Divergence: Conversely, bearish SMT divergence occurs when one asset forms a higher high (HH) while the correlated asset forms a lower high (LH). This suggests that the asset forming the lower high may experience a bearish move, making it a potential candidate for selling.
Example: If BTC forms a higher high while ETH forms a lower high, this divergence might indicate weakness in ETH, pointing to a potential downtrend.
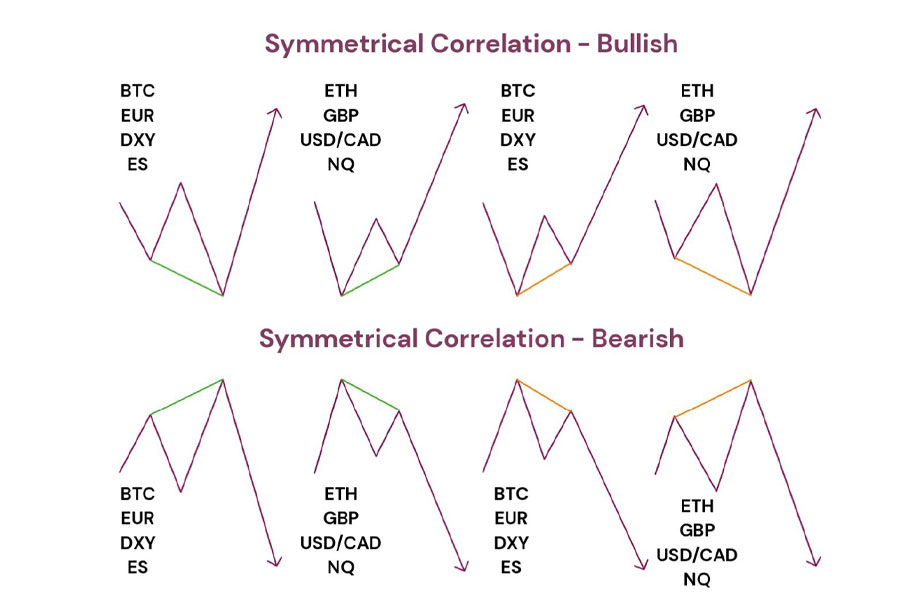
Symmetrical and Inverse Correlation in SMT Divergence
In SMT divergence, understanding the correlation between assets is key. There are two main types of correlations: symmetrical and inverse.
- Symmetrical Correlation: This occurs when two assets generally move in the same direction. For example, in the crypto market, Bitcoin (BTC) and Ethereum (ETH) often exhibit symmetrical correlation. In the forex market, EUR/GBP pairs often move together, while in indices, ES (S&P 500) and NQ (Nasdaq 100) typically show symmetrical movement.
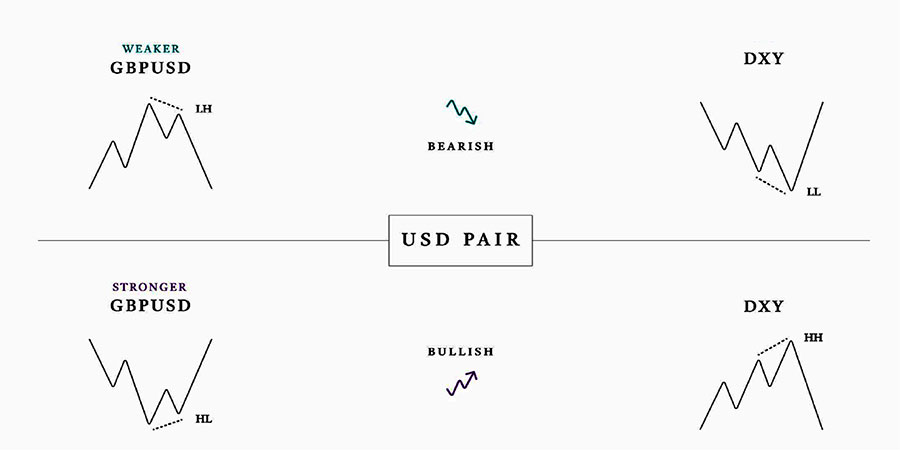
- Inverse Correlation: In contrast, inverse correlation occurs when two assets move in opposite directions. An example in the crypto market would be BTC and DXY (US Dollar Index). In the forex market, the DXY and EUR/USD pairs often show inverse correlation, as do DXY and other USD pairs.
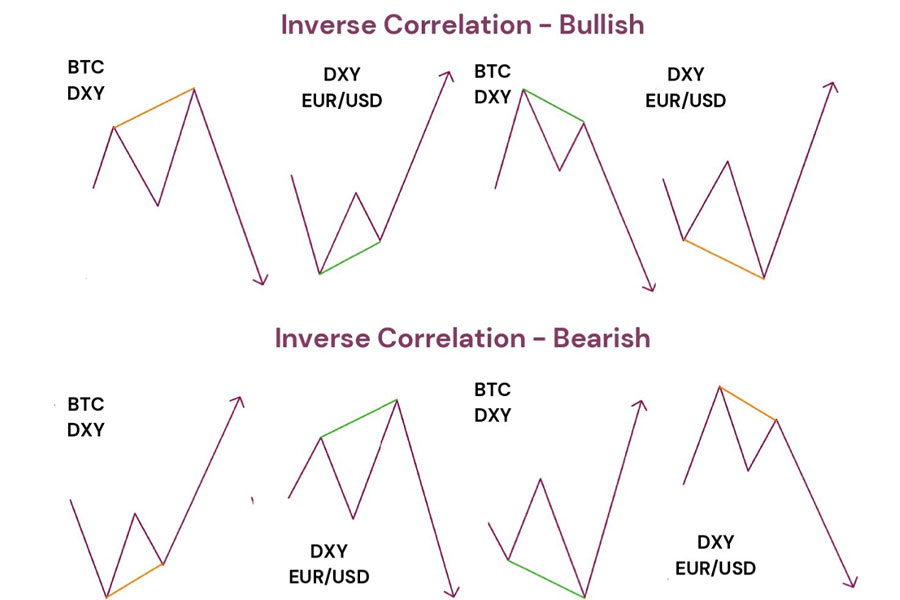
These correlations play a crucial role in identifying SMT divergence and understanding potential market shifts.
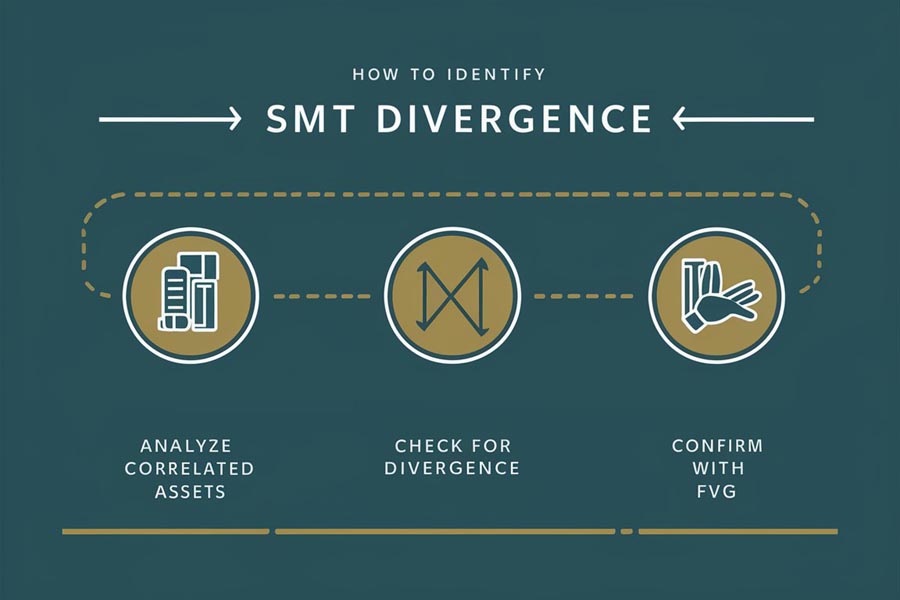
How to Identify SMT Divergence
To spot SMT divergence, traders must carefully analyze the price action of two related assets within the same timeframe. The key is to look for discrepancies in their behavior. For example, if one asset breaks above a previous high, while the other fails to do so, this could signal a divergence.
In the example provided, the asset on the left clears out liquidity above a previous high, while the asset on the right fails to do so and instead moves towards lower liquidity areas. This kind of behavior suggests that the asset on the right is weaker, indicating a potential shift in market sentiment.
The Importance of SMT Divergence in Trading
SMT divergence is significant because it helps traders identify potential weaknesses or strengths in the market. This information can be crucial for making informed trading decisions, such as whether to enter or exit a trade. When SMT divergence occurs within a Fair Value Gap (FVG), it carries even greater weight. An asset that penetrates an FVG while its correlated counterpart fails to do so signals a strong indication of weakness in the latter asset.
Read more: Mastering the ICT Market Maker Model
How to Use SMT Divergence in Your Trading Strategy
Spotting Structural Correlation Gaps
One of the essential aspects of utilizing SMT divergence is recognizing gaps in structural correlation between two assets. This occurs when, within the same timeframe, one asset behaves differently from its correlated counterpart. For example, if one asset clears out liquidity at a high, while the other struggles to do so, this divergence highlights a potential market shift.
Practical Example of SMT Divergence
Consider a scenario where you’re analyzing two currency pairs, EUR/USD and GBP/USD. Suppose EUR/USD breaks above a key resistance level, signaling strength, while GBP/USD fails to break its corresponding resistance level. This failure creates an SMT divergence, indicating potential weakness in GBP/USD. As a trader, you might interpret this as a signal to consider a short position on GBP/USD or to be cautious about entering a long position.
Leveraging SMT Divergence Within FVG
As mentioned earlier, SMT divergence within a Fair Value Gap (FVG) is particularly potent. If one asset successfully penetrates an FVG, while the correlated asset fails to do so, this divergence provides a clear signal of weakness. Traders can use this information to make more confident decisions about entering or exiting trades.
Which Pair to Choose for Trading?
As traders, we need activity in the markets, as volatility makes trading easier. The news plays a significant role in contributing to market activity, so we typically start the trading day by checking the economic calendar. However, it’s essential to note that if there’s a scheduled news release on the GBP (British Pound), it doesn’t automatically imply that GBP/USD will be more preferable than EUR/USD, for example. Market dynamics are influenced by various factors, and it’s crucial to consider technical analysis, market sentiment, and other factors before making a trading decision.
The logic is that pairs that are closely correlated with each other are likely to move in a symmetrical manner. However, during the formation of SMT divergence, one of the pairs will display strength or weakness, signaling an approaching high volatility for that particular pair. For instance, if ES (S&P 500) reaches a new high, while YM (Dow Jones) or NQ (Nasdaq 100) fails to do so (showing weakness), it suggests a potential trading opportunity. In this scenario, one may consider opening short positions on YM or NQ.
Tips for Using SMT Divergence Effectively
- Combine with Other Indicators: To increase the reliability of SMT divergence signals, consider combining them with other technical analysis tools, such as moving averages or the RSI.
- Focus on Correlated Assets: Ensure that the assets you are comparing are truly correlated. SMT divergence is most effective when applied to assets with a strong correlation.
- Backtest Your Strategy: Before relying on SMT divergence in live trading, backtest your strategy to understand its effectiveness in different market conditions.
Read more: Mastering the ICT Asian Range Strategy
Examples of SMT Divergence in Various Markets and Instruments
Crypto Market
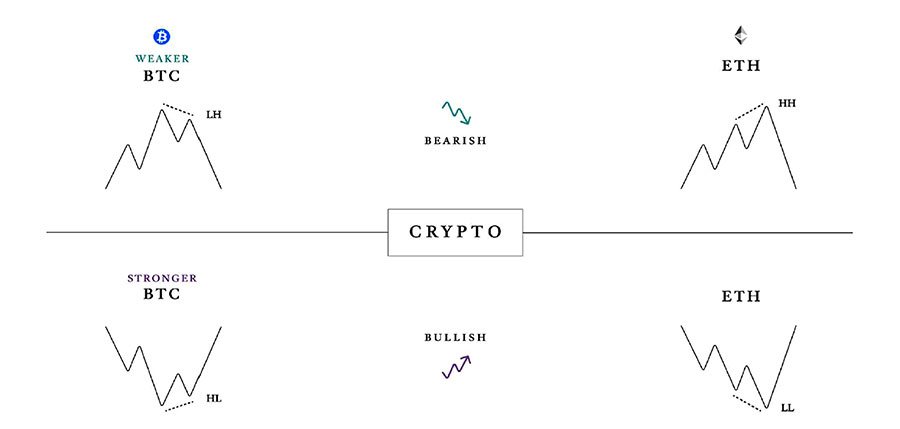
In the crypto market, SMT divergence can be a valuable tool for identifying potential shifts in the trends of correlated cryptocurrencies. For example, let’s consider Bitcoin (BTC) and Ethereum (ETH), two of the most closely watched digital assets. If Bitcoin forms a higher low (HL), indicating potential strength, while Ethereum forms a lower low (LL), indicating potential weakness, this SMT divergence could suggest a forthcoming divergence in their respective trends. Traders could use this information to adjust their positions, perhaps favoring Bitcoin over Ethereum in the short term.
Another example could be the relationship between Bitcoin (BTC) and the US Dollar Index (DXY). If BTC shows strength by breaking above a key resistance level while DXY fails to do so, this inverse SMT divergence could signal a weakening US dollar, leading to a potential rally in Bitcoin.
Forex Market
In the forex market, SMT divergence can be particularly useful when analyzing major currency pairs. Consider the EUR/USD and GBP/USD pairs, which often exhibit strong correlations. If EUR/USD breaks above a significant resistance level while GBP/USD struggles to break a similar level, this divergence can indicate potential weakness in GBP/USD. Traders might interpret this as a signal to short GBP/USD or to be cautious about taking long positions in this pair.
Another scenario might involve the DXY (US Dollar Index) and USD/JPY. If DXY forms a higher high (HH) while USD/JPY fails to reach a similar high, this SMT divergence could indicate relative weakness in the US dollar against the Japanese yen, signaling potential trading opportunities.
Read more: Mastering ICT Optimal Trade Entry
USD Pairs
When trading USD pairs, SMT divergence can highlight shifts in the strength of the US dollar relative to other currencies. For example, if the USD/JPY pair forms a higher high (HH) while the USD/CAD pair fails to reach a similar high, this divergence could indicate relative weakness in USD/CAD. Traders might use this information to adjust their positions, favoring USD/JPY over USD/CAD in the short term.
Indices
In the indices market, SMT divergence can help traders identify potential shifts in market sentiment. For example, consider the S&P 500 (ES), Dow Jones (YM), and Nasdaq 100 (NQ) indices. If the S&P 500 forms a higher high (HH) while the Dow Jones and Nasdaq 100 fail to reach similar highs, this SMT divergence could indicate relative weakness in the Dow Jones and Nasdaq 100. Traders might interpret this as a signal to short YM or NQ, or to be cautious about taking long positions in these indices.
OpoFinance Services

In the fast-paced world of trading, having the right partner by your side can make all the difference. OpoFinance offers a suite of services tailored to help traders navigate the complexities of the market. With advanced trading platforms, real-time market data, and personalized support, OpoFinance empowers traders to make informed decisions and capitalize on opportunities. Whether you’re a seasoned trader or just starting, OpoFinance provides the tools and resources you need to succeed. Additionally, OpoFinance offers a unique social trading service that allows you to follow and replicate the trades of successful traders, giving you an edge in the market.
Conclusion
SMT divergence is a powerful tool that traders can use to gain insights into market behavior and identify potential trading opportunities. By understanding how to spot SMT divergence and apply it effectively, traders can enhance their trading strategies and improve their chances of success. Whether you’re trading cryptocurrencies, forex pairs, or indices, SMT divergence can provide valuable information about market trends and potential reversals.
The key to successful trading is not just identifying opportunities but also knowing how to act on them effectively.
Can SMT Divergence Be Used as a Standalone Indicator for Entering Trades?
No, SMT divergence is typically not used as a standalone entry signal. Instead, it serves as a confirmation tool that can help identify potential market reversals or continuations. Traders often combine SMT divergence with other technical analysis tools, such as moving averages or the Relative Strength Index (RSI), to increase the reliability of their trading decisions.
Example: If you’re considering entering a trade based on a moving average crossover, SMT divergence can provide additional confirmation of the trade’s validity.
Is SMT Divergence More Effective in Certain Markets or Instruments?
SMT divergence can be effective across various markets, including crypto, forex, and indices. However, its effectiveness may vary depending on the correlation between the assets being compared. In markets with strong correlations, such as the forex market with EUR/USD and GBP/USD pairs, SMT divergence is particularly useful for identifying potential trading opportunities. Conversely, in markets with weaker correlations, the signals may be less reliable.
Key takeaway: Focus on strongly correlated assets when applying SMT divergence to increase the accuracy of your analysis.
How Can I Practice Identifying SMT Divergence Before Applying It in Live Trading?
To become proficient in identifying SMT divergence, it’s essential to practice in a controlled environment. You can do this by backtesting your strategies on historical price data or using a demo trading account. These methods allow you to observe how SMT divergence plays out in different market conditions without risking real capital.
The more you practice, the better you’ll become at spotting SMT divergence and using it to your advantage in live trading.


One Response
In this grand scheme of things you secure a B- just for effort and hard work. Where you actually lost me was first in your particulars. As they say, the devil is in the details… And that couldn’t be much more accurate in this article. Having said that, permit me say to you exactly what did deliver the results. The text can be highly powerful which is possibly the reason why I am taking the effort in order to opine. I do not make it a regular habit of doing that. Next, while I can easily notice a leaps in logic you come up with, I am not really certain of exactly how you seem to unite your details which produce the actual conclusion. For right now I will, no doubt subscribe to your position but trust in the foreseeable future you link your dots better.