

The Donchian Channel is a powerful yet straightforward technical indicator that visualizes the highest high and lowest low of an asset’s price over a specified period. Comprised of three bands—upper, lower, and middle—it helps traders identify market volatility, potential breakouts, and prevailing trends with remarkable clarity. Whether you are searching for a reliable online forex broker or trading stocks, understanding this tool is essential. This article will explore everything from the core Donchian Channel strategy to finding the best Donchian Channel settings, interpreting its signals, and executing a successful Donchian Channel breakout trade.
Key Takeaways
For traders who need insights at a glance, here are the most critical takeaways about the Donchian Channel:
- Identifies Trends & Volatility: The channel’s width directly reflects market volatility. A widening channel suggests increasing volatility, while a narrowing channel indicates a potential breakout is imminent.
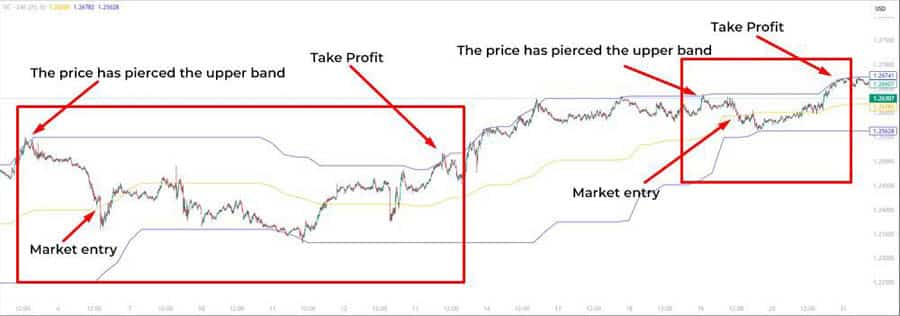
- Clear Breakout Signals: A price close above the upper band signals a potential long (buy) opportunity, while a close below the lower band suggests a short (sell) opportunity. This forms the basis of the classic Donchian Channel breakout strategy.
- Highly Customizable: While the 20-period setting is standard, the indicator can be adjusted for various trading styles. Shorter periods are used for scalping, while longer periods suit swing and position trading.
- Stronger with Confirmation: The Donchian Channel is most effective when used with other indicators like the RSI, MACD, or a long-term moving average to confirm signals and filter out market noise.
- Versatile Across Markets: Originally designed for commodities, its principles are universally applicable to stocks, forex, and cryptocurrencies, making it a truly versatile tool in a trader’s arsenal.
Proven Donchian Channel Strategies
The true power of the Donchian Channel is unlocked through well-defined strategies. While simple in concept, its application can be nuanced. A successful trader doesn’t just see the lines on a chart; they understand the market psychology behind them. Below are some of the most effective and time-tested strategies, from classic breakouts to more advanced mean-reversion tactics. These methods provide a solid framework, but remember that practice and adaptation to live market conditions are what separate amateurs from professionals.
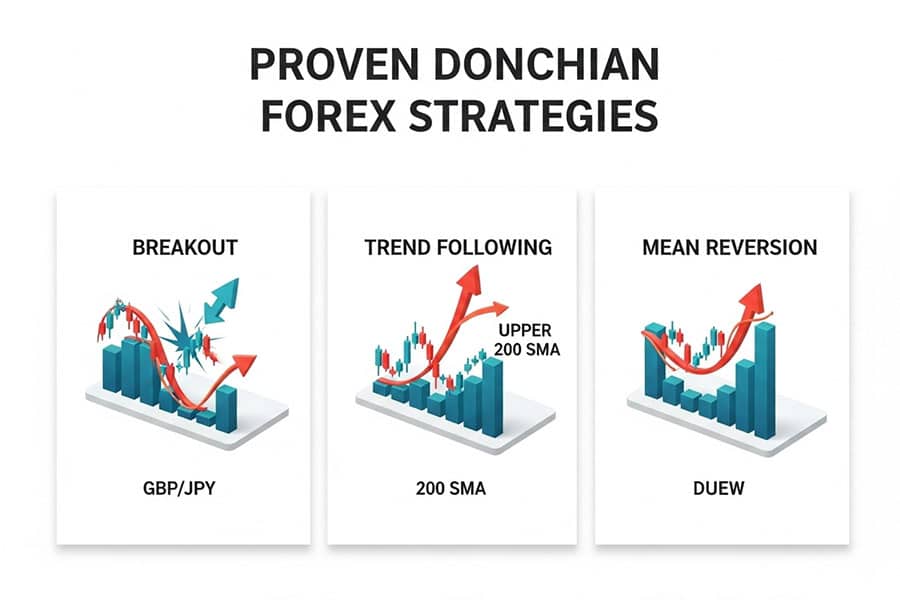
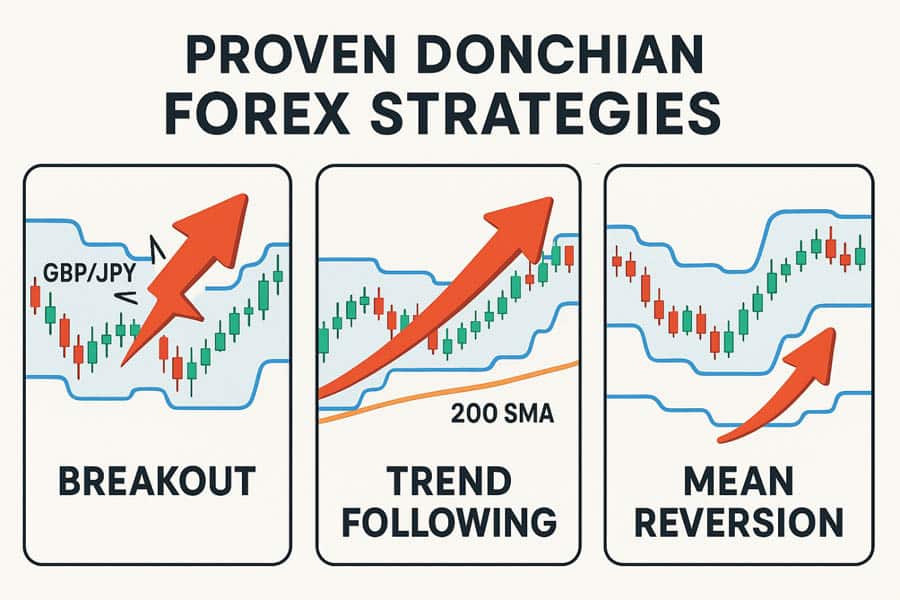
1. The Classic Donchian Channel Breakout Strategy
This is the cornerstone strategy and the one Richard Donchian himself championed. It’s a pure trend-following method designed to capture the beginning of a new, strong move. The logic is simple: a new high or low signifies a powerful shift in market sentiment worth following.
How It Works:
- Buy Signal: When the price closes decisively above the upper Donchian Channel band. This indicates that bullish momentum is strong enough to push the price beyond its recent trading range.
- Sell Signal: When the price closes decisively below the lower Donchian Channel band. This signals that bearish pressure has overcome recent support levels.
From experience, the word “decisively” is key. A minor wick poking through the band isn’t enough; you want to see a full candle body close outside the channel to confirm commitment from traders. For risk management, a common practice is to place a trailing stop-loss just outside the opposite band. For a long position, the stop could trail along the lower band, allowing the trade to ride the trend while protecting profits if the market reverses.
Read More: Keltner Channel vs Donchian
2. Trend Following with Confirmation
While the breakout strategy is effective, it can generate false signals in choppy, non-trending markets. To counter this, many experienced traders add a “regime filter,” typically a long-term moving average (like the 200-period Simple Moving Average), to ensure they are only trading in the direction of the dominant, long-term trend.
How It Works:
- For Long Trades: Only consider buying on a Donchian Channel breakout above the upper band if the price is also trading *above* the 200-period SMA. This confirms the market is in a broader uptrend.
- For Short Trades: Only consider selling on a breakdown below the lower band if the price is also trading *below* the 200-period SMA, confirming a macro downtrend.
This simple addition of context can dramatically improve the win rate of a Donchian Channel strategy by preventing you from fighting the market’s main current. It’s a disciplined approach that prioritizes high-probability setups.
3. Mean Reversion with the Donchian Channel
Markets don’t trend forever. The mean reversion strategy works on the principle that after a strong price extension, the asset will likely “revert” back to its average price, represented by the middle band of the Donchian Channel. This is a more contrarian approach compared to trend following.
How It Works:
- Buy Signal (in an uptrend): When the market is in an established uptrend (confirmed by a rising 200 SMA), a dip that touches or slightly breaks the *lower* band can be seen as a temporary pullback and a buying opportunity. The expectation is a bounce back towards the middle or upper band.
- Sell Signal (in a downtrend): In a confirmed downtrend, a rally that touches the *upper* band can be seen as a short-selling opportunity, anticipating a return to the middle or lower band.
For this strategy, confirmation from an oscillator like the RSI (Relative Strength Index) is invaluable. For example, if the price hits the lower band and the RSI is in oversold territory (below 30), it strengthens the case for a long entry. The profit target is often the middle band, making it a strategy for capturing shorter price swings within a larger trend.
4. Multi-Indicator Strategies for Robust Signals
Relying on a single indicator is a common mistake. The Donchian Channel becomes exponentially more powerful when combined with other tools that measure momentum, volume, or volatility. This creates a more comprehensive view of the market.
- Donchian Channel + MACD: The Moving Average Convergence Divergence (MACD) can confirm the momentum behind a breakout. For a long signal, you’d look for a price close above the upper Donchian band *and* a bullish MACD crossover (where the MACD line crosses above the signal line).
- Donchian Channel + RSI: As mentioned in the mean reversion strategy, the RSI is excellent for identifying overbought/oversold conditions that can signal a potential reversal or pullback. A price hitting the upper band with an RSI reading over 70 is a strong warning of bullish exhaustion.
- Donchian Channel + ATR: The Average True Range (ATR) is a pure volatility indicator. It can be used to set more intelligent stop-losses. Instead of placing a stop at a fixed price, you could place it, for instance, 2x ATR value below your entry price. This adapts your risk to the current market volatility.
Read More: Breakout Trading Strategy
Finding the Best Donchian Channel Settings
One of the most frequently asked questions is about the best Donchian Channel settings. The honest answer is: it depends entirely on your trading style, the asset you’re trading, and the timeframe you’re using. There is no single “perfect” setting. However, understanding the standard configurations and how to adjust them is crucial for tailoring the indicator to your specific needs. The goal is to find a setting that filters out market noise without lagging so much that you miss the move.
Default and Popular Settings (20-Period)
The 20-period setting is the most common default on trading platforms for a reason. It was the standard used by the famous Turtle Traders, a group that Richard Dennis and William Eckhardt trained in the 1980s, who reportedly used a 20-day Donchian Channel for their entries. This setting represents approximately one month of trading days (20 days = 4 weeks).
- Why it works: The 20-period setting provides a solid balance. It’s long enough to filter out the minor fluctuations of daily price action but short enough to capture significant trends before they are over. It’s an excellent starting point for new traders and a reliable workhorse for many swing traders.
Customizing Settings for Different Strategies
A one-size-fits-all approach rarely works in trading. You must adjust the Donchian Channel to match your strategy’s time horizon.
- Scalping (Short-Term): Scalpers who trade on very short timeframes (e.g., 1-minute to 5-minute charts) need an indicator that reacts quickly to price changes. For this, shorter periods like 10 or 15 are often used. A 10-period setting on a 5-minute chart looks back at the last 50 minutes of price action, providing hyper-responsive bands for quick entries and exits.
- Swing Trading (Medium-Term): This is the sweet spot for the standard 20-period to 50-period settings. Swing traders typically hold positions for several days to a few weeks. A 20-period setting on a daily chart (looking back 20 days) or a 50-period setting on a 4-hour chart are common configurations.
- Position Trading (Long-Term): Long-term investors or position traders who hold trades for months or even years need to look at the bigger picture. They will often use much longer settings, such as 100 or even 200 periods on a daily or weekly chart, to identify and ride major secular trends.
How to Test and Find Your Optimal Setting
The only way to discover the best Donchian Channel settings for your system is through rigorous testing. This is where many aspiring traders fail—they look for a shortcut instead of doing the work.
- Backtesting: This involves applying your strategy with different settings to historical price data. Most modern trading platforms have built-in backtesting features. Test various settings (e.g., 15, 20, 30, 50 periods) on your chosen asset and timeframe. Look for the setting that produces the best metrics, such as net profit, profit factor, and a smooth equity curve.
- Demo Trading: Once you have a promising setting from backtesting, apply it in a live market environment using a demo account. This forward-testing allows you to see how the strategy performs in real-time without risking capital. It also tests your psychological ability to execute the signals.
- Asset-Specific Optimization: Remember that different assets have different volatility profiles. A setting that works wonderfully on a trending currency pair like EUR/USD may perform poorly on a choppy stock index. You must optimize your settings for each specific market you intend to trade.
Interpreting Donchian Channel Signals
Reading the Donchian Channel is like learning a new language—the language of price action. The three bands provide a dynamic map of the ongoing battle between buyers and sellers. By understanding what each signal means, you can gain deep insights into market sentiment, volatility, and potential future direction. It’s more than just lines on a chart; it’s a visual representation of market psychology.
Reading Price Action Near the Bands
The location of the current price relative to the three bands is the most fundamental piece of information the indicator offers.
- Near the Upper Band: When the price consistently “hugs” or pushes against the upper band, it signals strong, sustained bullish pressure. This is often referred to as a “Donchian Channel crawl” and is characteristic of a healthy uptrend. Traders in long positions should feel confident holding on.
- Near the Lower Band: Conversely, a price that crawls along the lower band indicates persistent bearish sentiment. It shows that sellers are in firm control, and any small rallies are being sold off quickly. This is a clear sign to stay out of long positions or maintain short ones.
- The Middle Band: The middle band acts as a dynamic support and resistance level or a mean. In an uptrend, pullbacks often find support near the middle band before resuming the trend. In a downtrend, rallies may stall at the middle band. It also serves as a common-sense profit target for mean reversion trades.
Identifying Trend, Breakouts, and Reversals
The Donchian Channel excels at visually defining the market state.
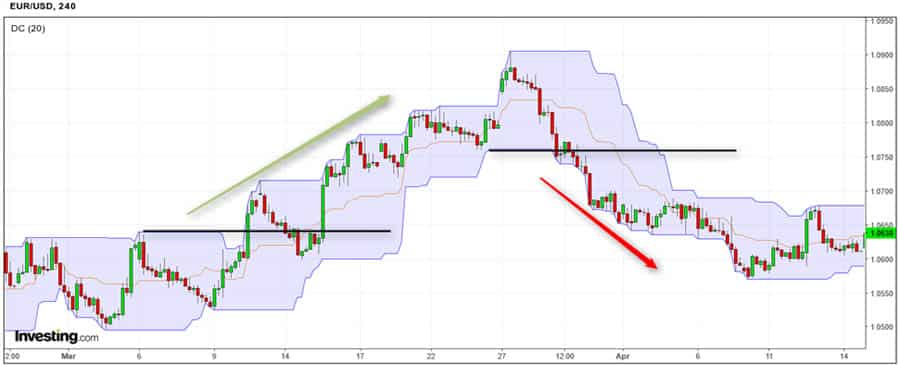
- Trending Markets: An established trend is characterized by the entire channel structure angling upwards (for an uptrend) or downwards (for a downtrend). During a strong uptrend, the price will be making higher highs (pushing the upper band up) while the lower band also follows, creating higher lows.
- Breakouts: The classic Donchian Channel breakout is the most powerful signal. A breakout above the upper band of a previously flat or narrowing channel is a high-conviction signal that a new uptrend may be starting.
- Reversals: Reversals can sometimes be spotted by a “failure” signal. For instance, in a strong uptrend, if the price fails to make a new high for an extended period and then breaks below the middle band, it could be an early warning that the trend is losing momentum and a reversal might be underway.
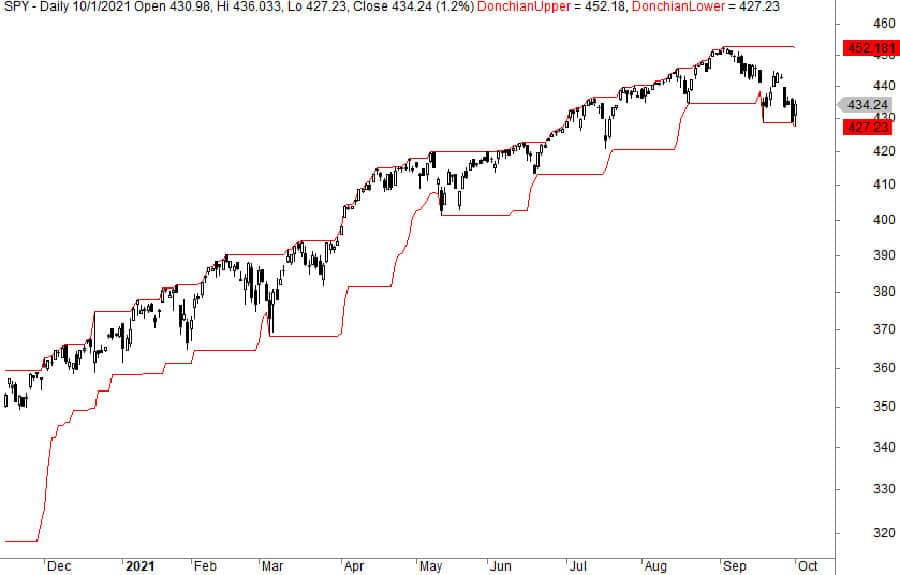
Measuring Volatility via Channel Width
The distance between the upper and lower bands is a direct measure of an asset’s volatility over the lookback period. This is one of the indicator’s most underutilized features.
- Expanding Channel: When the channel widens, it means volatility is increasing. This typically happens during strong trends or after major news events when the price is making new highs and new lows more rapidly.
- Contracting Channel: When the channel becomes very narrow, it signifies a period of low volatility and consolidation. Traders often refer to this as the market “coiling” or “squeezing.” From my experience, these are the periods to pay close attention to, as they often precede a powerful breakout in one direction or the other. Low volatility is almost always followed by high volatility.
Donchian Channel Basics and Origin
To truly master a tool, it helps to understand its construction and the philosophy of its creator. The Donchian Channel is a testament to the idea that successful trading systems don’t need to be overly complex. Its elegance lies in its simplicity and its foundation in the most basic principles of price action. It was developed by Richard Donchian, a pioneer in the field of managed futures and systematic trend-following.
How the Donchian Channel Works (The Formula)
The indicator is composed of three lines calculated based on recent price action. There are no complex statistical calculations like standard deviations involved, which makes it very different from indicators like Bollinger Bands.
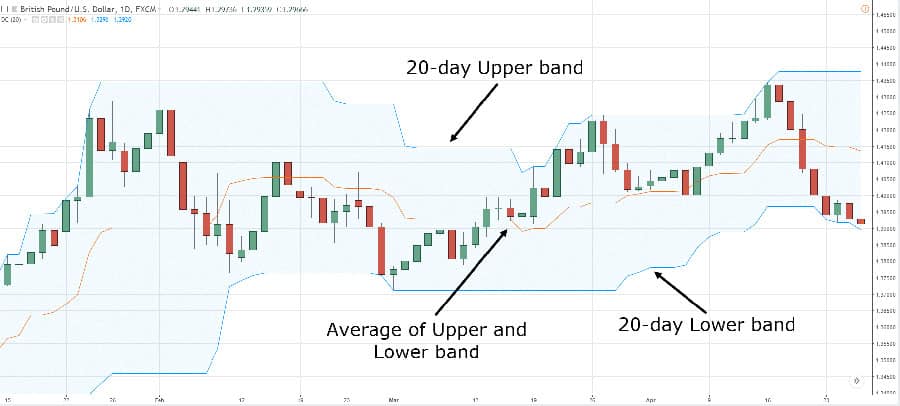
- Upper Band: The highest high price over the last ‘N’ periods.
- Lower Band: The lowest low price over the last ‘N’ periods.
- Middle Band: The average of the Upper and Lower Bands [(Upper Band + Lower Band) / 2].
For example, if you are using a 20-period setting on a daily chart, the upper band will mark the single highest price reached in the last 20 days. The lower band will mark the single lowest price in the last 20 days. It’s that simple. When a new day begins, the calculation looks back at the most recent 20 days, dropping the oldest day from the calculation. This is why the bands move and adjust with the market.
History and Origin: The Father of Trend Following
The Donchian Channel was created by Richard Davoud Donchian (1905-1993), an Armenian-American commodities and futures trader often referred to as “The Father of Trend Following.” He began his career on Wall Street in the 1930s and spent decades refining his technical, rules-based approach to trading.

Donchian believed that markets moved in trends and that the most profitable strategy was to identify and follow these trends. He developed the channel as a simple but effective tool to define the trend and provide clear, unambiguous entry and exit signals. His work laid the foundation for systematic trading and heavily influenced many successful traders, most notably the “Turtle Traders.” His legacy is the proof that a disciplined, trend-following Donchian Channel strategy can be a robust path to long-term trading success.
Advanced Application and Pro Tips
Once you are comfortable with the basics, you can begin to integrate more advanced techniques to refine your trading edge. These pro tips are gathered from years of practical application and observing common pitfalls. They focus on sophisticated risk management, filtering out bad trades, and maintaining psychological discipline—the real keys to longevity in this business.
Advanced Risk Management Techniques
A good strategy gets you into a trade, but a great risk management plan keeps you in the game. With the Donchian Channel, you can move beyond basic stop-losses.
- The Middle Band as a “Decision Point”: For trend-following trades, the middle band is more than just a potential profit target; it’s a critical decision point. A close below the middle band in an uptrend (or above it in a downtrend) can be used as a signal to tighten your stop-loss or even take partial profits. It’s the market’s first warning sign that the immediate momentum is waning.
- Volatility-Based Stop-Loss (Using ATR): As mentioned earlier, using the ATR to set your stop-loss is a pro-level technique. When you enter a Donchian Channel breakout trade, calculate the ATR value at that moment. Place your initial stop-loss a multiple of that ATR (e.g., 1.5x or 2x ATR) away from your entry. This ensures your stop is wider in volatile markets and tighter in quiet markets, adapting your risk to the current environment.
Best Practices from Real Traders
These are the unwritten rules that separate consistently profitable traders from the crowd.
- Use a Regime Filter: This is worth repeating because it’s so important. A long-term moving average (like the 200 SMA or EMA) acts as a “regime filter.” It answers the question: “Is the market in a trending or ranging regime?” Only take Donchian Channel breakout signals in the direction of the long-term trend. This simple rule will save you from countless frustrating whipsaws in sideways markets.
- Patience During Contractions: When the Donchian Channel narrows significantly, it’s a sign of a low-volatility squeeze. The temptation is to get impatient and guess the direction of the next move. Don’t. A professional trader waits patiently for the market to show its hand. Wait for the decisive breakout and the confirmation of a candle close outside the channel before committing capital. The explosive move that often follows is worth the wait.
- Avoid Signal-Chasing: Don’t jump on a signal just because it occurred. Always check the context. Was the breakout strong or weak? Is volume confirming the move? Is it aligned with the higher timeframe trend? Chasing every signal without confirmation is a recipe for disaster.
Comparing Donchian Channels to Other Indicators
No indicator exists in a vacuum. Understanding how the Donchian Channel compares to other popular channel-based indicators like Bollinger Bands and Keltner Channels can help you decide which one is best suited for your strategy and the current market conditions. Each has its own strengths and weaknesses.
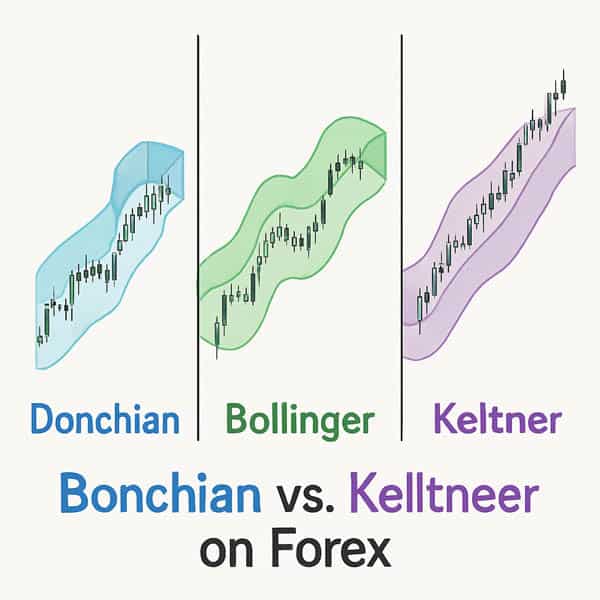
Donchian Channels vs. Bollinger Bands
This is the most common comparison, as both are volatility channels. However, their calculation and interpretation are fundamentally different.
- Calculation: Donchian Channels are based purely on the highest high and lowest low. Bollinger Bands are based on a simple moving average (the middle band) and then use a statistical measure of standard deviation to plot the upper and lower bands.
- Interpretation: Because of the standard deviation calculation, Bollinger Bands expand and contract more dynamically with short-term volatility. A Donchian Channel is more rigid; its bands only move when a new absolute high or low is made in the lookback period.
- Best Use Case: The Donchian Channel is superior for identifying clear breakout levels and for pure trend-following strategies. Its signals are unambiguous. Bollinger Bands are often preferred for mean-reversion strategies, as the price touching the outer bands can signal an “overstretched” or statistically unlikely move that is due for a reversal back to the middle band (the moving average).
Donchian Channels vs. Keltner Channels
Keltner Channels are something of a hybrid between Donchian Channels and Bollinger Bands.
- Calculation: Like Bollinger Bands, a Keltner Channel starts with a moving average (typically an Exponential Moving Average) for its middle line. However, to create the upper and lower bands, it adds and subtracts a multiple of the Average True Range (ATR), not the standard deviation.
- Interpretation: Because Keltner Channels use ATR (a measure of volatility), they provide a smoother, less lagging channel than Donchian Channels. They are excellent for identifying the general trend and pullbacks. A price close outside a Keltner Channel is also a valid trend signal, but it tends to happen more frequently than a Donchian Channel breakout.
- Best Use Case: Many traders use Keltner Channels and Donchian Channels together. For example, a trader might wait for a breakout of the Keltner Channel as an early warning, but only enter the trade when the price also breaks the more significant Donchian Channel level. Keltner Channels are superb for gauging trend strength and identifying valid pullback zones within a trend.
Trade with a Trusted and Innovative Broker
Take your trading to the next level with Opofinance, a globally recognized and ASIC-regulated broker. Benefit from a suite of powerful tools and features designed for modern traders.
- Advanced Trading Platforms: Choose from industry-leading platforms including MT4, MT5, cTrader, and the proprietary OpoTrade app.
- Innovative AI Tools: Gain a competitive edge with our AI Market Analyzer, AI Coach, and instant AI Support.
- Flexible Trading Options: Explore opportunities in Social Trading and Prop Trading to diversify your strategies.
- Secure & Flexible Transactions: Enjoy peace of mind with safe and convenient deposits and withdrawals, including crypto payments with zero fees.
Join thousands of traders who trust Opofinance for its reliability and cutting-edge technology. Start Trading with Opofinance Today!
Conclusion
The Donchian Channel has remained a staple in the technical analyst’s toolbox for decades for one simple reason: it works. It provides a clear, clutter-free view of what matters most—price action, trend, and volatility. From executing a classic Donchian Channel breakout to crafting a nuanced mean-reversion plan, its versatility is undeniable. The key to success lies not in the indicator itself, but in your disciplined application of a well-tested Donchian Channel strategy, sound risk management, and a commitment to continuous learning and adaptation.
Is Donchian Channel a lagging or leading indicator?
The Donchian Channel is a lagging indicator. Its calculations are based entirely on past price action (the highest high and lowest low over a previous period), so it confirms a trend or breakout after it has already begun, rather than predicting it in advance.
How do you use the Donchian Channel middle line?
The middle line serves two primary purposes: as a measure of the medium-term trend or “mean,” and as a dynamic support/resistance level. In trend-following, a break of the midline can be an early exit signal. In mean-reversion strategies, it’s often used as a profit target.
Can the Donchian Channel be used for cryptocurrency trading?
Yes, absolutely. The principles of the Donchian Channel are universal because they are based on price behavior. It is highly effective in cryptocurrency markets, which are known for their strong trends and high volatility, making them ideal for breakout strategies.
What is a “Donchian Channel Squeeze”?
A “squeeze” occurs when the upper and lower bands of the channel move very close together, indicating a period of extremely low volatility and price consolidation. This is a crucial pattern to watch, as these low-volatility periods are often followed by a significant and powerful price breakout.
What is the main difference between Donchian Channel and Bollinger Bands?
The main difference is their calculation. Donchian Channels use the simple highest high and lowest low, making them fixed to price extremes. Bollinger Bands use a moving average and standard deviation, making them a statistical measure of volatility. This makes Donchians better for clean breakout levels and Bollinger Bands better for mean-reversion signals.


