

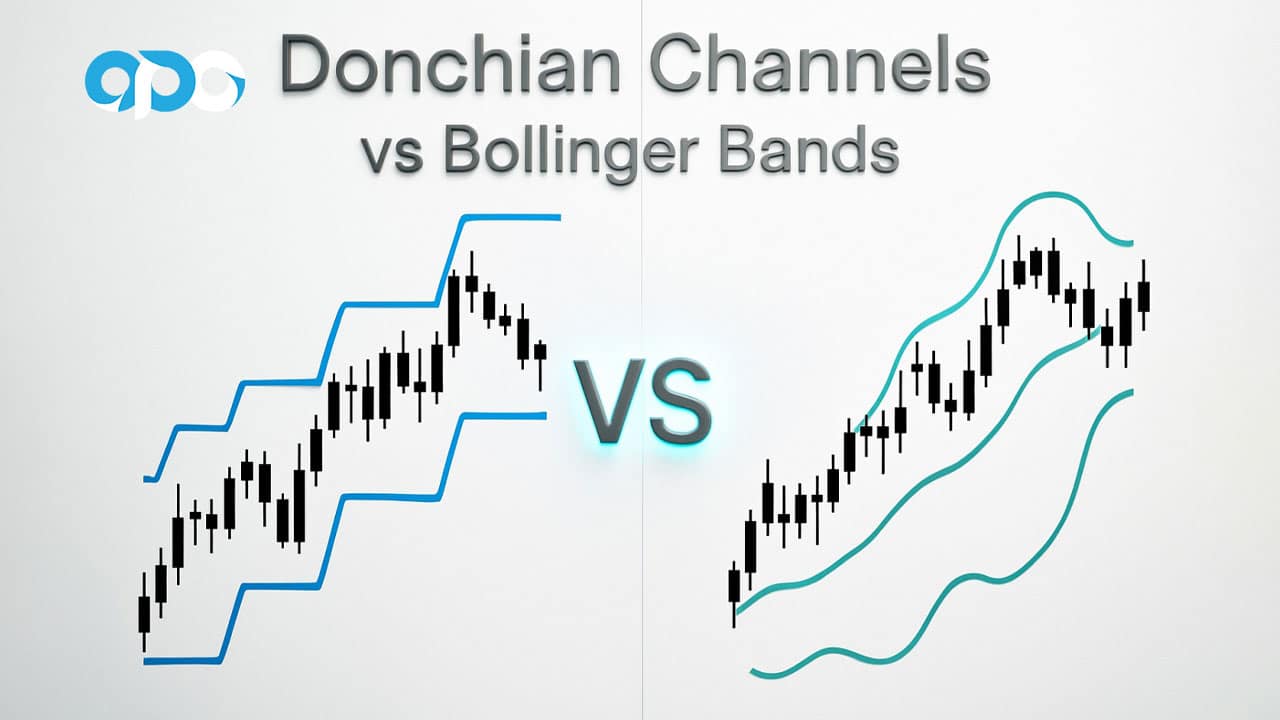
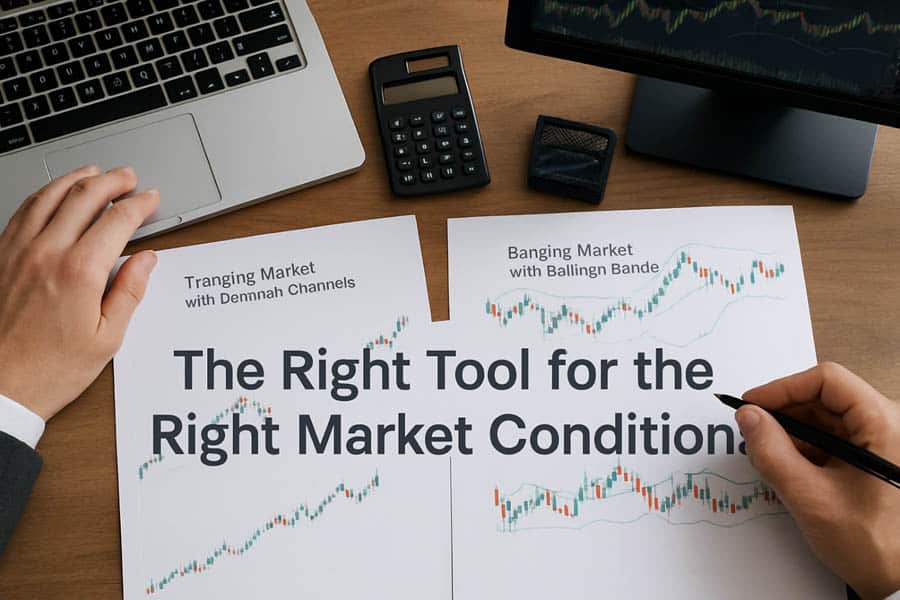
In the world of technical analysis, the debate over Donchian Channels vs Bollinger Bands is a foundational one for traders aiming to refine their strategies. The core question—which is better?—has a nuanced answer: it depends entirely on your trading style, the market conditions you’re facing, and your risk tolerance. Donchian Channels are superior for identifying clear trends and breakouts, while Bollinger Bands excel in measuring volatility and spotting mean-reversion opportunities. This guide will dissect both indicators, helping you decide which tool, or combination of tools, is the right fit for your strategy when working with an online forex broker.
Key Takeaways
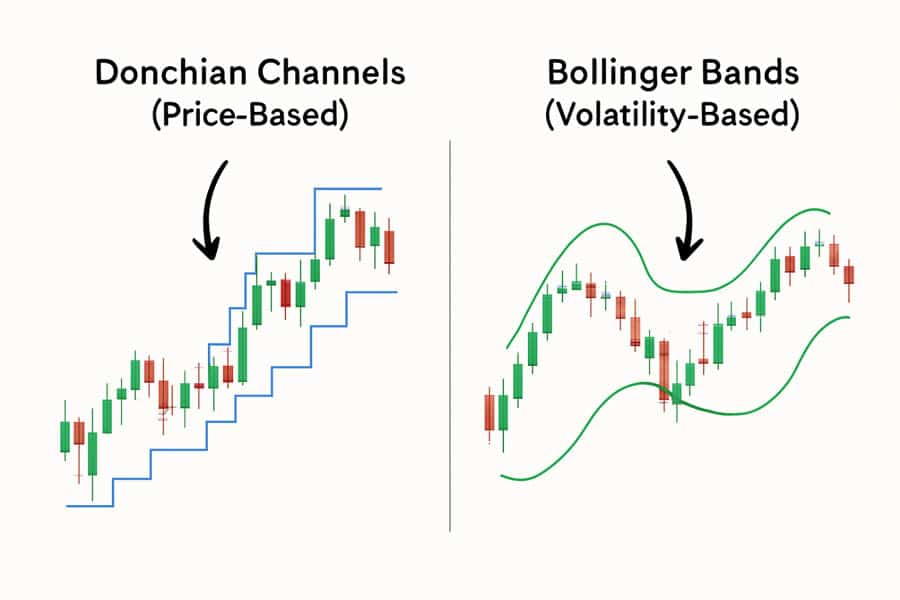
- Core Difference: Donchian Channels are based on price action (highest high/lowest low), while Bollinger Bands are based on volatility (standard deviation).
- Best Use Case: Donchian Channels are ideal for trend-following and breakout strategies in clearly trending markets. Bollinger Bands are versatile, used for both mean-reversion in ranging markets and breakout signals after a volatility squeeze.
- Signal Generation: Donchian Channels provide unambiguous breakout signals. Bollinger Bands offer more subtle clues about overbought/oversold conditions and impending volatility.
- Trader Profile: Patient, trend-following traders often prefer Donchian Channels. Active traders who adapt to both ranging and trending markets may lean towards Bollinger Bands.
- Hybrid Strategy: Using both indicators together can filter false signals and create a more robust trading system.
Quick Comparison: Donchian vs Bollinger
Before we dive deep, let’s establish a clear, at-a-glance comparison. Understanding these fundamental differences is the first step in determining which indicator aligns better with your trading approach. This table highlights the core distinctions between Donchian Channels vs Bollinger Bands.
| Feature | Donchian Channels | Bollinger Bands |
| Calculation Method | Based on the highest high and lowest low over a set period. | Based on a Simple Moving Average (SMA) plus/minus standard deviations. |
| Primary Trading Signal | Price breakouts above the upper band or below the lower band. | Mean reversion (price returning to the middle band) and volatility breakouts (Squeeze). |
| Volatility Detection | Channel width reflects historical price range, not statistical volatility. | Bandwidth directly measures and visualizes market volatility. Bands widen in high volatility and narrow in low volatility. |
| Best Market Conditions | Strongly trending markets (up or down). | Ranging markets (for mean reversion) and periods of low volatility preceding a trend (for breakouts). |
| Chart Appearance | Creates a step-like, rectangular channel that flattens in sideways markets. | Creates smooth, dynamic bands that expand and contract around the price. |
| Indicator Flexibility | Primarily adjusted by changing the lookback period (e.g., 20, 50). | Adjusted by changing both the period and the standard deviation multiple. |
What Are Donchian Channels?
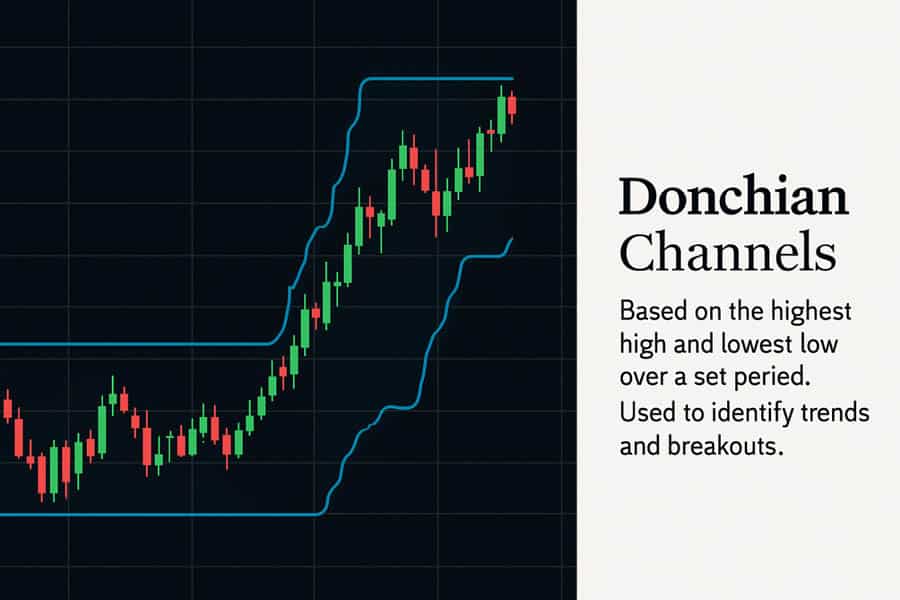
Donchian Channels are a straightforward yet powerful technical indicator developed by the famous futures trader Richard Donchian. At their core, they are designed to capture trends by plotting the highest high and the lowest low of an asset’s price over a preceding period, creating a visual channel around the price action. The default setting is typically a 20-period lookback.
Calculation and Visualization
The calculation is beautifully simple and rooted purely in price, not complex statistical formulas. This simplicity is a key part of its appeal.
- Upper Channel: The highest high over the last ‘n’ periods (e.g., 20 days).
- Lower Channel: The lowest low over the last ‘n’ periods (e.g., 20 days).
- Centerline (Optional): The average of the upper and lower channels.
On a chart, this creates a channel with flat tops and bottoms. When a new high is made, the upper band steps up to that level and stays there until a new, higher high is made within the lookback period. The same logic applies in reverse for the lower band. This visual “stair-step” pattern is a hallmark of Donchian Channels.
Practical Applications for Traders
The primary purpose of Donchian Channels is trend identification and breakout confirmation. Because the bands represent the absolute price range over a period, a price move that breaks outside of this channel is, by definition, a significant event. It signals that momentum is strong enough to push the asset into new territory. This makes it a favorite tool for systematic trend-followers who want clear, objective rules for entering and exiting trades, a crucial aspect when considering donchian channels vs bollinger bands for trading.
Read More: Donchian Channel
How Donchian Channels Are Used in Trading
The practical application of Donchian Channels revolves around a core principle: “buy strength, sell weakness.” This indicator provides clear, rule-based signals that eliminate much of the guesswork and emotional decision-making from trading. Many traders appreciate this clarity, especially when comparing the donchian channels vs bollinger bands user experience, which can sometimes feel more subjective.
Trend Identification and Breakouts
The most common strategy is the breakout system. The rules are simple:
- Entry Signal (Long): Enter a long position when the price closes above the upper Donchian Channel. This confirms the start of a new uptrend or the continuation of an existing one.
- Entry Signal (Short): Enter a short position when the price closes below the lower Donchian Channel. This indicates a new downtrend has begun.
This method was famously used by the “Turtle Traders,” a group of novice traders whom Richard Dennis and William Eckhardt taught a set of strict trend-following rules in the 1980s, turning them into highly successful traders. Their system relied heavily on Donchian-style breakouts.
Setting Stops and Exits
Donchian Channels also provide a dynamic way to manage risk. A common stop-loss technique is to use the opposite band as a trailing stop.
- For a Long Position: The stop-loss can be placed at the lower Donchian Channel. As the price moves up and makes new lows (at a higher level), the lower channel steps up, effectively trailing the stop and locking in profits.
- For a Short Position: The stop-loss is placed at the upper channel, which trails downwards as the price falls.
The centerline can also be used as an exit signal. For example, a trader might exit a long position if the price closes below the middle line, suggesting that momentum is waning.
Experience-Based Tips
From experience, the biggest weakness of Donchian Channels is their performance in ranging or choppy markets. In such conditions, the price may frequently poke above the upper band or below the lower band, generating a false breakout signal, only to reverse back into the range. This can lead to a series of small, frustrating losses, known as “whipsaws.” Therefore, it’s often wise to use Donchian Channels in conjunction with a trend-confirming indicator, like a long-term moving average (e.g., 200-period MA), to ensure you’re only taking breakout signals in the direction of the primary trend.
What Are Bollinger Bands?
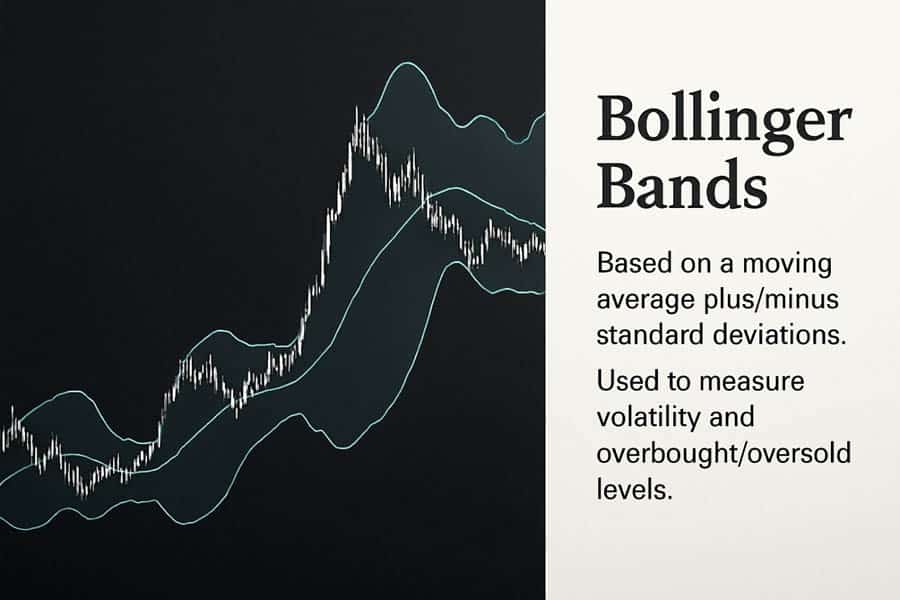
Bollinger Bands, developed by renowned technical analyst John Bollinger in the 1980s, are a volatility-based indicator. Unlike Donchian Channels, which focus on price highs and lows, Bollinger Bands measure how dispersed prices are from an average. They consist of a middle band and two outer bands, creating a dynamic envelope that expands and contracts with market volatility.
Calculation and Visualization
The calculation is based on statistics, specifically standard deviation, which is a measure of how spread out numbers are.
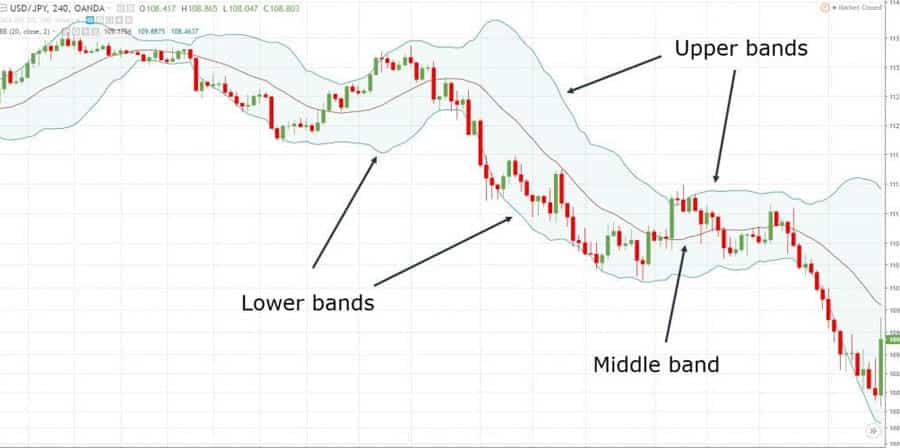
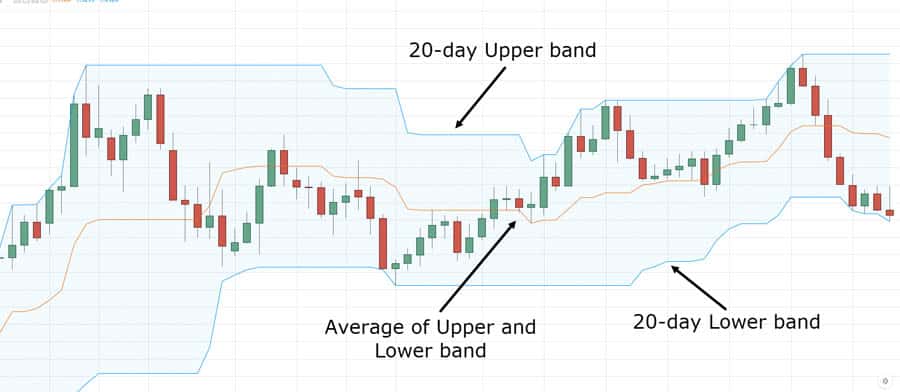
- Middle Band: An ‘n’-period Simple Moving Average (SMA), typically with a default setting of 20.
- Upper Band: The Middle Band plus ‘k’ standard deviations. The default ‘k’ is 2.
- Lower Band: The Middle Band minus ‘k’ standard deviations.
Visually, this creates smooth bands that flow with the price. When volatility is high, the bands move far apart (expand). When the market is quiet and volatility is low, the bands move closer together (contract or “squeeze”). This visual representation of volatility is a key point in the Donchian Channels vs Bollinger Bands debate.
Main Applications
Bollinger Bands are exceptionally versatile. Their primary applications are:
- Volatility Analysis: The width of the bands is a direct indicator of market volatility, helping traders anticipate potential breakouts.
- Overbought/Oversold Detection: Prices are considered relatively high when they touch the upper band and relatively low when they touch the lower band. This forms the basis for mean-reversion strategies.
This dual-purpose nature makes them a favorite among traders who need to adapt to different market phases.
Read More: Fractals Indicator in Forex Trading
How Bollinger Bands Are Used in Trading
The flexibility of Bollinger Bands allows for several distinct trading strategies, catering to both range-bound and trending environments. Mastering these approaches is key to leveraging this indicator effectively, especially when evaluating donchian channels vs bollinger bands for trading.
Mean Reversion and Breakout Trading
Bollinger Bands are famous for two opposing but equally valid strategies:
- Mean Reversion (“Fading”): In a ranging market, the bands often act as dynamic support and resistance levels. The theory is that price has a tendency to return to the middle band (the mean). A trader might sell when the price hits the upper band or buy when it hits the lower band, anticipating a reversal. This strategy requires confirmation from other indicators (like RSI) to avoid trading against a strong trend.
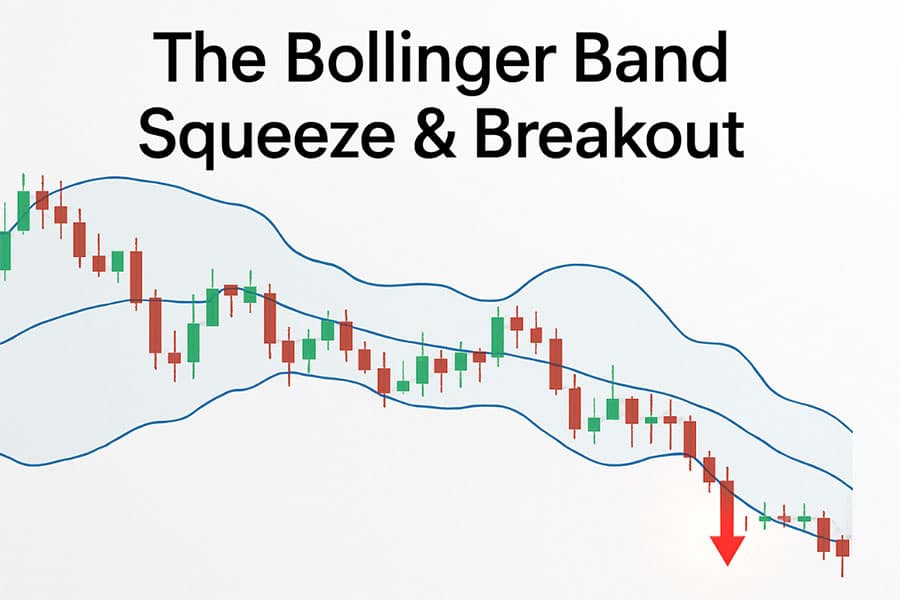
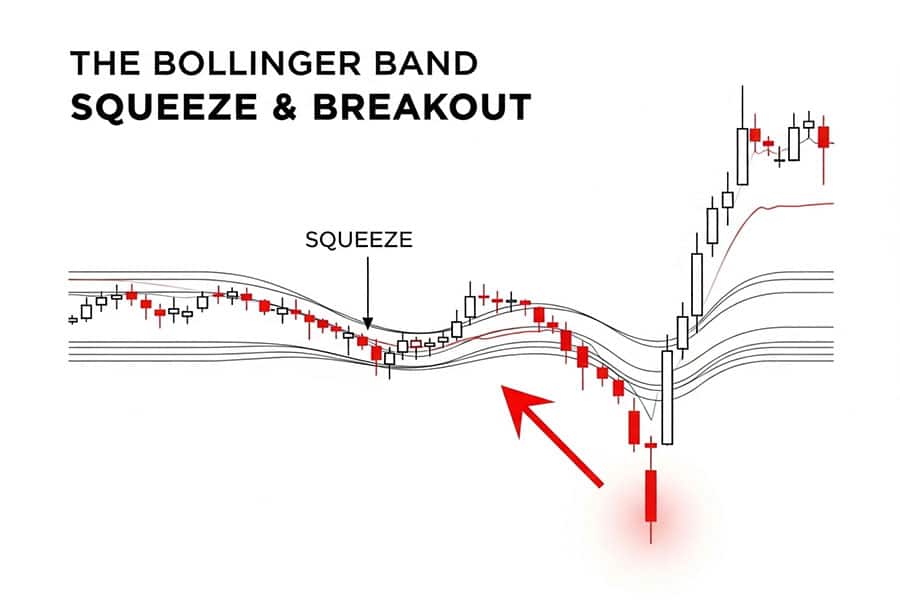
- Volatility Breakout (“The Squeeze”): This is perhaps the most powerful Bollinger Band signal. When the bands narrow significantly, it indicates a period of very low volatility. John Bollinger noted that periods of low volatility are often followed by periods of high volatility. A “Squeeze” signals that the market is coiling for a big move. The breakout direction is often confirmed when the price closes decisively outside one of the bands after a Squeeze.
Identifying Volatility Changes
A core part of the donchian channels vs bollinger bands user experience is how they communicate market state. Bollinger Bands excel at this. When the bands begin to widen after a period of being narrow, it’s a clear signal that volatility is entering the market and a trend may be starting. Conversely, when bands that were wide start to move closer together, it can signal that a trend is losing momentum and the market may be entering a consolidation phase. This “breathing” of the bands provides continuous feedback on market energy.
User Experience and False Signals
A common mistake for beginners is to automatically sell every time the price touches the upper band. In a strong uptrend, the price can “walk the band,” continuously hitting or riding along the upper band for an extended period. This would lead to repeated losses for a mean-reversion trader. To avoid this, experienced traders look for confirmation: a bearish candle pattern, a divergence on an oscillator like the RSI, or the bands starting to narrow before they consider a short position. This highlights a key difference in the Donchian Channels vs Bollinger Bands comparison: Bollinger Bands require more interpretive skill.
Donchian Channels vs Bollinger Bands: Key Differences
While both indicators create channels on a price chart, their underlying logic and the signals they produce are fundamentally different. Understanding this is crucial when deciding donchian channel vs bollinger bands which is better for your specific needs.
- Basis of Calculation: This is the most critical distinction. Donchian Channels are purely price-based, reflecting the highest and lowest price points over a period. They tell you *where* the price extremes were. Bollinger Bands are volatility-based, using standard deviation to measure price dispersion around an average. They tell you how *volatile* the price is relative to its recent history.
- Response to Market Volatility: Bollinger Bands are proactive. They expand and contract in direct response to changes in volatility, often signaling a potential breakout *before* it happens with a Squeeze. Donchian Channels are reactive. The channel only widens after a new high or low has already been made, confirming the result of volatility, not its buildup.
- Signal Generation: Donchian Channels provide clear, unambiguous breakout signals. A close outside the channel is a call to action. Bollinger Bands provide a wider array of more nuanced signals. A touch of a band can be a signal for mean reversion, a Squeeze is a signal of consolidation, and a breakout from a Squeeze is a trend signal. This requires more interpretation from the trader.
- Flexibility and Parameters: Both can be adjusted by changing the lookback period. However, Bollinger Bands have a second variable: the standard deviation multiple. A trader can make the bands wider (e.g., 2.5 SD) to filter out noise or narrower (e.g., 1.5 SD) to get more signals, offering an extra layer of customization.
In a real-world scenario, a trend-following trader might prefer Donchian Channels during a strong bull run in a stock index, as it provides clear entry points and a simple trailing stop mechanism. In contrast, a forex trader dealing with a typically ranging currency pair like EUR/CHF might find more value in Bollinger Bands to trade bounces off the outer bands and to watch for a Squeeze that signals a potential change in market regime.
Donchian Channel vs Bollinger Bands: Which Is Better?
So, when it comes to the ultimate question of donchian channel vs bollinger bands which is better, the definitive answer is: the “better” indicator depends entirely on the trader’s strategy, the asset being traded, and the current market conditions. Neither is universally superior. Donchian Channels are the preferred tool for systematic trend-followers who require clear, objective breakout signals and a simple risk management framework. Bollinger Bands are favored by versatile traders who want to analyze volatility, trade mean-reversion strategies in ranging markets, and identify potential breakouts from consolidation.
Ultimately, the choice in the Donchian Channels vs Bollinger Bands matchup comes down to a preference for simplicity and trend (Donchian) versus flexibility and volatility analysis (Bollinger). For a risk-averse trader in a trending market, Donchian Channels offer unmatched clarity. For an active trader navigating both choppy and trending environments, the adaptive nature of Bollinger Bands provides more opportunities.
User Case Studies & Real-World Experience
Theory is one thing, but practical application reveals the true character of an indicator. The donchian channels vs bollinger bands user experience often highlights specific scenarios where one clearly outshines the other.
When Donchian Channels Outperform
Imagine a scenario with a cryptocurrency like Bitcoin entering a strong bull market after months of consolidation.
- The Setup: The price has been trading sideways, causing Donchian Channels to be narrow and flat. A trader has been waiting patiently for a decisive move.
- The Signal: The price suddenly surges and closes significantly above the 20-day upper Donchian Channel. This is an unambiguous buy signal.
- The Trade: The trader enters a long position. As the price continues to rally, making new highs, the lower Donchian Channel acts as a perfect trailing stop, moving up with the trend and protecting profits without cutting the trade short prematurely. In this clean, trending environment, Bollinger Bands might have given premature overbought signals as the price “walked the upper band,” potentially causing a trader to exit too early. Many users report that for capturing the entirety of a major trend, Donchian Channels are simpler and more effective.
When Bollinger Bands Deliver More Value
Now, consider a major forex pair like EUR/USD, which is known for spending significant time in ranging patterns before a breakout.
- The Setup: The pair is trading within a well-defined range. The Bollinger Bands are relatively parallel and wide, defining the upper and lower boundaries of the range.
- The Signal (Phase 1 – Range): A trader can use the bands for mean-reversion, selling near the upper band and buying near the lower band, with the 20-period SMA as a profit target. The donchian channels vs bollinger bands user experience here is one of activity versus patience; Bollinger Bands allow for trading within the range while Donchian Channels would remain dormant.
- The Signal (Phase 2 – Squeeze): The range trading subsides, and volatility dries up. The Bollinger Bands contract dramatically, signaling a Squeeze. This warns the trader that the ranging strategy is over and a powerful move is imminent.
- The Trade: The price breaks out forcefully below the lower band. The trader enters a short position, capturing the start of a new downtrend right as it begins. Donchian Channels would have only confirmed this breakout later, once a new 20-day low was established.
As one trader on a forum summarized, “I use Donchian for my long-term stock portfolio to ride trends. I use Bollinger Bands for my intraday forex trading to scalp ranges and catch volatility pops. It’s about using the right tool for the right job.” This perfectly encapsulates the optimal approach to the Donchian Channels vs Bollinger Bands choice.
Read More: Keltner Channels vs Bollinger Bands
Advanced Strategies: Combining Both Indicators
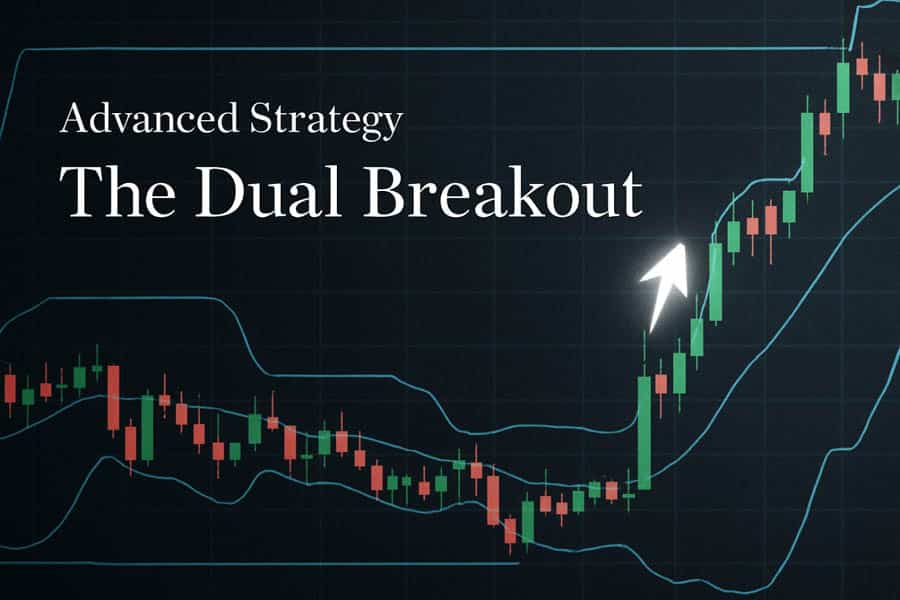
Why choose one when you can use both? Advanced traders often combine indicators to filter out noise and increase the probability of a successful trade. Using Donchian Channels and Bollinger Bands together creates a powerful system that leverages the strengths of each, providing a more complete picture of market dynamics.
The Donchian Bollinger Band Squeeze
This is a powerful hybrid strategy designed to confirm high-probability breakouts. It combines the volatility signal from Bollinger Bands with the breakout confirmation of Donchian Channels.
- Identify the Bollinger Band Squeeze: First, look for the classic Squeeze signal—the Bollinger Bands narrowing to a tight channel, indicating extremely low volatility. This is the “calm before the storm.”
- Overlay Donchian Channels: Apply Donchian Channels (e.g., 20-period) over the same chart. During the Squeeze, the price will likely be trading well within the Donchian Channel boundaries.
- Wait for the Dual Breakout: The entry signal occurs when the price breaks out of the Bollinger Bands *and* subsequently closes outside the Donchian Channel. A breakout of both indicators provides a much stronger confirmation that a new, powerful trend has begun, as it confirms both a volatility expansion and a price-range break.
This technique helps filter out “head fakes” where the price might briefly poke outside a Bollinger Band but fails to establish a new high or low required to break the Donchian Channel. It forces you to wait for true momentum.
Limitations and Best Practices
No indicator is a holy grail. Both Donchian Channels and Bollinger Bands have limitations that traders must be aware of to avoid costly mistakes. Adhering to best practices can mitigate many of these risks.
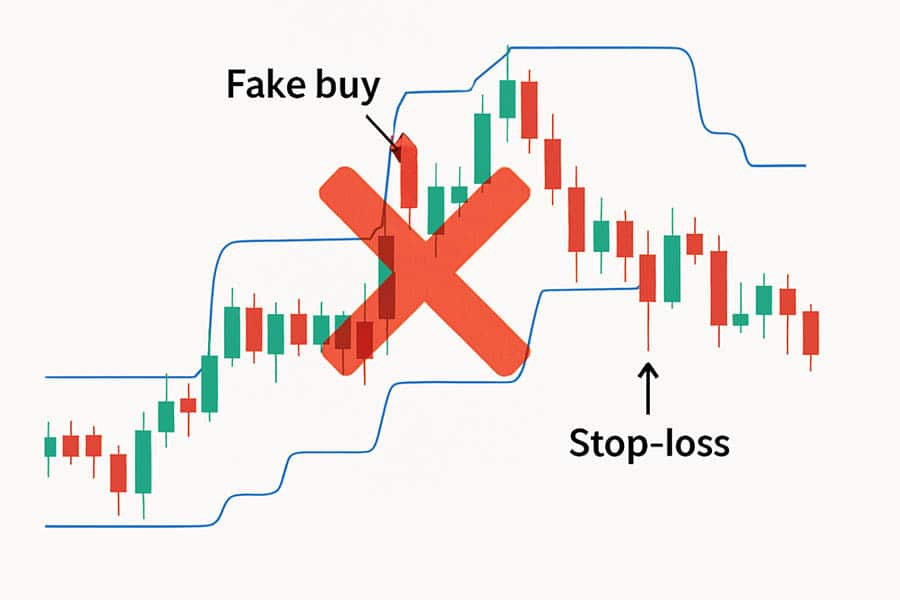
Common Pitfalls
- False Breakouts (Whipsaws): This is the primary weakness of Donchian Channels in non-trending markets. The price breaks out, triggers an entry, and immediately reverses, hitting your stop.
- Lagging Signals: Both indicators are lagging by nature because they are based on past price data. They confirm a trend or breakout after it has already started, meaning you will never catch the exact top or bottom.
- Subjectivity in Volatile Trends (Bollinger Bands): As mentioned, prices “walking the band” in a strong trend can give false mean-reversion signals. A trader must learn to differentiate a true overbought/oversold condition from a strong, sustained trend.
- Parameter Sensitivity: The default settings (20 periods for both) may not be optimal for all assets or timeframes. A setting that works for a daily chart on a stock may not work for a 1-hour chart on a forex pair.
Tips from Experience
To use these tools effectively, always remember to:
- Confirm with Other Tools: Never rely on a single indicator. Use volume analysis, chart patterns, or oscillators like the RSI or MACD to confirm signals.
- Understand the Market Context: Before applying either indicator, ask yourself: is the market trending or ranging? Use Donchian Channels for the former and consider Bollinger Bands for the latter (or for Squeeze setups).
- Backtest Your Strategy: Before risking real capital, backtest different settings on historical data for the asset you want to trade. This will help you find the optimal parameters and understand how the indicator behaves in different market conditions. This is essential for building a robust approach to donchian channels vs bollinger bands for trading.
Trade Smarter with Opofinance
Elevate your trading with a broker that provides cutting-edge tools and a secure environment. The ASIC-regulated broker, Opofinance, offers a comprehensive trading experience designed for modern traders.
- Advanced Trading Platforms: Choose from MT4, MT5, cTrader, and the proprietary OpoTrade platform.
- Innovative AI Tools: Gain an edge with the AI Market Analyzer, AI Coach, and instant AI Support.
- Flexible Trading Options: Explore Social Trading and Prop Trading opportunities.
- Secure & Flexible Transactions: Enjoy safe and convenient deposits and withdrawals, including crypto payments with zero fees.
Conclusion: Making the Right Choice
The debate over Donchian Channels vs Bollinger Bands is not about finding a single winner, but about understanding which tool is best suited for a specific task. Donchian Channels offer unparalleled clarity for trend-following and breakout trading. Bollinger Bands provide a sophisticated measure of volatility, making them ideal for identifying market phases and trading both ranges and breakouts. The most adept traders learn the strengths of both, applying them where they fit best or even combining them to create a more robust analytical framework.
Are Donchian Channels easier for beginners?
Yes, generally. Their signals are based on simple high/low breakouts, which are less open to interpretation than the more nuanced signals of Bollinger Bands, making them a good starting point for learning rule-based trading.
Which indicator is better for high-volatility assets like crypto?
Both can be effective. Bollinger Bands are excellent for visualizing the extreme volatility, while Donchian Channels are great for capturing the powerful, sustained trends that cryptocurrencies often experience. The choice depends on whether you want to trade the volatility itself or follow the trend.
Can I use both Donchian Channels and Bollinger Bands on the same chart?
Absolutely. As discussed in the advanced strategies section, using them together can be very powerful. A Bollinger Band Squeeze occurring inside a Donchian Channel is a high-probability setup for a significant breakout.
How do I adjust the parameters for different timeframes?
A general rule of thumb is to use longer periods for longer timeframes (e.g., 50-period on a daily chart) and shorter periods for shorter timeframes (e.g., 10 or 12-period on an hourly chart). Always backtest to find what works best for your specific strategy.
Besides breakouts, what is the Donchian centerline used for?
The centerline can act as a first warning signal. In an uptrend, if the price pulls back and closes below the centerline, it can suggest weakening momentum and might be a signal to tighten a stop-loss or take partial profits before the trend fully reverses.


