Imagine being able to spot the exact moment when a market trend is about to shift—before the crowd catches on. The Engulfing Candlestick Pattern gives you this power. It’s one of the most reliable and dynamic signals in technical analysis, offering traders a clear indication of market reversals or trend continuations. Whether you’re navigating the volatility of forex, stocks, or commodities, mastering this pattern—especially when trading with a broker for forex—can drastically improve your ability to predict price movements and time your trades to perfection.
In this guide, we’ll break down everything you need to know about the Engulfing Candlestick Pattern, from understanding its types and how to identify it on charts, to strategies that maximize its potential. Additionally, we’ll show you how choosing a regulated broker like Opofinance can supercharge your trading with the right tools and support. By the end, you’ll not only understand how to spot these powerful patterns but also how to use them to enhance your overall trading success.
What is the Engulfing Candlestick Pattern?
The Engulfing Candlestick Pattern is a powerful two-candle formation in technical analysis that signals a potential reversal in market sentiment. This pattern occurs when a smaller candlestick is followed by a larger one, with the second candle completely “engulfing” the body of the first. This engulfing action reflects a decisive shift in market momentum, with either buyers or sellers gaining dominance over the price action.
Read More: Shooting Star Candlestick Pattern
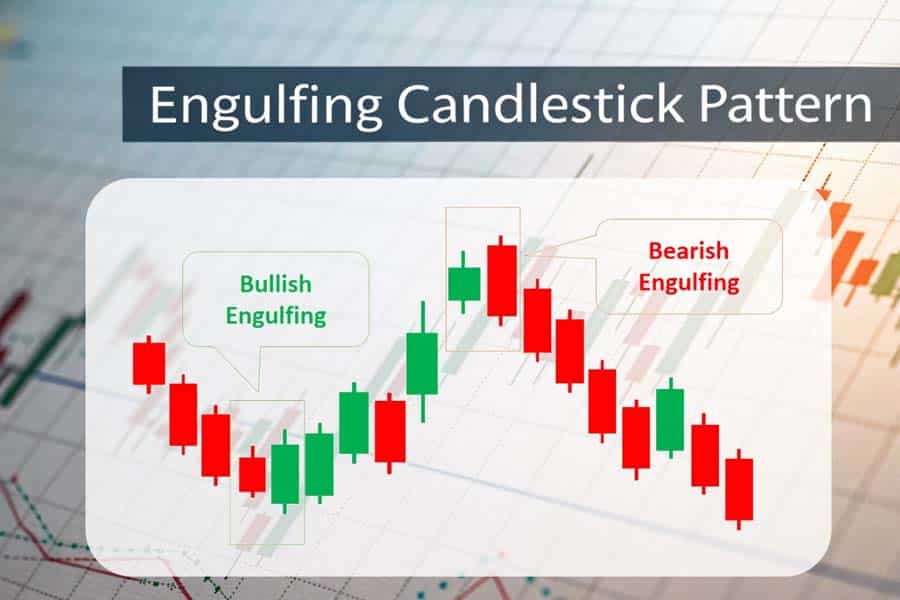
Discover how the Engulfing Candlestick Pattern can signal market reversals and enhance your trading strategy.
How It Works
This pattern carries immense significance because it blends price action with market psychology. When the larger engulfing candle forms, it visually represents a strong reaction to the preceding price movement. This often points to a reversal of the current trend or, in some cases, a continuation after a brief pause.
- In a Bullish Engulfing Pattern, buyers overwhelm the selling pressure, signaling a potential upward reversal.
- In a Bearish Engulfing Pattern, sellers take control, suggesting a possible downtrend.
Why the Pattern Matters
The Engulfing Candlestick Pattern is valued by traders for its ability to provide early signals of trend reversals. Unlike other candlestick formations, this pattern emphasizes decisive action, reflecting the market’s underlying strength or weakness.
- Price Action Insight: The second, larger candle often highlights a shift in sentiment that isn’t immediately visible in other indicators.
- Market Psychology: It showcases the tug-of-war between buyers and sellers, offering a window into prevailing emotions and market sentiment.
Practical Applications
Traders use this pattern to anticipate turning points in the market. By combining it with tools like support and resistance levels, moving averages, or momentum indicators, the reliability of the signal can be enhanced.
For instance:
- If a Bullish Engulfing Pattern forms at a support level, it suggests that buyers are likely to push prices higher.
- A Bearish Engulfing Pattern at a resistance level implies that sellers might drive the price lower.
Pro Tip
To maximize its effectiveness, always evaluate the Engulfing Candlestick Pattern in the context of broader market trends and confirm its validity with additional technical indicators like RSI or MACD.
By combining visual clarity and psychological depth, this pattern empowers traders to make more informed decisions, whether in forex, stocks, or other financial markets.
Key Characteristics of the Engulfing Candlestick Pattern Every Trader Must Know
To effectively utilize the Engulfing Candlestick Pattern in trading, understanding its key features is essential. These characteristics not only define the pattern but also help traders accurately identify it and apply it to their strategies.
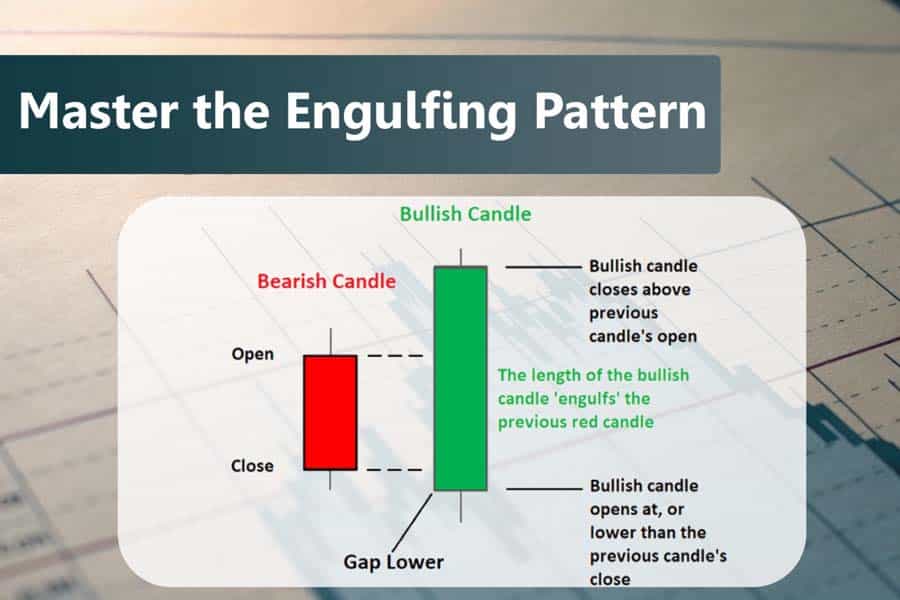
Understand the essential features of the Engulfing Candlestick Pattern to enhance your trading strategy.
1. Two-Candle Formation
The Engulfing Candlestick Pattern always consists of two candlesticks. The first candle is relatively small and represents weaker market sentiment, often characterized by indecision. The second candle is significantly larger, symbolizing a strong shift in momentum.
- Example: In a Bullish Engulfing Pattern, the first candle is bearish, indicating sellers’ dominance, but the larger second candle is bullish, demonstrating that buyers have decisively taken control. Conversely, a Bearish Engulfing Pattern features a smaller bullish candle followed by a larger bearish one.
2. Complete Engulfment
For the pattern to be valid, the body of the second candle must completely engulf the body of the first candle. This means the opening and closing prices of the second candle surpass those of the first. Importantly:
- The shadows or wicks do not need to be engulfed.
- The focus is on the real body of the candles, as it reflects the most critical price action.
This complete engulfment visually confirms the overwhelming strength of buyers (in bullish patterns) or sellers (in bearish patterns).
3. Trend Context
The Engulfing Candlestick Pattern holds the most significance when it appears during a clear and established trend.
- In an uptrend, a Bearish Engulfing Pattern indicates a potential reversal to the downside.
- In a downtrend, a Bullish Engulfing Pattern suggests the possibility of an upward reversal.
Without a preceding trend, this pattern may lose its effectiveness because it lacks the necessary context to signal a reversal or continuation. For instance, if the market is consolidating or moving sideways, the Engulfing Pattern is less reliable as a trading signal.
4. Volume Confirmation
High trading volume during the formation of the engulfing candle enhances the pattern’s reliability. When the engulfing candle appears with a spike in volume, it indicates stronger conviction among buyers or sellers, making the signal more trustworthy.
- Example in Forex: Suppose a Bullish Engulfing Pattern forms on the EUR/USD pair, accompanied by above-average trading volume. This high volume suggests that institutional traders or significant market participants are driving the price, increasing the likelihood of a trend reversal.
Why These Characteristics Matter
Understanding these characteristics ensures that traders don’t misinterpret patterns or act on false signals. Each feature plays a critical role in assessing the strength and reliability of the Engulfing Candlestick Pattern.
Pro Tip
Combine the Engulfing Candlestick Pattern with other technical analysis tools like support and resistance levels, moving averages, or the Relative Strength Index (RSI) for added confirmation. This approach reduces the risk of entering trades based solely on this pattern and increases the probability of success.
By paying attention to the two-candle formation, complete engulfment, trend context, and volume confirmation, traders can make more informed decisions. Mastering these characteristics allows traders to confidently integrate the Engulfing Candlestick Pattern into their strategies, enhancing their ability to predict market reversals and capitalize on profitable opportunities.
Read More: Harami Candlestick Pattern
Types of Engulfing Candlestick Patterns
The Engulfing Candlestick Pattern is a versatile formation in technical analysis and is categorized into two primary types. Each type serves as a powerful signal with unique implications for traders, depending on whether the market is poised for a reversal or continuation.
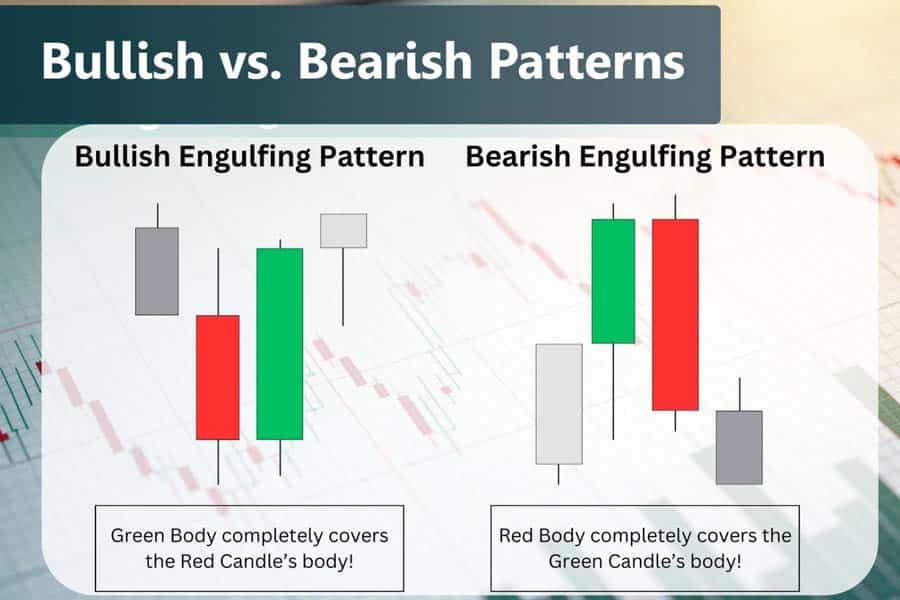
Explore the two main types of Engulfing Patterns and their implications for traders.
1. Bullish Engulfing Pattern
The Bullish Engulfing Pattern typically emerges at the end of a downtrend, signaling a potential reversal to the upside. It features a smaller bearish candle, followed by a larger bullish candle that completely engulfs the body of the first. This pattern is a strong indication of buyers regaining control in the market.
Key Features of a Bullish Engulfing Pattern
- Appears After a Downtrend: This pattern forms after a sustained downward movement, often at critical support levels.
- Strong Buying Pressure: The larger bullish candle demonstrates that buyers have decisively overtaken sellers.
- Increased Volume: Often, a surge in trading volume during the formation of the bullish candle adds credibility to the signal.
How to Trade the Bullish Engulfing Pattern
- Entry Point: Enter a long position after the pattern is confirmed, such as a breakout above the high of the bullish candle.
- Stop-Loss Placement: Place a stop-loss order below the low of the engulfing pattern to minimize risk.
- Profit Targets: Use resistance levels or Fibonacci retracements to identify take-profit zones.
Example in Action
Imagine the EUR/USD currency pair forming a Bullish Engulfing Pattern at a critical support level. Traders observing this may enter a long trade, anticipating a bullish reversal fueled by renewed buying interest.
2. Bearish Engulfing Pattern
The Bearish Engulfing Pattern forms at the peak of an uptrend and suggests an impending bearish reversal. It consists of a smaller bullish candle, followed by a larger bearish candle that fully engulfs the body of the first. This pattern reveals a shift in sentiment, with sellers taking control.
Key Features of a Bearish Engulfing Pattern
- Occurs at the End of an Uptrend: It signals that the upward momentum is losing strength, often at significant resistance levels.
- Increased Selling Pressure: The larger bearish candle demonstrates that sellers are now dominant.
- Volume Spikes: A noticeable increase in volume during the bearish candle’s formation confirms the shift in market sentiment.
How to Trade the Bearish Engulfing Pattern
- Entry Point: Enter a short position after the pattern is validated, typically by a break below the low of the bearish candle.
- Stop-Loss Placement: Place a stop-loss just above the high of the engulfing pattern to limit potential losses.
- Profit Targets: Use Fibonacci extensions or nearby support levels to determine where to exit the trade.
Example in Action
Consider a stock like Apple Inc. (AAPL). If a Bearish Engulfing Pattern forms at a resistance level, traders might short the stock, anticipating a downward trend. This setup is particularly effective when coupled with other indicators like RSI showing overbought conditions.
Read More: Doji Candlestick Pattern
Enhancing Trading Success with Engulfing Patterns
Both Bullish and Bearish Engulfing Patterns are highly reliable when confirmed by additional tools such as:
- Trend Analysis: Ensuring the pattern aligns with the larger market context.
- Support and Resistance: Patterns forming at key levels are more likely to result in successful trades.
- Volume Analysis: Higher volumes during the engulfing candle add validity to the pattern’s implications.
By mastering the nuances of these two types of Engulfing Candlestick Patterns, traders can significantly improve their ability to identify high-probability trade setups. These patterns work across various markets, including forex, stocks, and commodities, making them indispensable tools in a trader’s arsenal.
How to Identify Engulfing Patterns on Charts
Spotting the Engulfing Candlestick Pattern on a chart requires a thorough understanding of market behavior and attention to detail. This pattern is an invaluable tool for traders, but its effectiveness depends on correct identification and interpretation. Below is a step-by-step guide to recognizing and validating this pattern.
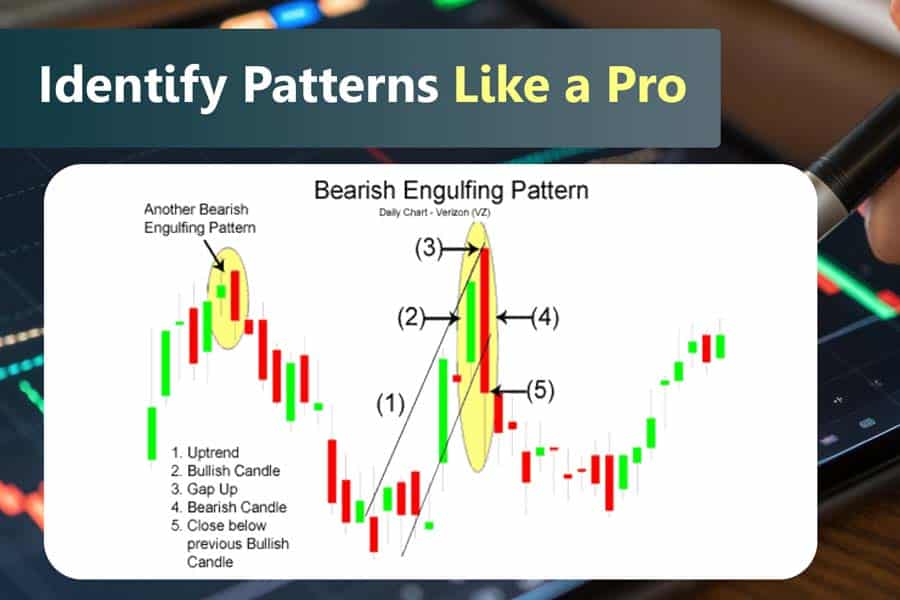
Learn how to effectively identify Engulfing Patterns on your trading charts.
1. Analyze the Trend
One of the most critical steps in identifying an Engulfing Pattern is to ensure that it forms within a clear and established trend.
- Why is Trend Analysis Important?
Engulfing Patterns signal reversals or continuations, but they lose significance in the absence of a defined trend. For instance:- In a downtrend, a Bullish Engulfing Pattern can suggest a potential reversal upward.
- In an uptrend, a Bearish Engulfing Pattern may indicate an impending downward reversal.
- Practical Tip: Use trendlines, moving averages, or indicators like the ADX (Average Directional Index) to confirm the presence and strength of a trend.
2. Look for Complete Engulfment
The hallmark of an Engulfing Pattern is the complete engulfment of the first candle’s body by the second candle.
- Key Observations:
- The body of the second candle (open to close) must entirely cover the body of the first candle.
- The wicks or shadows of the candles can extend beyond the body but are not critical for the pattern.
- Why This Matters:
Complete engulfment signals a decisive shift in momentum, with buyers or sellers taking control of the market. A partially engulfed candle does not offer the same level of reliability.
3. Check Volume
Volume is a crucial factor in validating the reliability of the pattern.
- Higher Volume Adds Weight:
- Increased trading activity during the formation of the second candle signifies stronger conviction among market participants.
- For example, in a Bullish Engulfing Pattern, higher volume indicates aggressive buying, while in a Bearish Engulfing Pattern, it reflects heightened selling pressure.
- Volume Analysis Tools: Use indicators like the Volume Oscillator or On-Balance Volume (OBV) to confirm spikes in trading activity.
4. Validate with Key Levels
The most reliable Engulfing Patterns occur near significant support or resistance levels.
- Support and Resistance in Context:
- A Bullish Engulfing Pattern near a support level suggests that buyers are defending the price, increasing the likelihood of a reversal upward.
- A Bearish Engulfing Pattern near a resistance level indicates that sellers are stepping in, pushing the price downward.
- Additional Confirmation:
Combine the pattern with tools like Fibonacci retracement levels, pivot points, or Bollinger Bands to validate its significance further.
Enhancing Pattern Recognition with Tools and Indicators
Identifying Engulfing Patterns can be made more accurate by leveraging additional tools:
- Candlestick Scanners: Many trading platforms have built-in tools to scan for candlestick patterns, including Engulfing Patterns.
- Indicators for Confirmation: Pair the pattern with oscillators like RSI or MACD to confirm overbought or oversold conditions.
- Multiple Time Frames: Patterns observed on higher time frames (e.g., daily or weekly charts) carry more weight than those on smaller time frames (e.g., 5-minute charts).
By following these steps and using a methodical approach, traders can effectively identify Engulfing Candlestick Patterns and improve their ability to make informed trading decisions. Whether trading forex, stocks, or commodities, understanding the nuances of this pattern is essential for maximizing its potential.
Engulfing Candle Trading Strategies
Trading with the Engulfing Candlestick Pattern can be highly profitable when combined with additional technical tools and strategies. Understanding how to incorporate these patterns with other indicators, perform multi-timeframe analysis, and manage risk can dramatically improve your trading results. Below are three comprehensive strategies to maximize the potential of Engulfing Candlestick Patterns.

Discover effective trading strategies that leverage the power of Engulfing Candlestick Patterns.
1. Combining Engulfing Patterns with Indicators
Using technical indicators alongside the Engulfing Candlestick Pattern can help validate signals and improve accuracy. Here’s how to combine them effectively:
RSI (Relative Strength Index) for Overbought/Oversold Conditions
The RSI is a momentum oscillator that measures the speed and change of price movements, helping traders identify overbought or oversold conditions.
- How to Use RSI with Engulfing Patterns:
- When a Bullish Engulfing Pattern forms and the RSI is below 30 (indicating oversold conditions), it suggests that the market may be ready for an upward reversal.
- Conversely, when a Bearish Engulfing Pattern forms and the RSI is above 70 (indicating overbought conditions), it increases the likelihood of a downtrend.
- Why It Works: By combining these indicators, traders can ensure that the Engulfing Pattern is supported by a significant market condition, increasing the probability of a successful trade.
MACD (Moving Average Convergence Divergence) to Identify Shifts in Momentum
The MACD is a trend-following momentum indicator that shows the relationship between two moving averages of a security’s price. The MACD Histogram highlights momentum shifts.
- How to Use MACD with Engulfing Patterns:
- When a Bullish Engulfing Pattern forms and the MACD line crosses above the signal line, it confirms that bullish momentum is building.
- For a Bearish Engulfing Pattern, a MACD crossover below the signal line suggests growing selling pressure.
- Why It Works: The MACD helps filter out false signals and adds confidence to the reversal or continuation signaled by the Engulfing Pattern.
Bollinger Bands to Spot Patterns Near Volatility Extremes
Bollinger Bands measure market volatility by plotting bands two standard deviations above and below a moving average.
- How to Use Bollinger Bands with Engulfing Patterns:
- A Bullish Engulfing Pattern forming near the lower Bollinger Band suggests that the price is at an extreme low, potentially signaling an oversold market and an upcoming reversal.
- A Bearish Engulfing Pattern at the upper Bollinger Band indicates that the price is reaching overbought conditions, increasing the likelihood of a downward reversal.
- Why It Works: By using Bollinger Bands, traders can spot when the market is near an extreme, adding an extra layer of confirmation for the Engulfing Pattern’s potential.
2. Multi-Timeframe Analysis
Multi-timeframe analysis involves examining the same pattern across different time periods to verify its strength and reliability. This approach ensures that traders are aligning their trades with the broader market trend, increasing the chances of a successful trade.
How to Conduct Multi-Timeframe Analysis with Engulfing Patterns
- Step 1: Identify the Pattern on a Lower Time Frame
Begin by spotting the Engulfing Candlestick Pattern on a smaller timeframe (e.g., the 4-hour or hourly chart). This gives a quicker, more responsive signal. - Step 2: Confirm the Pattern on a Higher Time Frame
After spotting the pattern on the lower timeframe, switch to a larger timeframe (e.g., the daily or weekly chart) to see if a similar pattern or trend is forming. For instance, a Bullish Engulfing Pattern on the 4-hour chart, when confirmed by a similar pattern on the daily chart, strengthens the likelihood of a trend reversal.
Why It Works
- Consistency Across Timeframes: If the same pattern appears on different timeframes, it adds credibility to the signal. A short-term pattern aligns with a long-term trend, confirming that the market is ready for a potential move.
- Better Entry and Exit Points: Multi-timeframe analysis also helps traders refine their entry points and exit strategies, ensuring that they trade in sync with both short-term momentum and long-term trends.
3. Risk Management
Effective risk management is key to success in any trading strategy, and the Engulfing Candlestick Pattern is no exception. Here’s how to manage risk when trading with this pattern:
Place Stop-Loss Orders
- Bullish Engulfing Pattern: When a Bullish Engulfing Pattern forms, place a stop-loss below the low of the engulfing candlestick. This ensures that if the reversal fails and the price moves against you, your losses are minimized.
- Bearish Engulfing Pattern: For a Bearish Engulfing Pattern, set your stop-loss above the high of the engulfing candlestick to protect your position in case the trend reverses unexpectedly.
Set Favorable Risk-Reward Ratios
A risk-reward ratio helps manage potential losses relative to possible profits. For instance, aiming for a 1:2 risk-reward ratio (risking $100 to potentially make $200) is a solid approach. Here’s how to manage it:
- How to Set Profit Targets: Use Fibonacci retracement levels, previous support/resistance levels, or trendline projections to set realistic profit targets that align with the strength of the pattern.
- Why It Works: A favorable risk-reward ratio ensures that even if some trades don’t go as planned, the profitable trades will offset the losses. The Engulfing Candlestick Pattern, when used with proper risk management, has the potential to offer high reward with relatively controlled risk.
By integrating these advanced strategies with your understanding of the Engulfing Candlestick Pattern, you can maximize its effectiveness and improve your overall trading performance. Combining indicators, conducting multi-timeframe analysis, and practicing solid risk management will make you a more strategic and disciplined trader.
Advantages and Limitations of the Engulfing Candlestick Pattern
The Engulfing Candlestick Pattern offers several benefits for traders, but it also has some limitations that need to be considered. Understanding both the advantages and the drawbacks will help traders use this pattern more effectively within their strategies.

Weigh the pros and cons of using the Engulfing Candlestick Pattern in your trading decisions.
Advantages of the Engulfing Candlestick Pattern
- Clear Reversal Signals The Engulfing Candlestick Pattern is particularly useful for identifying major turning points in market trends. Whether it’s a Bullish Engulfing Pattern after a downtrend or a Bearish Engulfing Pattern after an uptrend, this pattern provides a clear indication of a potential trend reversal. It allows traders to make more informed decisions based on price action.
- Wide Applicability One of the key advantages of the Engulfing Pattern is its versatility. It works across various financial instruments, including forex, stocks, and commodities. Whether you are trading major currency pairs, equity stocks, or commodities, this pattern can be applied to any market with a reliable structure.
- Easy to Identify With practice, the Engulfing Candlestick becomes an easy pattern to spot. The simple yet effective nature of the pattern, characterized by a smaller candle followed by a larger one that completely engulfs it, allows traders to recognize it quickly on charts. As a result, this pattern can be applied even by newer traders once they are familiar with candlestick analysis.
Limitations of the Engulfing Candlestick Pattern
While the Engulfing Pattern is powerful, it’s important to be aware of its limitations to avoid potential pitfalls.
- False Signals in Sideways or Choppy Markets In sideways or choppy markets, the Engulfing Candlestick may generate false signals. These markets lack a clear trend direction, making it harder for the pattern to deliver accurate reversal signals. In such environments, the pattern may appear but fail to result in the anticipated price move, leading to potential losses if not properly confirmed.
- Over-Reliance on the Pattern Relying solely on the Engulfing Candlestick Pattern without additional confirmation from other indicators or technical tools can lead to poor trading decisions. Confirmation through volume, trend indicators, or multi-timeframe analysis is essential to avoid being misled by the pattern in isolation. Over-relying on any single candlestick pattern, including the Engulfing Pattern, can reduce the effectiveness of your trading strategy.
By balancing the advantages with awareness of its limitations, traders can use the Engulfing Candlestick Pattern more effectively, incorporating it into a robust trading strategy with additional tools and confirmations. This helps in maximizing potential profits while minimizing risks.
Why Choose Opofinance for Engulfing Pattern Trading?
Trading with a regulated broker like Opofinance ensures a seamless experience for traders leveraging engulfing candlestick patterns.

- ASIC Regulation: Trade confidently with a broker that adheres to strict regulatory standards.
- Advanced Charting Tools: Spot patterns with precision using state-of-the-art platforms like MT5.
- Social Trading Service: Learn from successful traders by replicating their strategies.
- Secure Transactions: Enjoy hassle-free deposits and withdrawals through safe methods.
Opofinance empowers traders to maximize the potential of bullish engulfing and bearish engulfing patterns by providing advanced tools and unparalleled support.
Conclusion: Mastering the Engulfing Candlestick Pattern for Smarter Trading
The Engulfing Candlestick Pattern is a powerful tool in a trader’s technical analysis toolkit, providing clear signals of potential trend reversals. Whether it’s the Bullish Engulfing Pattern signaling a shift to upward momentum or the Bearish Engulfing Pattern indicating a move toward bearish conditions, this two-candle formation offers valuable insights into market sentiment and price action.
Advantages of the pattern, such as its ability to identify trend reversals, wide applicability across various markets (forex, stocks, commodities), and ease of identification, make it a highly reliable tool for traders at all experience levels. However, it is important to understand its limitations, including the potential for false signals in sideways markets and the risks of over-reliance on the pattern without proper confirmation.
To maximize the effectiveness of the Engulfing Candlestick Pattern, it is crucial to combine it with other technical indicators and confirmation methods, such as volume analysis, RSI, MACD, or multi-timeframe analysis. Proper risk management practices, including the use of stop-loss orders and favorable risk-reward ratios, are also essential for ensuring success in trading.
By incorporating the Engulfing Candlestick Pattern into a well-rounded trading strategy and recognizing when to use it and when to exercise caution, traders can significantly improve their chances of identifying profitable trades while managing risk effectively. Mastering this pattern, along with understanding its role in broader market conditions, can give traders a distinct edge in both trending and consolidating markets.
How reliable is the Engulfing Candlestick Pattern for predicting market trends?
The Engulfing Candlestick Pattern is considered one of the most reliable reversal signals in technical analysis. Its effectiveness increases when combined with additional indicators like RSI or MACD for momentum confirmation, and when it forms near key support or resistance levels. However, its reliability can decrease in volatile or choppy markets, so it is essential to use it in conjunction with other analysis techniques to confirm its validity.
Can Engulfing Patterns be used in all markets?
Yes, the Engulfing Candlestick Pattern can be used across a variety of financial markets, including forex, stocks, and commodities. Its ability to signal reversals in trends makes it a versatile tool for traders in multiple asset classes. However, the effectiveness of the pattern may vary depending on the market’s overall volatility and trend structure, so market context should always be considered when trading.
How do timeframes affect the Engulfing Candlestick Pattern?
The timeframe on which the Engulfing Candlestick Pattern is identified plays a critical role in its significance. Patterns that form on higher timeframes, such as the daily or weekly charts, tend to be more reliable because they reflect more significant market shifts. Conversely, patterns on lower timeframes may be less reliable and could lead to more frequent false signals. Traders often look for confirmation from patterns on multiple timeframes to strengthen their trading decisions.


