

Ever spotted a sudden jump or drop on a price chart and wondered what it meant? These ‘gaps’ can be confusing, sometimes signaling a trend is ending, other times suggesting it’s just getting started. Mistaking one for the other can lead to tricky trading situations. The core challenge often lies in understanding the exhaustion gap vs runaway gap difference – one hints at a reversal, the other at continuation. Getting this right is crucial for traders aiming to time their entries and exits effectively, whether analyzing stocks or navigating the forex market with an online forex broker. This article breaks down exactly how to tell these two important gap types apart, helping you read market sentiment more clearly.
Intro to Price Gaps in Technical Analysis
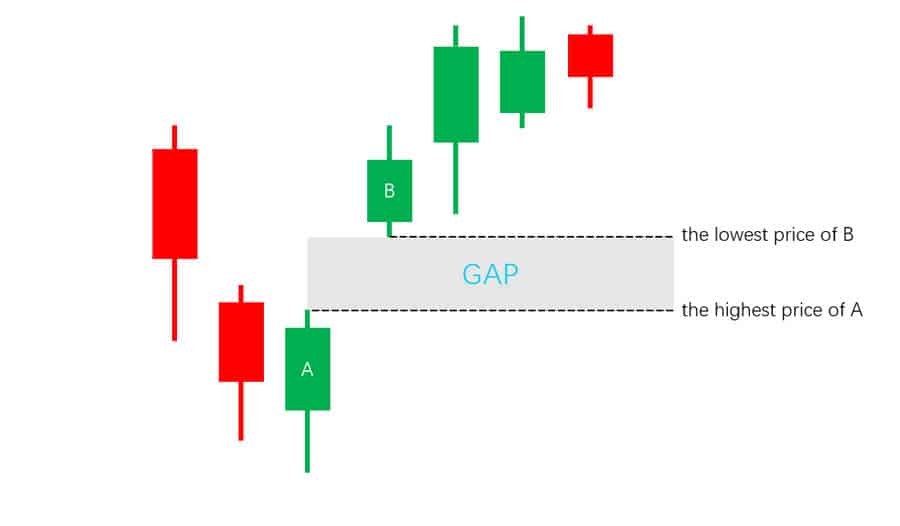
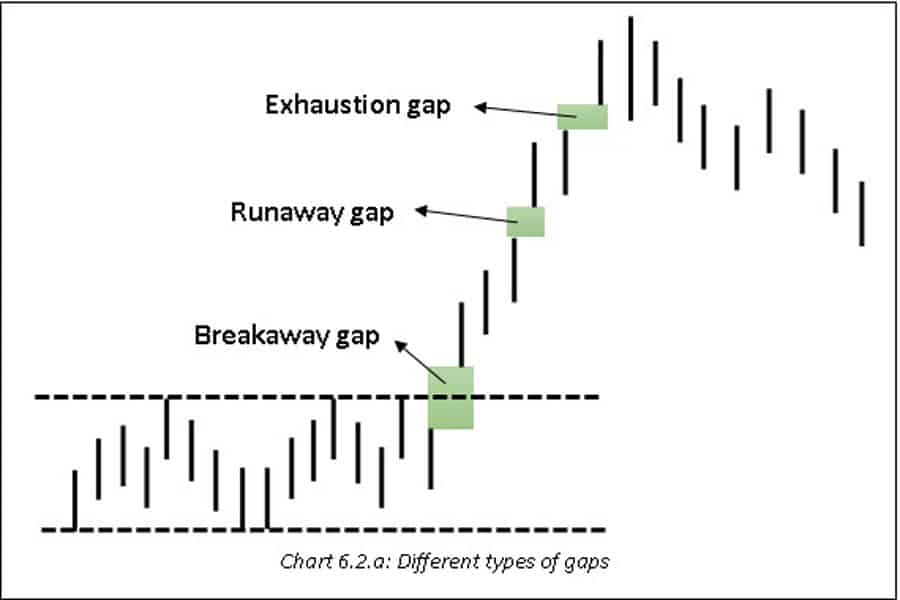
Think of a price gap as a literal void on a trading chart – an area where no trades occurred between the closing price of one session (like a day) and the opening price of the next. They often happen due to significant news or events occurring while the market is closed (like overnight earnings for stocks, or weekend developments impacting forex).
This creates an imbalance between buyers and sellers right at the opening bell, causing the price to jump. Why should traders pay close attention? Because these gaps graphically represent a strong, sudden shift in market psychology or perceived value. They signal urgency and conviction. While several gap types exist, we’re focusing on comparing two that often look similar initially but have opposite implications: the exhaustion gap vs runaway gap.
Read More: exhaustion gap vs breakaway gap
Understanding the Exhaustion Gap
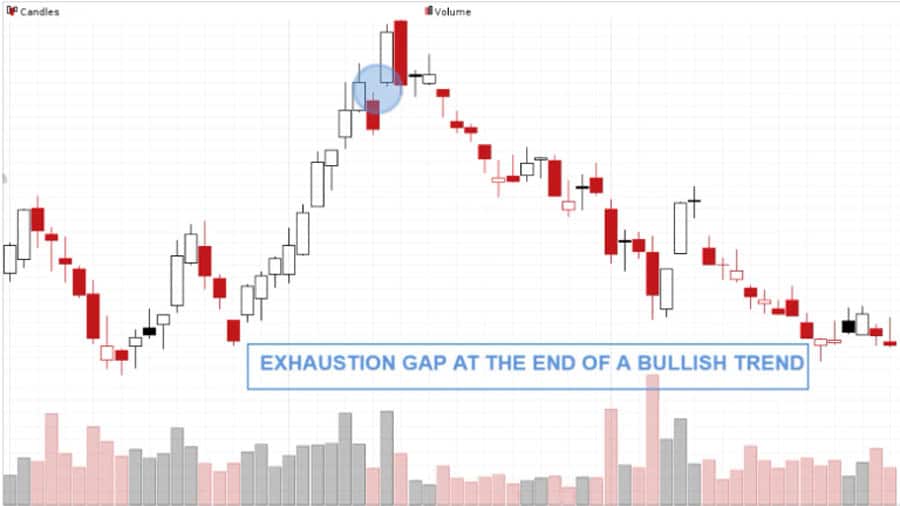
The exhaustion gap is like the final, dramatic surge before a trend runs out of energy. It typically appears late in a well-established, often lengthy, trend and serves as a warning sign that the dominant buying or selling pressure is nearing its limit, suggesting a potential trend reversal is on the horizon.
What Defines an Exhaustion Gap?
It’s a price gap that forms near the apparent peak of a strong uptrend or the trough of a deep downtrend. It marks a climax point – often representing the last wave of enthusiastic buyers jumping in near the top, or the final panicked sellers giving up near the bottom. This final burst often signifies that the driving force behind the trend is spent.
Context: End of a Trend
You won’t typically find these early in a move. Exhaustion gaps emerge after the price has already traveled a considerable distance, often rapidly. The trend itself usually looks mature, perhaps even vertical or parabolic on the chart, suggesting it might be unsustainable. It signals the ‘exhaust’ fumes of the trend.
Signal: Trend Reversal Warning
The core message conveyed by an exhaustion gap is one of fatigue. The market forces that propelled the price relentlessly are becoming depleted. The gap signifies that the last group of participants driving the trend (late buyers in an uptrend, capitulating sellers in a downtrend) has likely entered, leaving fewer people to push the price further in that direction. This imbalance makes a reversal more probable.
Key Exhaustion Gap Characteristics
- Timing: Occurs after a prolonged or particularly steep price advance or decline.
- Volume: This is a critical identifier. Exhaustion gaps almost always occur on exceptionally high, climactic trading volume – think significantly higher than the average volume seen during the preceding trend. This volume spike reflects the intense, often emotional, final push or capitulation.
- Filling the Gap: A key characteristic is that exhaustion gaps tend to be “filled” relatively quickly, often within days or a few weeks. This means the price reverses and trades back through the entire price range of the gap. The rapid filling happens because the force behind the gap was unsustainable, and profit-taking or counter-trend pressure quickly sets in. The filling acts as strong confirmation of the exhaustion.
The Psychology Behind Exhaustion Gaps
What drives this pattern? In a peaking uptrend, it’s often a combination of FOMO (Fear Of Missing Out) pulling in the last retail buyers, and short-sellers being forced to cover their positions at maximum pain. In a bottoming downtrend, it represents the peak of despair, where the last remaining weak holders finally throw in the towel and sell. This final, intense wave of activity effectively exhausts the available buying (at the top) or selling (at the bottom) pressure, clearing the way for the opposing market forces to take control and initiate a reversal.
Understanding the Runaway Gap (Continuation)
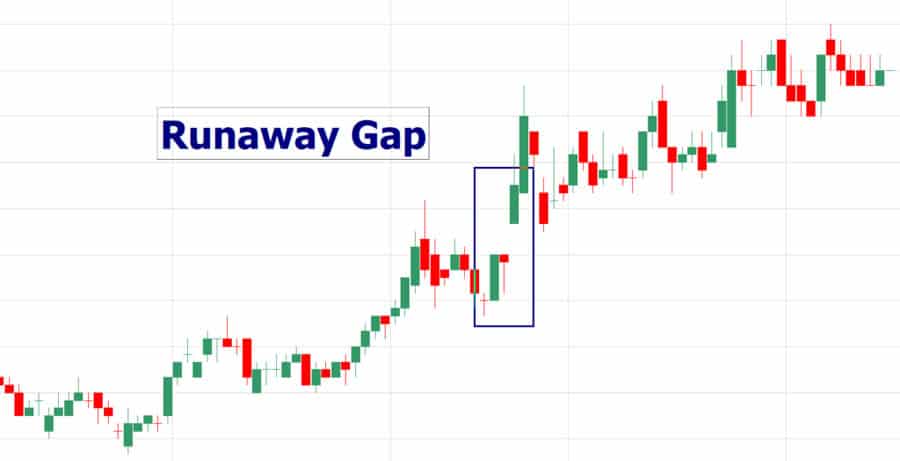
Often referred to as a continuation gap or measuring gap, the runaway gap paints a picture of trend strength and conviction. Unlike its exhaustion counterpart, it signals that an existing, healthy trend remains firmly in place and is likely to continue its course. It’s a sign of confidence, not fatigue.
What Defines a Runaway Gap?
A runaway gap is a price gap that occurs squarely within an already established, progressing trend. It doesn’t mark a beginning or an end, but rather signifies a boost of momentum or renewed interest pushing the existing trend forward. Think of it as the market taking a quick breath before continuing its run.
Context: Middle of a Trend
These gaps typically form roughly halfway through a significant price move. They often appear after the trend has paused or consolidated briefly, suggesting that traders used the pause to reinforce their belief in the trend’s direction before pushing prices decisively further. It confirms the trend is alive and well.
Signal: Trend Continuation
The unmistakable message of a runaway gap is that the prevailing trend is robust and has further potential. It might be triggered by confirming news or simply strong technical momentum attracting more participants in the direction the market was already headed. It shows traders are confidently adding to or initiating positions aligned with the trend.
Key Runaway Gap Characteristics
- Timing: Appears during a strong, ongoing uptrend or downtrend, often breaking out from a minor consolidation within that trend.
- Volume: Volume should be solid and typically above average, confirming genuine participation and conviction behind the move. Critically, it usually lacks the extreme, frantic spike associated with exhaustion gaps. Solid, confirming volume supports the continuation idea, whereas climactic volume suggests an end.
- Filling the Gap: Runaway gaps often remain unfilled for a considerable period, sometimes indefinitely. The price range of the gap frequently transforms into a significant support level (in an uptrend) or resistance level (in a downtrend) on subsequent price pullbacks. The fact that the market respects the gap area reinforces its validity as a sign of trend strength.
The Psychology Behind Runaway Gaps
Runaway gaps reflect strong consensus and confidence among traders aligned with the prevailing trend. In an uptrend, it might be driven by participants realizing the trend is stronger than anticipated or reacting to positive confirmation. In a downtrend, it reflects sellers aggressively pushing prices lower after overcoming a temporary support level. It demonstrates that the dominant market force (buyers in an uptrend, sellers in a downtrend) is still firmly in control and attracting further participation. Recognizing this conviction is central to understanding the exhaustion gap vs runaway gap distinction.
Exhaustion Gap vs Runaway Gap: Key Differences
Clearly distinguishing between these two gap types is fundamental for effective technical trading. One signals “prepare for change,” while the other signals “stay the course.” Misinterpreting them can lead to entering trades precisely at the wrong time. The exhaustion gap vs runaway gap comparison boils down to recognizing clues for reversal versus confirmation of continuation.
| Feature | Exhaustion Gap | Runaway Gap (Continuation Gap) |
| Trend Implication | Signals potential Trend Reversal | Signals likely Trend Continuation |
| Location within Trend | Near the End of an extended trend | Around the Middle of an established trend |
| Volume Signature | Very High / Climactic volume spike (frenzy) | Moderate to High / Confirming volume (conviction) |
| Likelihood of Being Filled | High likelihood; often filled relatively quickly | Low likelihood soon; often becomes Support/Resistance |
| Psychological Driver | Climax of FOMO/Panic; Trend Fatigue | Renewed Conviction; Trend Strength Confirmation |
For a trader, the practical difference is stark: recognizing an exhaustion gap might prompt considering an exit or a counter-trend position, while identifying a runaway gap might encourage joining the trend or holding an existing position. Mastering the exhaustion gap vs runaway gap analysis helps align strategies with likely market direction.
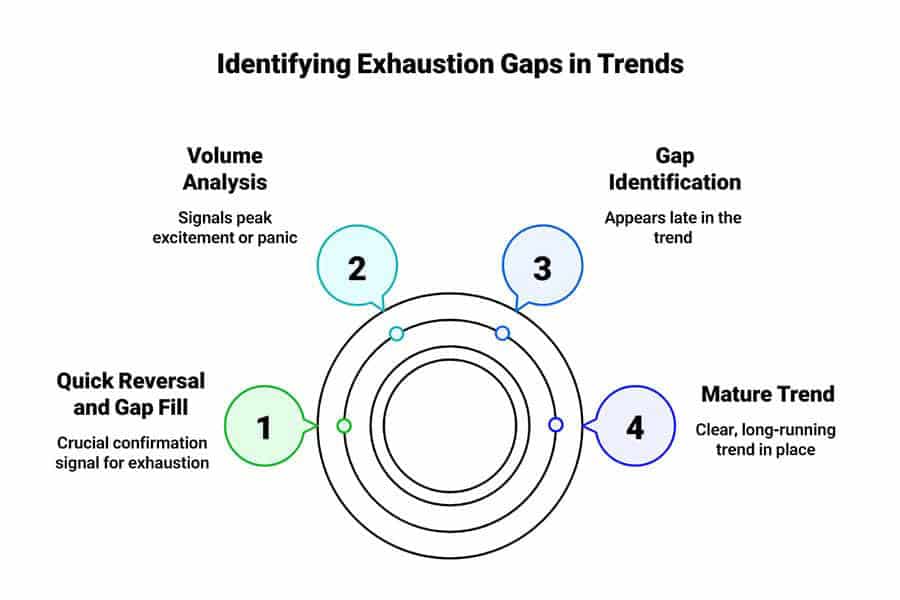
How to Identify Exhaustion Gaps
Pinpointing an exhaustion gap involves more than just seeing the gap; it requires examining the preceding price action and, crucially, the accompanying volume to understand the context.
Visual Cues on the Chart
Look for a gap that forms after a long, often steep, price ascent or descent. The trend leading into the gap should appear mature, possibly showing signs of acceleration (a parabolic curve) which often precedes exhaustion. The gap itself might seem unusually large compared to earlier gaps in the same trend.
Volume Analysis is Crucial
This is arguably the most vital piece of evidence. An exhaustion gap should coincide with an extraordinary spike in trading volume – significantly higher than the recent average and often the highest volume seen during the entire trend. This “blow-off” volume signifies that final, intense wave of participation, characteristic of a climax.
Confirmation Signals Post-Gap
Because entering a reversal trade too early is risky, waiting for confirmation after the gap is wise. Look for these signs:
- The price fails to make significant further progress in the direction of the gap on the days immediately following. It might stall or even reverse slightly.
- The price starts to retreat back into the gap’s price range within a few trading sessions. This “filling” action suggests the initial force behind the gap lacked staying power.
- The formation of specific reversal candlestick patterns (like a large bearish engulfing candle after a gap up, or a bullish piercing pattern after a gap down) near the gap level provides further evidence.
Patience is key; let the market show signs that the exhaustion is real before acting.
Read More: Doji Candlestick Pattern
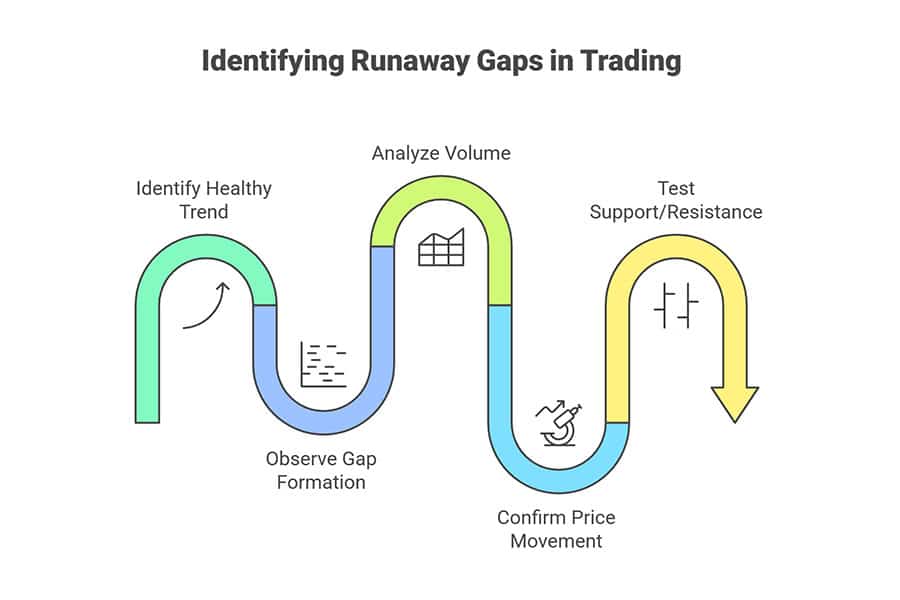
How to Identify Runaway Gaps
Identifying a runaway gap means confirming that the gap represents renewed energy within an ongoing trend, rather than a final spurt before reversal. Context and volume remain key differentiators.
Visual Cues on the Chart
Look for a gap that occurs within a clearly identifiable, healthy trend that still seems to possess underlying strength. Importantly, ensure the trend was well-established before the gap occurred. These gaps often appear after a brief pause or consolidation period (like a flag or pennant pattern) within the larger trend, suggesting a breakout continuation.
Volume Analysis Confirmation
Runaway gaps should occur on increased volume, generally above the recent average, indicating genuine interest and commitment from traders pushing the trend forward. However, this volume is typically just strong and confirming, lacking the extreme, almost panicked spike characteristic of exhaustion gaps. Solid, decisive volume is the hallmark here.
Confirmation Signals Post-Gap
Subsequent price action provides the confirmation:
- The price continues to move decisively in the direction of the gap and the prevailing trend in the sessions that follow.
- If the price experiences a minor pullback later, the gap area (specifically, the edge closer to the prior price action) successfully acts as support (in an uptrend) or resistance (in a downtrend), preventing the gap from being easily filled. This resilience confirms the gap’s significance.
Accurately judging the trend’s maturity and correctly interpreting the volume signature are essential skills in the exhaustion gap vs runaway gap evaluation.
Trading Implications and Strategies
Correctly identifying an exhaustion gap vs runaway gap has direct consequences for strategy selection, as they imply opposite future price movements.
Read More:forex gap trading strategy
Trading Exhaustion Gaps
Exhaustion gaps signal that the established trend might be ending, potentially offering opportunities to trade in the opposite direction (counter-trend).
Entry Considerations
Acting solely on the gap’s appearance is premature. Waiting for confirmation reduces risk. Consider entering:
- When the price clearly starts moving back into the gap area (beginning the “fill”).
- On a decisive break of a key level formed on the gap day, such as the low of the day after a gap up, or the high of the day after a gap down.
- After a recognized reversal candlestick pattern forms immediately following the gap, confirming the shift in sentiment.
Stop-Loss Placement
Protect your capital with a logical stop-loss. If anticipating a reversal down after an exhaustion gap up, place the stop slightly above the highest price reached during or just after the gap formation. If expecting a reversal up after an exhaustion gap down, place it slightly below the lowest price reached.
Profit Targets
The first logical target is often the complete filling of the gap. Beyond that, look for previous significant support levels (if shorting the reversal) or resistance levels (if buying the reversal) as potential subsequent targets.
Trading Runaway Gaps
Runaway gaps signal trend strength, suggesting opportunities to enter in the direction of the existing trend or add to current positions.
Entry Considerations
Since these gaps confirm ongoing momentum, entries are aligned with the trend:
- Enter relatively soon after the gap as the price continues to show strength in the gap’s direction (a momentum entry).
- A potentially lower-risk approach is to wait for the first pullback towards the gap area. If the gap level holds as support (in an uptrend) or resistance (in a downtrend), enter the trade there, benefiting from a clearer risk definition point.
Stop-Loss Placement
If entering an uptrend after a runaway gap, a common stop-loss placement is just below the lower boundary of the gap zone. For a downtrend runaway gap, place it just above the upper boundary. This strategy assumes the gap zone will indeed provide the expected support or resistance.
Profit Targets
Utilize trend-following methods. This could involve using a trailing stop-loss to capture as much of the continuing move as possible, or setting profit targets based on measured move projections derived from the size of the pattern preceding the gap.
Remember, no gap signal is guaranteed. Always incorporate confirmation signals and solid risk management when formulating a trade plan based on an exhaustion gap vs runaway gap scenario.
Potential Pitfalls and Considerations
While analyzing gaps can provide powerful insights, it’s crucial to be aware of potential challenges and integrate these signals within a comprehensive trading approach.
Misidentification Risks
The most common error is confusing one gap type for another, particularly the exhaustion gap vs runaway gap. An exhaustion gap can initially mimic the strength of a breakout, while a runaway gap might seem like a potential reversal if viewed without considering the broader trend context and volume. Diligent analysis of trend maturity and volume characteristics is essential to minimize this risk.
The Importance of Confluence
Gap signals become significantly more reliable when confirmed by other forms of technical analysis – this is known as confluence. For example, does an exhaustion gap occur at a major resistance level with bearish divergence on the RSI? Does a runaway gap break above a key moving average with strong momentum readings? Seeking multiple, non-correlated signals pointing in the same direction increases the probability of a successful trade compared to relying solely on the gap itself.
False Signals and Risk Management
Markets are inherently unpredictable, and false signals occur. A pattern might look like a perfect exhaustion gap, yet the price continues to rally, or a convincing runaway gap might unexpectedly get filled, trapping trend-followers. This underscores the absolute necessity of robust risk management. Always define your exit point (stop-loss) before entering a trade and use position sizing that ensures no single trade can significantly damage your capital.
Gaps Across Different Asset Classes
The fundamental principles behind the exhaustion gap vs runaway gap apply across various markets, including stocks, forex, commodities, and cryptocurrencies. However, their frequency and typical behavior might vary. For instance, individual stocks often gap due to company-specific news released overnight. Forex pairs trade continuously during the week but can experience significant gaps between Friday’s close and Sunday’s open due to weekend events. Understanding these market-specific nuances is beneficial.
Opofinance Services: Enhance Your Trading
Making informed decisions based on technical analysis, like differentiating the exhaustion gap vs runaway gap, is easier with a capable broker. Opofinance, regulated by ASIC, provides a comprehensive trading environment equipped for modern market participants:
- Advanced Trading Platforms: Access a selection of powerful platforms including the widely-used MetaTrader 4 (MT4) and MetaTrader 5 (MT5), the depth-of-market focused cTrader, and the intuitive, user-friendly OpoTrade platform.
- Innovative AI Tools: Leverage artificial intelligence for sharper insights with the AI Market Analyzer, receive personalized trading feedback via the AI Coach, and get prompt assistance through AI Support.
- Social & Proprietary Trading: Explore different trading avenues by connecting with experienced traders through social trading features or investigating opportunities offered via proprietary trading programs.
- Secure & Flexible Transactions: Experience hassle-free funding and withdrawals with secure processes. Opofinance supports various convenient methods, including popular cryptocurrency options, and notably, does not charge deposit or withdrawal fees from their side.

Consider Opofinance for access to cutting-edge tools, reliable execution, and a supportive trading infrastructure.
Conclusion
Distinguishing between an exhaustion gap vs runaway gap is a critical skill for navigating market trends effectively. While both appear as price voids on a chart, their implications are diametrically opposed. Exhaustion gaps, characterized by climactic volume late in a trend, signal potential reversals and trend fatigue. Runaway gaps, occurring mid-trend on solid, confirming volume, indicate trend strength and suggest continuation. By carefully analyzing the gap’s position within the trend, its volume signature, and the subsequent price action, traders can significantly improve their market interpretation.
Remember to seek confluence with other indicators and always prioritize risk management, as no single pattern guarantees future price movement. Mastering the exhaustion gap vs runaway gap analysis equips you to better anticipate potential turning points and sustained moves.
Key Takeaways
- Price Gaps: Chart areas without trades, indicating significant shifts in supply/demand balance.
- Exhaustion Gap: Appears late in a trend, high/climactic volume, signals potential REVERSAL, usually filled quickly.
- Runaway Gap (Continuation Gap): Occurs mid-trend, moderate/high confirming volume, signals trend CONTINUATION, often acts as support/resistance, typically not filled quickly.
- Core Difference (Exhaustion Gap vs Runaway Gap): The key message is Reversal Warning vs. Continuation Confirmation.
- Identification Factors: Trend maturity (end vs. middle), volume character (climactic vs. confirming), post-gap price behavior (fills vs. holds).
- Trading Strategy: Exhaustion gaps may warrant counter-trend setups (with confirmation); Runaway gaps favor trend-following entries.
- Essential Reminder: Always use contextual analysis, look for confirming signals (confluence), and employ strict risk management.
Can exhaustion and runaway gaps occur on any timeframe?
Yes, these gap patterns can technically manifest on any chart timeframe, from very short-term charts (like 1-minute or 5-minute) used by day traders, up to daily, weekly, or even monthly charts used by longer-term investors. However, gaps identified on higher timeframes (daily and above) are generally accorded more weight and significance, as they reflect the collective actions and sentiment of a broader range of market participants over a more substantial period.
What technical indicators best help confirm these gap signals?
Volume analysis is arguably the most crucial element for differentiating between exhaustion and runaway gaps. Beyond volume, momentum oscillators like the Relative Strength Index (RSI) or the Stochastic Oscillator can provide valuable confirming evidence. For example, observing bearish divergence (price makes a higher high on an exhaustion gap up, but the RSI makes a lower high) can strengthen the reversal case. Conversely, a strong RSI reading moving in sync with the price action during a runaway gap reinforces the continuation signal. Trend-defining tools like moving averages also help establish the necessary trend context.
How does a Runaway Gap differ from a Breakaway Gap?
Both runaway and breakaway gaps signal that the price is likely to continue in the direction of the gap, but their position within the overall trend structure is different. A Breakaway Gap occurs at the beginning of a new trend, often marking the exit from a significant consolidation pattern (like a trading range, triangle, or base) or breaking a major support/resistance level. It signals the initiation of a substantial move. A Runaway Gap, on the other hand, occurs after a trend is already clearly established, typically appearing somewhere around the midpoint of the move. It signifies that the existing trend remains strong and has further to go. Both indicate continuation, but Breakaway starts the trend, while Runaway confirms its ongoing health.


