

Exhaustion volume is a sudden, sharp increase in trading volume that signals the potential end of a prevailing trend. It suggests that the driving force behind a price move—either buying or selling pressure—has peaked and is losing momentum. This guide will explore how traders can interpret these powerful signals to anticipate reversals, manage risk, and improve their trading outcomes. Whether you’re a seasoned trader or just starting with an online forex broker, understanding volume exhaustion can provide a significant edge. We will cover everything from identifying core exhaustion patterns and trading exhaustion gaps to implementing actionable strategies and leveraging advanced indicators.
Key Takeaways
- What is Exhaustion Volume? It’s a significant spike in trading activity that often precedes a trend reversal, indicating that the last of the buyers or sellers have entered the market.
- How to Identify It: Look for a dramatic increase in volume on your charts, especially after a prolonged price trend, often accompanied by a stalling or reversing price.
- Core Signal: The primary signal is a volume spike reversal, where a peak in volume marks the peak or trough of a price move.
- Exhaustion Gaps: These are price gaps that occur at the end of a trend on high volume, signaling a final, desperate push before the market reverses.
- Actionable Strategy: A common exhaustion volume trading strategy involves waiting for the price to confirm the reversal after a volume spike before entering a trade in the opposite direction.
- Key Tools: Utilize volume exhaustion indicators and volume profile analysis to confirm signals and gain deeper market insight.
What Is Exhaustion Volume?
Before diving into complex strategies, it’s crucial to understand the foundation of this concept. Exhaustion volume is more than just a random spike on your volume indicator; it’s a narrative about market sentiment reaching a fever pitch. It tells a story of finality—a last gasp of energy before the market changes direction. For traders, this story provides a powerful clue about where the price might be headed next.
Exhaustion Volume Definition
At its core, exhaustion volume is a climactic event. Imagine a trend that has been running for days or even weeks. As the trend matures, more and more traders jump on board. At some point, the enthusiasm reaches a peak. This is when a massive number of transactions occur in a relatively short period. This surge is the exhaustion volume. It signifies that almost everyone willing to buy (in an uptrend) or sell (in a a downtrend) has already done so. With no one left to push the price further, the trend loses its fuel and becomes vulnerable to a reversal.
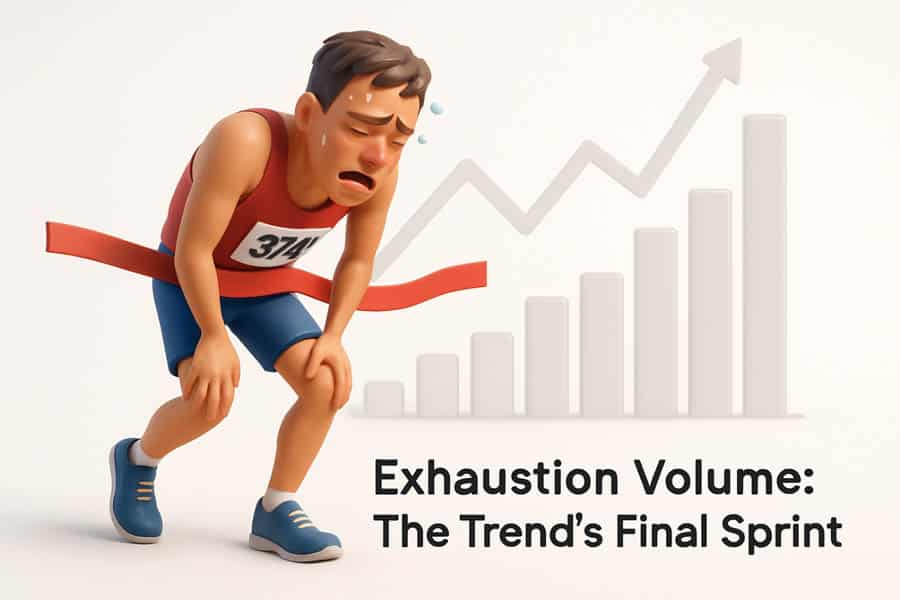
This phenomenon is often called volume exhaustion because the energy driving the trend has literally been exhausted. Think of it like the final sprint in a marathon. The runner gives it their all in a last burst of speed, but immediately afterward, they are spent and must slow down or stop. Similarly, the market makes a final, powerful move on high volume before running out of steam.
Difference Between Exhaustion and Regular Volume
Not all high volume is exhaustion volume. It’s the context that matters. Regular high volume can occur during a healthy, continuing trend. For instance, a strong uptrend will naturally have higher volume on up days than on down days. This is called confirmation volume, as it confirms the strength of the trend.
Exhaustion volume, however, is different in several ways:
- Timing: It appears at the end of a sustained trend, not in the middle of it.
- Magnitude: It is often a dramatic, anomalous spike that stands out significantly from the preceding volume bars. It’s not just high; it’s climactic.
- Price Action Correlation: During an exhaustion event, the price might make a final, sharp move in the direction of the trend but then stalls or quickly reverses. In contrast, regular high volume typically accompanies a price that continues to move confidently in the trend’s direction.
A key mistake many novice traders make is seeing any large volume bar as a sign of strength. Without the context of a prolonged trend and the subsequent price behavior, a volume spike can be misleading. It is the combination of the spike and the price’s failure to continue that creates the powerful exhaustion volume signal.
Read More: 5 Steps to Master Volume Spread Analysis (VSA)
Why Is Exhaustion Volume Important?
Understanding exhaustion volume is critical for several reasons. First and foremost, it’s a leading indicator of a potential trend reversal. While many technical indicators are lagging, meaning they confirm a move that has already happened, exhaustion volume can give you a heads-up that a change is imminent. This allows you to prepare for a potential exit from a current position or an entry into a new one.
Second, it helps traders avoid entering a trade too late. We’ve all felt the fear of missing out (FOMO) when a stock or currency pair is soaring. The temptation is to jump in before it goes even higher. However, if this surge is occurring on exhaustion volume, that “great entry” could actually be the worst possible moment to buy, right at the market top.
Finally, identifying volume exhaustion can significantly improve risk management. By recognizing the signs that a trend is ending, you can tighten your stop-losses on existing trades to protect your profits. For those looking to enter a counter-trend trade, waiting for the confirmation of an exhaustion signal can provide a more calculated entry point with a clearer place to set a stop-loss (e.g., just above the exhaustion high or below the exhaustion low).
In essence, exhaustion volume provides a window into the collective psychology of the market. It reveals the moment when conviction turns into desperation, and that is often the moment of maximum opportunity for the prepared trader.
Core Exhaustion Volume Signals
To effectively trade using exhaustion volume, you must be able to recognize its key signatures on a chart. These signals are the footprints left by the market as it approaches a turning point. While a single signal can be a clue, the real power comes from seeing several of these patterns converge, painting a clear picture of market exhaustion. Here’s a breakdown of the most important signals to watch for.
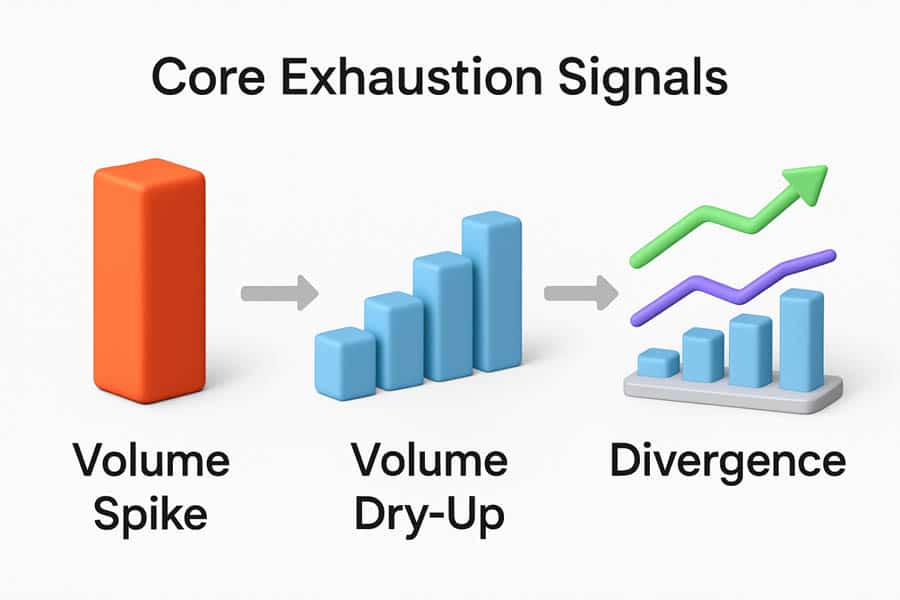
Volume Spike After Sustained Trend
This is the most classic and recognizable sign of exhaustion volume. After a long, steady uptrend or downtrend, you suddenly see a volume bar that towers over all the recent ones. This isn’t a small increase; it’s a massive surge in trading activity. This spike represents the final, frantic rush of participants. In an uptrend, it’s the latecomers buying in a frenzy, and smart money selling to them. In a downtrend, it’s the panicked sellers capitulating and dumping their positions, which are then absorbed by institutional buyers.
The key here is the “sustained trend” part of the equation. A volume spike in a sideways, ranging market doesn’t mean much. It’s the spike that occurs after a prolonged move that carries the weight of a potential reversal. This is the market’s grand finale before the curtains fall on the current trend.
Volume Drop-Off → Potential Market Turning Point
What happens after the climax? A sudden quiet. Following a massive exhaustion volume spike, it’s common to see a sharp decrease in volume. This is often referred to as “volume dry-up.” This drop-off is just as important as the spike itself. It signals that the intense buying or selling pressure has vanished. The participants who drove the exhaustion spike are now out of the market, and there’s no new wave of buyers or sellers to take their place.
This sudden lack of interest is a strong indication that the trend is over. The market is taking a breath, and this pause often precedes a move in the opposite direction. A reversal on low volume following an exhaustion spike is a very powerful combination. It shows that there is little resistance to the new direction. The old trend ended with a bang (the spike), and the new trend begins with a whimper (the volume dry-up), which can be the start of a sustained move.
Divergence Between Price Movement and Volume
Divergence is a powerful concept in technical analysis, and it applies perfectly to exhaustion volume. Volume divergence occurs when the price and volume start telling two different stories. For example, in an uptrend, the price might push to a new high, but the volume on that move is significantly lower than the volume on the previous high. This is a bearish divergence.
It suggests that conviction is waning. Even though the price is still inching up, the lack of volume shows that there isn’t enough buying power to sustain the move. This is a subtle form of exhaustion. The trend is running on fumes. This divergence is a warning sign that the trend is weak and could reverse soon. The final push to a new high on weak volume is often a trap for unsuspecting buyers, and it can be a precursor to a sharp sell-off.
Climax Volume and Volume Dry-Up Patterns
Climax volume is another term for an exhaustion volume spike at the top (a buying climax) or bottom (a selling climax) of a trend. The pattern typically unfolds in a few stages:
- The Climax: A huge volume spike occurs as the price makes a final, sharp move.
- The Stall or Reversal: The price stops advancing or immediately reverses. The candle associated with the climax volume often has a long wick, showing that the initial move was rejected.
- The Confirmation (Volume Dry-Up): In the candles that follow, the volume dries up significantly. The price may then start to drift in the opposite direction on this low volume, confirming that the previous trend’s participants have left the building.
Recognizing this complete pattern—from climax to dry-up—provides a much higher probability trading setup than acting on the spike alone. It’s a narrative that plays out on the chart: the chaotic climax, the immediate aftermath of uncertainty, and the quiet beginning of a new direction. This is a cornerstone of exhaustion volume trading.
How to Identify Exhaustion Volume on Trading Charts
Knowing the theory is one thing, but spotting exhaustion volume in real-time on a live chart is the skill that makes a difference. It requires a trained eye and a systematic approach. With practice, these patterns will start to jump out at you. Here’s a step-by-step guide to help you identify exhaustion volume like a pro.
Step-by-Step Walkthrough (Case Study/Chart Examples)
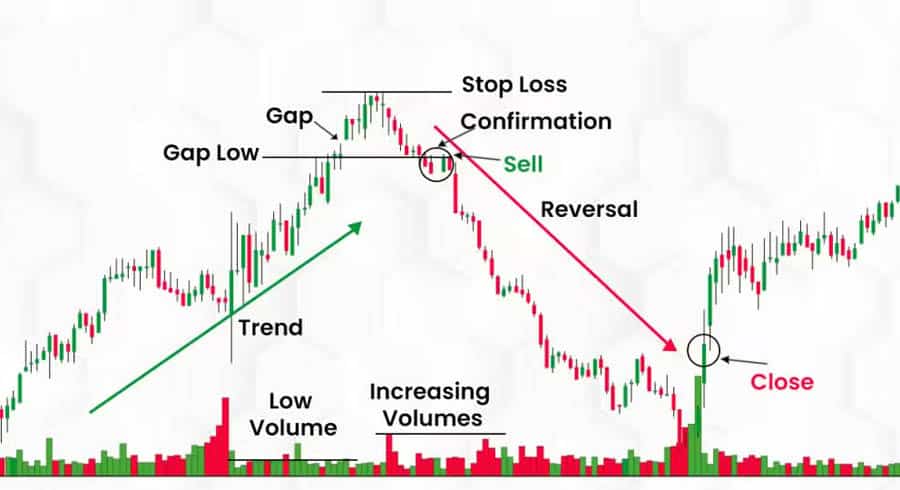
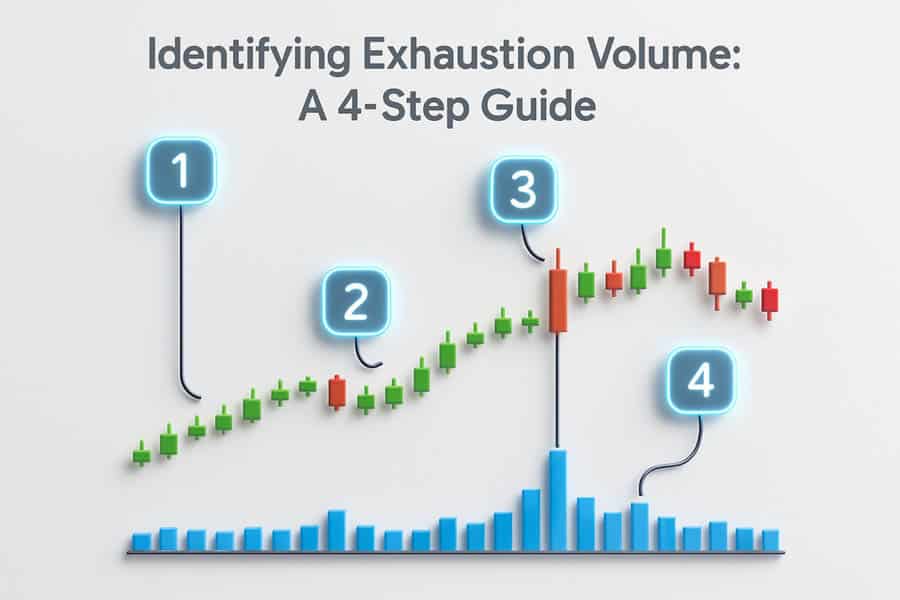
Let’s walk through a hypothetical example of a buying climax at the top of an uptrend:
- Identify a Sustained Trend: First, look for a stock or asset that has been in a clear, prolonged uptrend for a significant period. The price has been making higher highs and higher lows consistently.
- Look for the Volume Anomaly: Scan the volume indicator at the bottom of your chart. You are looking for a volume bar that is dramatically taller than the average volume over the last 20-50 periods. This should immediately catch your eye. Let’s say you see a volume spike that is three or four times the recent average.
- Analyze the Corresponding Price Action: Now, look at the price candle that corresponds with that huge volume spike. Did the price shoot up and close strongly near its high? Or did it shoot up and then pull back, leaving a long upper wick (a “pin bar” or “shooting star” candle)? The latter is a much stronger sign of exhaustion, as it shows that sellers stepped in and overwhelmed the buyers at that high price.
- Watch for the Follow-Through: This is the critical confirmation step. What happens in the next 1-3 candles?
- Does the price fail to make a new high?
- Does the volume drop off a cliff, returning to low levels?
- Does the price start to drift sideways or, even better, start to move down?
If you see a “yes” to these questions, you have likely identified a high-probability exhaustion volume setup. The uptrend has climaxed, the energy is gone, and a reversal is underway.
Key Patterns: Volume Spike, Followed by Price Stalling or Reversal
The most reliable exhaustion volume pattern is the one-two punch of a massive volume spike followed by a clear failure of the price to continue. Think of it as the market trying to punch through a wall. It throws all its energy into one massive punch (the volume spike), but the wall (resistance) holds firm. The price stalls or bounces back. Having spent all its energy, the market has no choice but to retreat.
Visually, this often looks like a large candlestick on huge volume, followed by smaller candlesticks on much lower volume that fail to surpass the high of the first candle. This price action tells you that despite the huge number of trades that took place, no new ground was gained. The battle has been fought, and the trend has lost.
Read More: Mastering the Volume Indicator in Forex Trading for Success
Tools: Exhaustion Volume Indicators
While you can identify exhaustion volume manually using the standard volume indicator, several specialized tools can help automate the process. A “volume exhaustion indicator” is designed to highlight these specific events on your chart. These indicators typically use an algorithm to identify statistically significant volume spikes relative to a recent average. When a spike is detected, the indicator might plot a dot, arrow, or colored bar on your chart, alerting you to a potential exhaustion point.
These indicators can be particularly useful for beginners as they help train your eye to spot these setups. They can also be used to create automated alerts, so you don’t have to be glued to the screen all day. However, it’s crucial to remember that no indicator is a magic bullet. You should always use a volume exhaustion indicator in conjunction with your own analysis of the price action and overall market context.
Using Volume with Support/Resistance Levels
Combining volume analysis with classic support and resistance levels can create incredibly powerful trading setups. An exhaustion volume spike that occurs right at a major, pre-identified resistance level is a much stronger signal than one that happens in the middle of nowhere.
Here’s why: The resistance level is an area where sellers are already expected to be active. When the price reaches this level and a huge volume spike occurs, it suggests a major battle is taking place between the last of the buyers and the waiting sellers. If the price then fails to break through the resistance and reverses, it confirms that the sellers have won the battle. The trend is likely over. This confluence of a key price level and an extreme volume signal gives you a much higher degree of confidence in the trade.
Exhaustion Volume Gaps in Trading
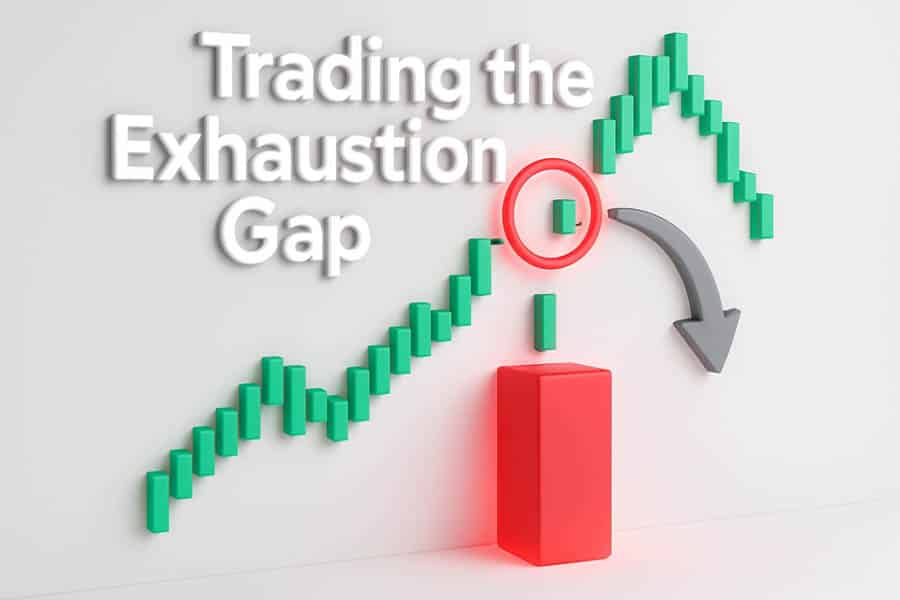
Among the various exhaustion signals, the exhaustion gap holds a special place. It’s a dramatic and often highly reliable pattern that can signal the absolute end of a trend. When an exhaustion gap appears, it’s like the market is shouting that the final, desperate move has just been made. Understanding this specific type of gap is crucial for any trader serious about volume analysis.
What Is an Exhaustion Gap?
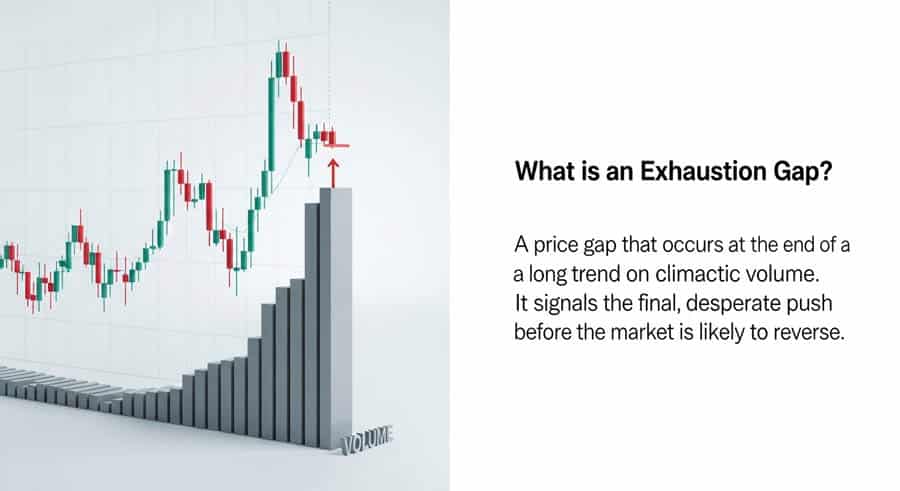
An exhaustion gap is a price gap that occurs late in a trend, accompanied by very high volume. A gap is simply an area on a chart where no trading took place. In an uptrend, the price opens significantly higher than the previous day’s high. In a downtrend, it opens significantly lower than the previous day’s low. What makes it an exhaustion gap is its timing and the volume associated with it.
This gap represents the final surge of emotional, herd-like behavior. In an uptrend, it’s the last wave of FOMO buyers piling in, pushing the price up at the open. In a downtrend, it’s the final wave of panic sellers capitulating. However, this final push is unsustainable. The gap is often quickly “filled,” meaning the price reverses and moves back across the gapped area. This filling of the gap is the classic sign that confirms the exhaustion.
Read More: Exhaustion Gap vs Breakaway Gap
Difference Between Exhaustion Gap and Breakout/Runaway Gaps
It’s vital to distinguish an exhaustion gap from other types of gaps, as they signal very different things:
- Breakout Gap: This happens at the beginning of a trend, when the price breaks out of a consolidation pattern (like a range or triangle). It signals the start of a new move and is usually a sign of strength.
- Runaway (or Measuring) Gap: This occurs in the middle of a strong, established trend. It’s a sign that the trend is healthy and has plenty of momentum to continue. It essentially reaffirms the direction of the trend.
- Exhaustion Gap: This occurs at the end of a long trend. It signals the end of the move.
The key differences lie in their location and the subsequent price action. Breakout and runaway gaps typically are not filled, and the trend continues. An exhaustion gap is almost always filled relatively quickly, and the trend reverses. The volume can also be a clue: while all gaps often occur on higher volume, the volume on an exhaustion gap is often climactic and extreme.
How to Confirm an Exhaustion Gap with Volume Analysis
Confirmation is everything when trading gaps. Here’s how to use volume to confirm that you’re looking at a true exhaustion gap:
- Check the Volume on the Gap Day: The day the gap occurs should be on a massive volume spike. This confirms the climactic, emotional nature of the move.
- Watch the Following Day: The confirmation often comes on the very next trading day. Look for a reversal. For an exhaustion gap up, you would want to see the price open and then close lower, ideally closing below the opening price of the gap day. This is called a “reversal day” and is a strong signal.
- Look for the Gap to be Filled: The ultimate confirmation is when the price moves back and completely closes the gap. For a gap up, this means the price trades back down to the level of the previous day’s high. Once the gap is filled, the probability of a full trend reversal is very high.
The volume on the reversal day is also important. If the reversal happens on strong volume, it adds even more weight to the signal, showing conviction in the new direction.
Entry/Exit Strategies Around Exhaustion Gaps
Trading an exhaustion gap requires a clear plan. Here are some common strategies:
- The Aggressive Entry: An aggressive trader might enter a short position (for a gap up) during the gap day itself if they see the price starting to reverse intraday and a bearish candlestick pattern forming. This offers the best potential reward but carries the highest risk.
- The Confirmation Entry: A more conservative approach is to wait for the gap to be filled. Once the price has closed the gap, you can enter a trade in the direction of the reversal. For a gap up that has been filled, you would go short. The stop-loss can be placed just above the high of the exhaustion gap day.
- Exiting a Position: If you are already in a long position and you see an exhaustion gap up, it’s a strong signal to take profits and exit the trade. The party is likely over, and holding on could mean giving back a significant portion of your gains.
Trading exhaustion gaps can be highly profitable, but it requires patience and discipline. It’s not just about seeing a gap; it’s about understanding its context, confirming it with volume and price action, and executing a well-defined plan. It’s a prime example of exhaustion volume trading at its finest.
Trade with a Trusted Broker
Enhance your trading strategies with a reliable partner. Opofinance, an ASIC-regulated broker, offers the tools you need to succeed in today’s markets.
- Advanced Trading Platforms: Choose from MT4, MT5, cTrader, and the intuitive OpoTrade platform.
- Innovative AI Tools: Leverage our AI Market Analyzer, AI Coach, and 24/7 AI Support for smarter trading decisions.
- Flexible Trading Options: Explore opportunities in Social Trading and Prop Trading.
- Secure & Flexible Transactions: Enjoy safe and convenient deposits and withdrawals, including crypto payments with zero fees.
Start Trading with Opofinance Today!
Conclusion
Mastering exhaustion volume is a journey, not a destination. It’s about learning to read the market’s underlying story of greed and fear, momentum and fatigue. By identifying volume spikes, understanding volume exhaustion, and correctly interpreting an exhaustion gap, you can move beyond simply following trends and start anticipating when they will end. This predictive power is a significant advantage in any market. Remember to combine volume analysis with price action and other tools, always manage your risk, and continue to learn from every trade.
References: +
How often does exhaustion volume accurately predict reversals?
While there’s no magic number, exhaustion volume is one of the more reliable reversal signals, especially when it occurs at a key support or resistance level and is confirmed by subsequent price action. Its accuracy increases significantly when multiple confirming factors are present.
Can exhaustion volume be automated in alerts/screeners?
Yes, many trading platforms and charting software allow you to set up alerts for unusual volume activity. You can create a condition where you are notified if the volume of a single candle exceeds the average volume by a certain percentage (e.g., 300%). This is a great way to have potential exhaustion setups brought to your attention automatically.
What are the best volume indicators for beginners?
For a beginner, the standard, simple volume indicator that comes with every charting package is the best place to start. Before moving on to more complex tools like a specialized volume exhaustion indicator or volume profile, it’s essential to have a solid understanding of the basics of reading volume bars in context with price.
Is exhaustion volume relevant for cryptocurrency trading?
Absolutely. The crypto markets are known for their high volatility and strong, sentiment-driven trends. This makes them particularly well-suited for exhaustion volume analysis. A volume spike reversal in a cryptocurrency can often signal a dramatic and swift trend change, providing significant opportunities for traders who can spot it.
Can a trend resume after an exhaustion volume signal?
Yes, it is possible, though less common. This is known as a fake-out or a “failed” exhaustion signal. It typically happens if a major news event occurs that reinvigorates the trend. This is why waiting for confirmation—such as a break of the trendline or a lower high/higher low—is a crucial part of any exhaustion volume trading strategy. It helps you avoid jumping into a reversal that doesn’t materialize.


