

The flag pattern in forex is a powerful continuation signal indicating that a market’s prevailing trend is likely to resume after a brief pause. For any trader working with a regulated forex broker, understanding this pattern is fundamental. It appears as a small, rectangular consolidation on a chart after a sharp, significant price move. This guide provides an experience-driven walkthrough, covering how to identify the core structure, differentiate between bullish and bearish flags, and execute a complete trading plan from entry to exit, turning this classic pattern into a reliable tool in your arsenal.
Key Takeaways
- Continuation Signal: The flag pattern signals a temporary pause in a strong trend, not a reversal. The subsequent breakout is expected to continue in the original direction.
- Core Structure: It consists of two main parts: the ‘flagpole’ (a sharp, initial price move) and the ‘flag’ (a parallel consolidation channel that slopes against the trend).
- Two Variations: The bullish flag pattern in forex forms during an uptrend, while the bearish flag forms during a downtrend. Each has specific identification and trading rules.
- Volume is Key: A classic flag pattern in forex shows high volume during the flagpole, decreasing volume during the consolidation (the flag), and a surge in volume on the breakout, confirming the pattern’s validity.
- Clear Trading Rules: The pattern provides objective entry (breakout), stop-loss (beyond the opposite side of the flag), and profit target (measured by the height of the flagpole) levels, allowing for clear risk-reward calculations.
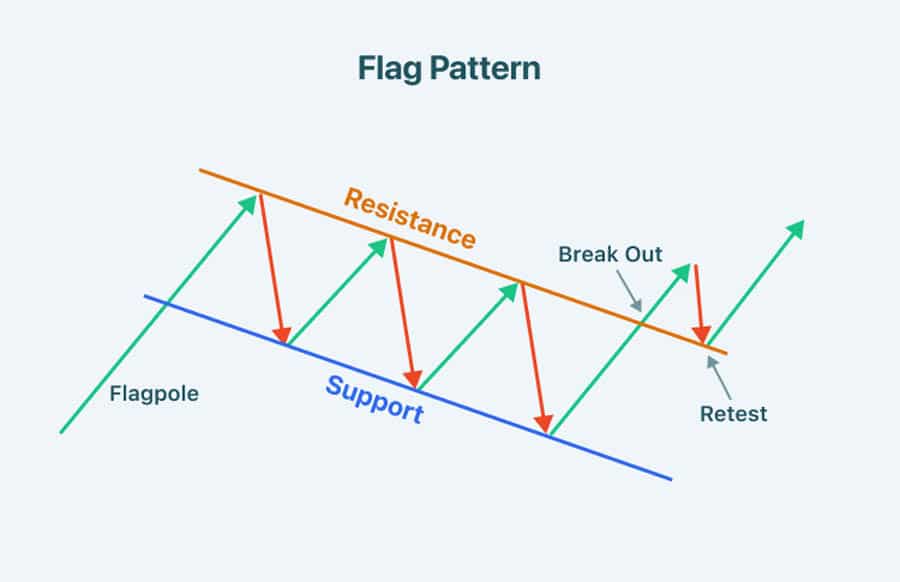
Flag Pattern in Forex: The Core Structure
From years of watching charts, I can tell you that the beauty of the flag pattern in forex lies in its simplicity and logic. It tells a clear story of market psychology: a strong conviction move, a period of profit-taking and consolidation, and then the resumption of the original sentiment. It’s not just a shape on a chart; it’s a narrative of institutional and retail behavior. Understanding its components is the first step to trading it effectively.
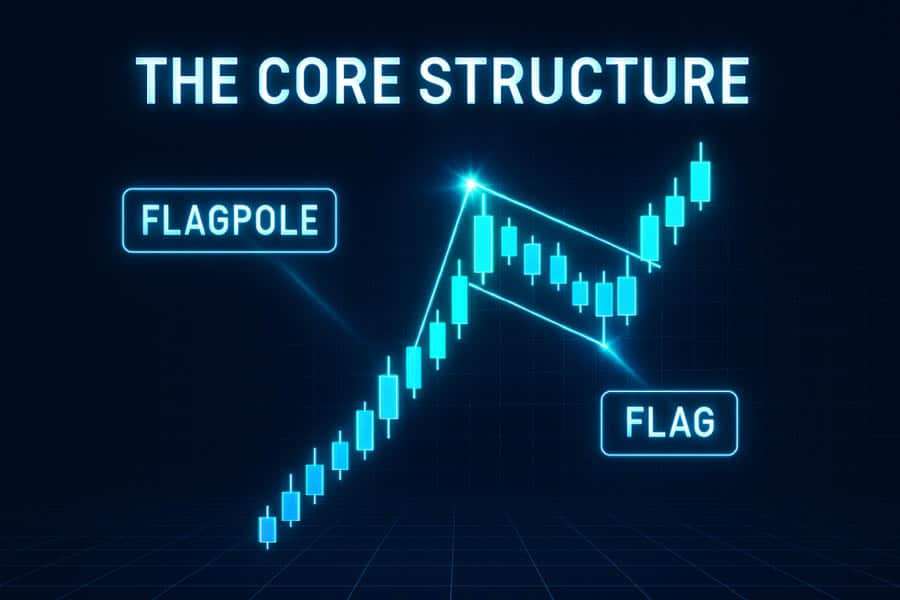
The Flagpole
The flagpole is the foundation of the entire pattern. It is a sharp, almost vertical price move that represents the initial burst of momentum. Think of it as the market making a decisive statement. In a bullish context, this is a strong surge upward; in a bearish one, a steep drop. A weak, choppy, or gradual flagpole is a red flag for me. It suggests a lack of conviction, and any subsequent consolidation might not be a true flag pattern in forex but something else entirely. The height of this pole is not just for show; it becomes a critical tool for projecting our profit target later on.
The Consolidation Channel
After the flagpole, the market takes a breath. This is the flag itself—a brief, orderly consolidation. Visually, it looks like a small, rectangular or parallelogram-shaped channel that slopes against the prevailing trend. For a bullish flag pattern in forex, this channel will drift downwards. For a bearish flag, it will drift upwards. The parallel nature of its trendlines is crucial. If the lines are converging, you’re looking at a pennant, not a flag. This period represents a healthy pause, where early buyers or sellers take some profit and new participants prepare to enter, fueling the next move. A shallow, controlled pullback is what you want to see. A retracement that goes beyond 50% of the flagpole often invalidates the pattern in my playbook.
The Breakout and Continuation
The breakout is the moment of truth and the trigger for action. It occurs when the price breaks out of the consolidation channel in the original direction of the flagpole. For a bullish flag, this is a break above the upper trendline; for a bearish flag, a break below the lower one. But a simple price cross isn’t enough. I always wait for confirmation, ideally a candle closing decisively outside the channel, accompanied by a significant increase in volume. This volume expansion tells you that the market is ready to resume its trend with conviction. A breakout on weak volume is a warning sign that it could be a false move, a trap I learned to avoid early in my career.
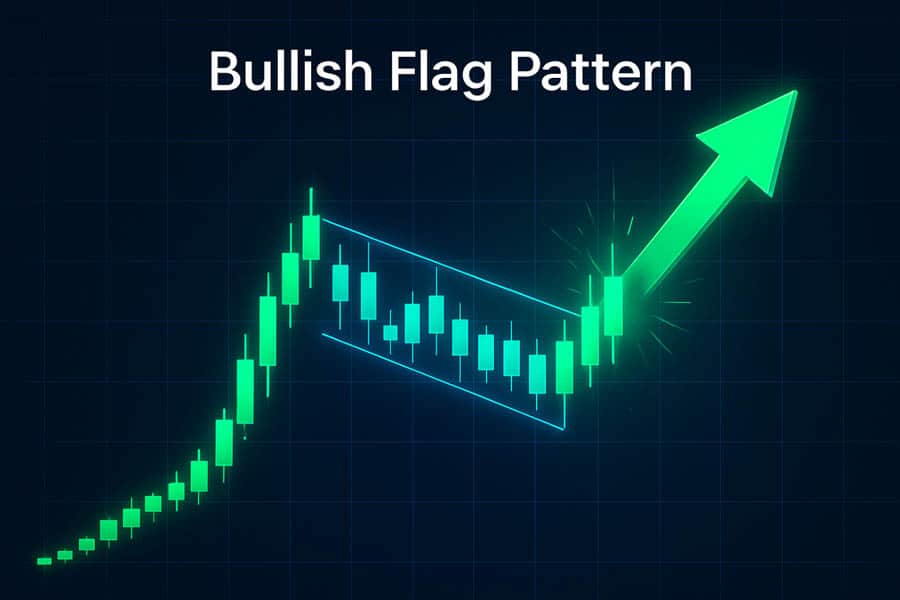
Bullish Flag Pattern in Forex
The bullish flag pattern in forex is a trader’s signal that an uptrend is likely to continue. It’s one of the more reliable patterns because it appears in strongly trending markets where the underlying buying pressure is evident. Spotting and trading it correctly requires a methodical approach, moving from identification to execution with discipline. This pattern is a frequent sight in major pairs like EUR/USD or GBP/USD during strong directional sessions.
Identification Checklist
To confidently identify a bullish flag pattern in forex, I run through a mental checklist before even considering a trade. It keeps me objective and prevents me from seeing patterns that aren’t there.
- Preceding Uptrend: Is there a clear, strong uptrend in place on the timeframe I’m observing? A flag needs a trend to continue.
- The Flagpole: Is there a sharp, near-vertical rally on high volume? This confirms the initial buying conviction.
- The Flag: Does the price consolidate within a downward-sloping channel with two roughly parallel trendlines?
- Shallow Retracement: Does the flag’s lowest point retrace less than 38.2% (and certainly no more than 50%) of the flagpole’s height? Deeper retracements suggest the trend might be weakening.
- Volume Contraction: Does the volume diminish during the flag’s formation? This is crucial. It shows that the downward drift is just a pause, not a reversal driven by strong selling pressure.
Entry, Stop, and Target
Once the pattern is validated, the trading plan is straightforward. The rules are mechanical, which helps remove emotion from the decision-making process.
- Entry: The standard entry is on the breakout. I place a buy order when a candle closes decisively above the upper trendline of the flag. Chasing the price mid-breakout is risky; patience for a candle close provides better confirmation.
- Stop-Loss: The stop-loss should be placed just below the lowest point of the flag. This gives the trade enough room to breathe but ensures you exit quickly if the pattern fails and the price breaks down instead.
- Profit Target: The classic target is calculated by measuring the height of the flagpole (from its base to its peak) and projecting that same distance upward from the breakout point. For example, if the flagpole was a 100-pip move, the target would be 100 pips above the breakout level.
Volume and Confirmation
I cannot overstate the importance of volume in trading the flag pattern in forex. It’s the ultimate lie detector. The ideal sequence is: 1) Expansion during the flagpole, 2) Contraction during the consolidation, and 3) Expansion on the breakout. When I see this volume signature, my confidence in the trade increases dramatically. A breakout that occurs on low or declining volume is a major red flag. It often precedes a “fakeout,” where the price briefly pokes through the trendline only to reverse back into the channel. Waiting for volume to support the price action is a lesson that has saved me from countless losing trades.
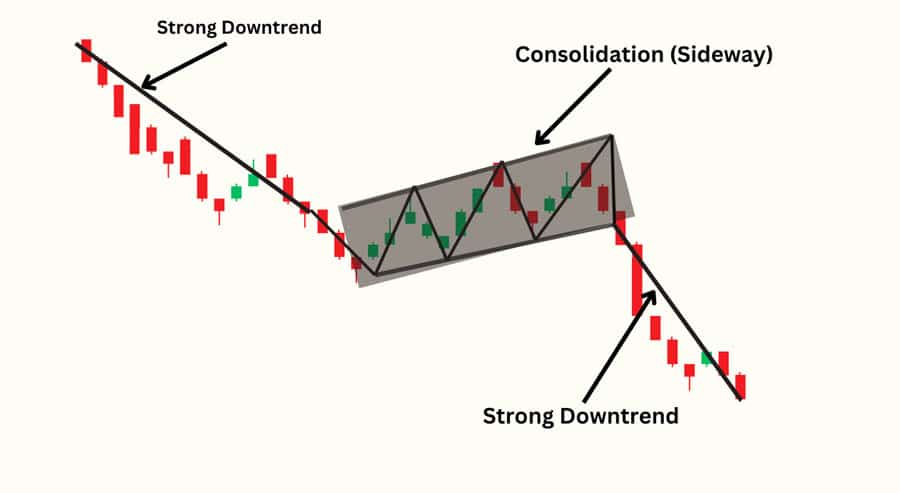
Bear Flag Pattern in Forex Trading
The bear flag is the mirror image of the bull flag and is a powerful signal of bearish continuation. In the world of flag pattern in forex trading, it signals that a downtrend has paused but is very likely to resume its downward trajectory. It represents a brief period where sellers take a breather and some minor buying comes in before the dominant selling pressure takes over again. Identifying it correctly is key to capitalizing on continued downside momentum.
Identification
The criteria for identifying a bear flag are just as strict as for its bullish counterpart. The context is everything. You need to see a strong downtrend already in place for this pattern to have any meaning.
- Preceding Downtrend: The chart must show a clear and established downtrend.
- The Flagpole: A sharp, steep drop in price on significant volume forms the flagpole. This represents the initial selling pressure.
- The Flag: Following the drop, the price consolidates in a slightly upward-sloping channel. This brief rally is weak and corrective in nature, forming the flag. The trendlines should be roughly parallel.
- Volume Signature: Volume should be high during the flagpole’s decline, then noticeably decrease during the upward consolidation of the flag. This indicates the buying interest is weak and not a threat to the overall downtrend.
Trading Rules
The trading plan for a bear flag pattern in forex is a direct reflection of the bull flag’s plan, just inverted.
- Entry: The entry trigger is a confirmed break below the lower trendline of the flag. I typically place a sell order once a candle closes firmly beneath this support line.
- Stop-Loss: The stop-loss is placed just above the highest point of the flag formation. This defines your risk and protects you if the pattern fails and the price rallies instead.
- Profit Target: To set the target, measure the height of the bearish flagpole (from its highest point to its lowest). Then, project that distance downward from the breakout point. This measured move technique provides a logical and objective price target.
Successfully trading the bear flag pattern in forex trading depends on respecting these rules. From experience, the most common mistake traders make is entering too early, before the breakout is confirmed by a candle close and a pick-up in volume. Patience is paramount.
Flag Pattern in Forex vs. Pennant
In technical analysis, details matter. Traders often confuse the flag pattern in forex with its close cousin, the pennant. Both are short-term continuation patterns that appear after a strong price move, but their internal structure is different. Recognizing this difference can refine your analysis and improve your trading precision. Both signal a pause in the trend, but their shape tells a slightly different story about the consolidation period.
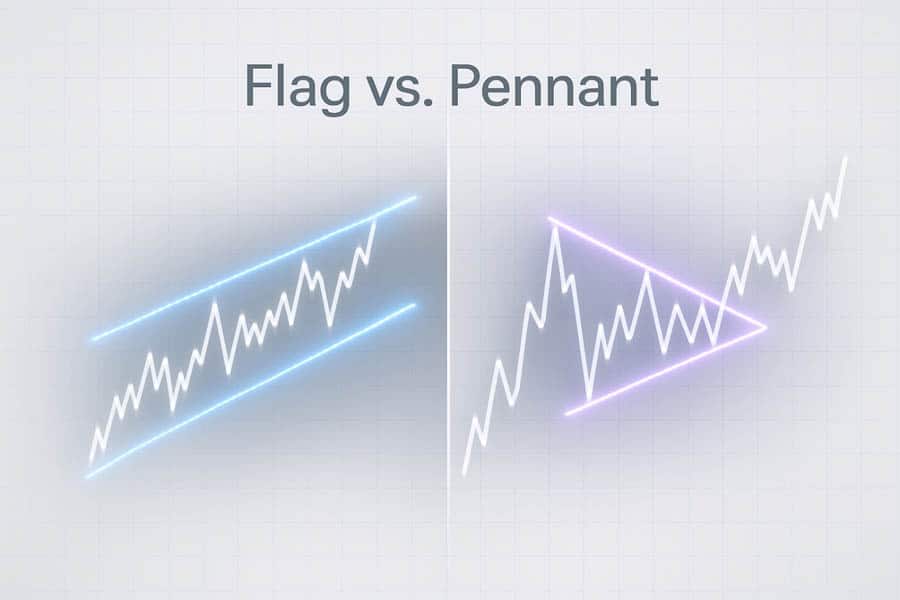
Parallel vs. Converging Lines
The defining difference lies in the shape of the consolidation phase. A flag pattern in forex is characterized by a consolidation that takes place between two parallel trendlines, forming a small, tilted rectangle. This shows a very orderly and controlled pullback. In contrast, a pennant features two converging trendlines, forming a small, symmetrical triangle. This convergence indicates that volatility is contracting and pressure is building toward an imminent breakout. While both patterns are traded similarly (entry on breakout, stop on the other side, target based on the flagpole), some traders feel the converging nature of the pennant can lead to a more explosive breakout. For me, the key takeaway is that both are continuation signals, but you should always correctly identify the structure you’re trading.
Timeframes, Bar Count, and Contexts
One of the great advantages of the flag pattern in forex is its versatility. It’s a fractal pattern, meaning it can appear on any timeframe, from a 1-minute chart for scalpers to a daily chart for swing traders. However, the context in which it appears is crucial. A flag on a 15-minute chart that aligns with the dominant trend on the 4-hour chart is a much higher-probability setup than one that goes against it. I’ve found the most reliable flags form over a specific duration. Typically, a healthy flag consists of about 5 to 15 price bars. If the consolidation drags on for too long, it starts to look less like a brief pause and more like a range or a potential reversal, losing its continuation power.
Reliability, Advantages, and Limitations
No pattern is foolproof, and the flag pattern in forex is no exception. However, it is widely respected for a reason. Its main advantage is its clarity. It provides a well-defined structure with clear entry, stop-loss, and target levels, leading to an excellent risk-to-reward ratio, often 1:2 or better. This makes managing trades systematic. The pattern is also effective across various markets, not just forex. However, its main limitation is its reliance on context. In a choppy, sideways market, you’ll see many shapes that look like flags but will consistently fail. They are only reliable within a strong, established trend. False breakouts are another risk, which is why waiting for confirmation through a candle close and volume is a non-negotiable rule in my strategy.
Invalidation Rules and Common Mistakes
Knowing when a pattern is not a valid flag pattern in forex is just as important as knowing when it is. Here are some invalidation rules I’ve learned to respect, often the hard way:
- Deep Retracement: If the flag consolidates and pulls back more than 50% of the flagpole’s length, the pattern is likely invalid. A true flag is a shallow pause; a deep retracement signals the initial momentum is fading fast.
- Wrong Slope: A bullish flag must slope down, against the uptrend. If it slopes up, it’s not a flag. Similarly, a bearish flag must slope up.
- No Volume Contraction: If volume remains high or increases during the flag’s consolidation, it suggests a real battle between buyers and sellers, not a simple pause. This can lead to a reversal, not a continuation.
- Extended Consolidation: If the flag takes too many bars to form (e.g., more than 20-25), it loses its character as a brief pause. The urgency is gone, and it often morphs into a trading range.
The most common mistake is forcing the pattern. If you have to squint and hope to see a flag, it’s probably not there. The best setups are clean, obvious, and meet all the criteria without ambiguity.
Practical Trading Plans for the Flag Pattern
Having a theoretical understanding of the flag pattern in forex is one thing; having actionable trading plans is another. Over the years, I’ve refined my approach into two primary strategies: the aggressive breakout entry and the more conservative retest entry. Both have their merits, and the choice often depends on market volatility and my risk appetite for that particular trade.
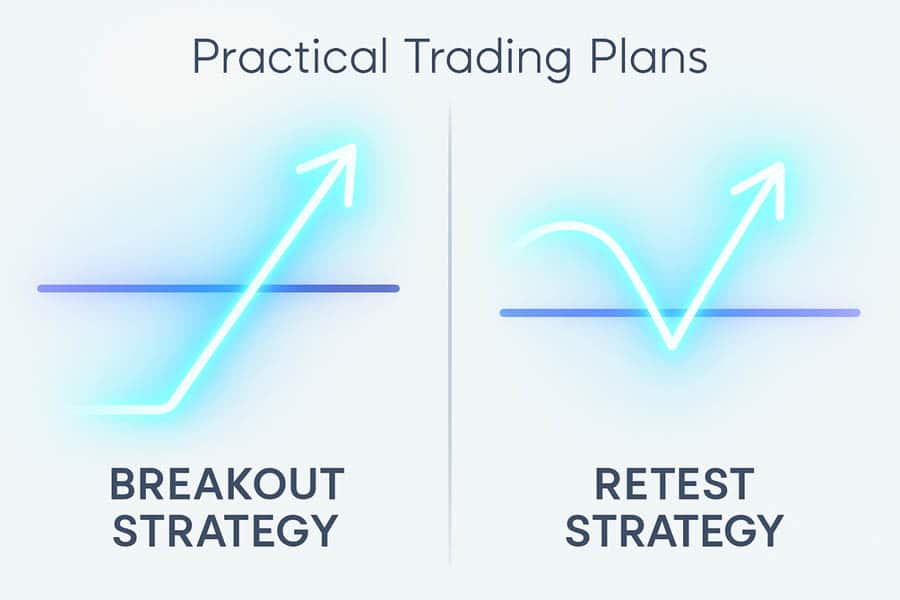
The Breakout Strategy
This is the most common way to trade the flag pattern in forex. The plan is straightforward:
- Criteria: All identification criteria for a valid bull or bear flag must be met, including the trend, flagpole, parallel channel, and volume signature.
- Entry Trigger: Enter a trade on the close of the candle that breaks out of the flag’s consolidation channel. For a bullish flag, this is a close above the upper trendline. For a bearish flag, a close below the lower trendline.
- Stop-Loss: Place the stop-loss just outside the opposite boundary of the flag. For a bull flag, it goes below the flag’s low. For a bear flag, above the flag’s high.
- Target: Use the measured move technique by projecting the flagpole’s height from the breakout point.
- Risk-Reward: I never take a trade unless it offers a minimum risk-to-reward ratio of 1:2. The flag pattern often provides this.
The Retest Strategy
This is a more conservative approach that can help avoid false breakouts. It requires more patience but often results in a better entry price and a tighter stop-loss.
- Action: Wait for the initial breakout to occur. Do not enter. Instead, wait for the price to pull back and “retest” the broken trendline.
- Entry Trigger: If the price retests the broken trendline and holds (i.e., it bounces off it, confirming it has switched from resistance to support, or vice versa), enter the trade. The entry candle is often a pin bar or an engulfing candle at the retest level.
- Stop-Loss: The stop can be placed more aggressively, just beyond the low (for a bull flag) or high (for a bear flag) of the retest candle. This often reduces the risk in pips compared to the breakout strategy.
- Target: The profit target remains the same: the flagpole’s height projected from the original breakout point.
This retest strategy requires a steady hand, as you might watch the price move significantly after the breakout and feel you’ve missed it. However, in many cases, the market provides this second-chance entry, and it’s often a higher-probability setup.
Measuring Targets and Managing Trades
Executing a trade on a flag pattern in forex is only half the battle; managing it is where profitability is truly determined. The measured move target is an excellent guide, but markets are dynamic. I often manage my trades by taking partial profits. For instance, once the price has moved in my favor by a distance equal to my initial risk (a 1:1 risk-reward ratio), I might close half of my position and move my stop-loss to the breakeven point. This secures some profit and turns the remainder of the trade into a “risk-free” opportunity to capture the full target. Adapting to volatility is also key. During a highly volatile session, I might use a wider stop or aim for a more conservative target, whereas in a smooth, trending market, I’ll have more confidence in letting the trade run to its full potential.
Opofinance: Trade with a Technological Edge
Choosing the right platform is as critical as mastering any trading pattern. Opofinance, an ASIC-regulated broker, empowers traders to effectively capitalize on opportunities like the flag pattern in forex.
- Advanced Trading Platforms: Choose from industry standards like MT4, MT5, cTrader, or the intuitive OpoTrade platform.
- Innovative AI Tools: Leverage the AI Market Analyzer, AI Coach, and AI Support to enhance your decision-making.
- Flexible Trading Options: Explore Social & Prop Trading to diversify your strategies.
- Secure & Flexible Transactions: Enjoy safe and convenient deposits and withdrawals, including crypto payments with zero fees.
Elevate your flag pattern in forex trading with superior tools and security. Open an account with Opofinance today!
Conclusion
The flag pattern in forex remains one of the most reliable and practical tools for trend-following traders. Its clear structure provides objective entry, stop, and target levels, removing much of the guesswork from trading. By focusing on high-probability setups—those with a strong flagpole, shallow consolidation, contracting volume, and a decisive breakout—you can integrate this pattern into a disciplined and profitable strategy. Remember that context is everything; a flag is only powerful when it appears within a clear, pre-existing trend. Master its nuances, and you’ll be well-equipped to ride the market’s momentum.
How accurate is the flag pattern?
The accuracy of a flag pattern in forex is highly dependent on context. In a strong, trending market with confirming volume, it is considered one of the more reliable continuation patterns. However, in choppy or range-bound markets, its reliability decreases significantly.
Can the flag pattern be a reversal signal?
No, by definition, the flag pattern in forex is a continuation pattern. If the price breaks out of the consolidation in the opposite direction of the trend, the pattern has failed and could signal a potential reversal, but it is no longer considered a flag pattern.
What happens if volume doesn’t confirm the breakout?
A breakout on low volume is a significant warning sign. It often indicates a lack of conviction behind the move and increases the probability of a “false breakout,” where the price quickly reverses back into the consolidation channel. Experienced traders often wait for volume confirmation before entering.
Does the angle of the flag matter?
Yes, the angle is critical. A bullish flag should slope downward, against the primary uptrend. A bearish flag should slope upward, against the primary downtrend. A flag that slopes in the same direction as the trend is not a valid pattern.
Can I trade flag patterns without a broker?
To trade any pattern in the live foreign exchange market, including the flag pattern in forex, you need access to the market through a licensed and regulated forex trading broker. They provide the necessary trading platform and liquidity.
References:


