

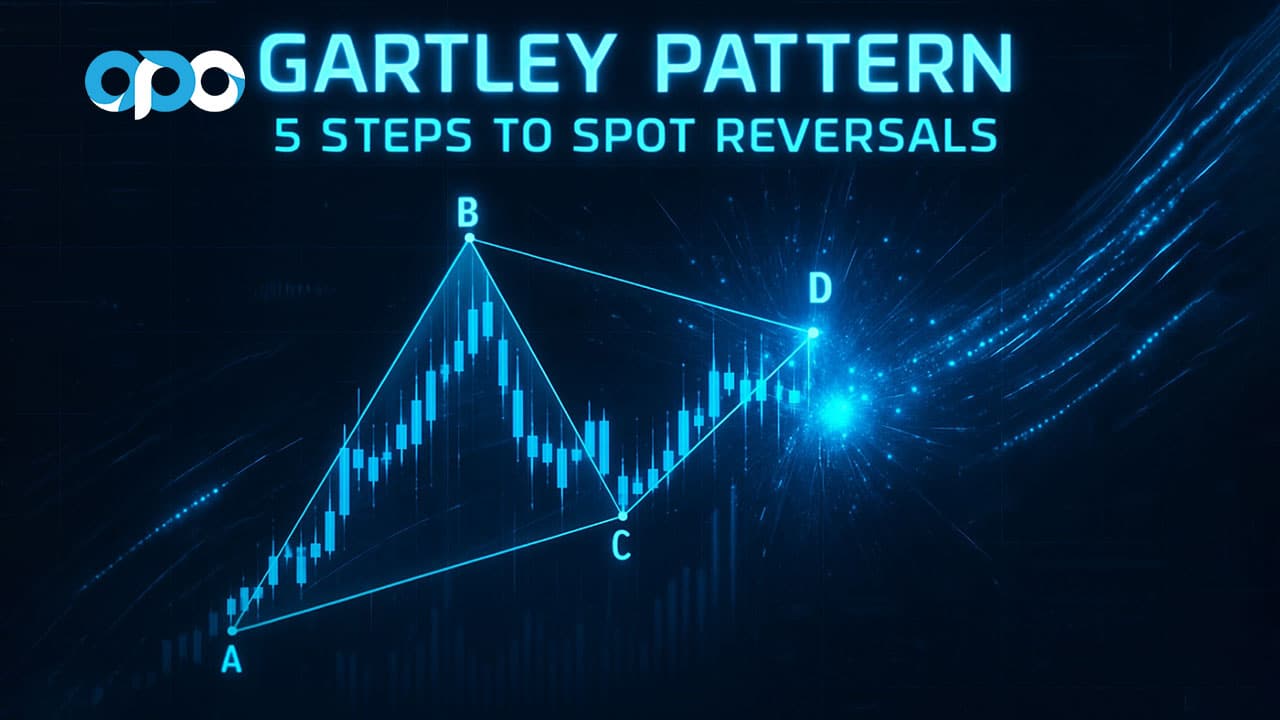
The Gartley pattern is a five-point harmonic chart structure that helps traders identify potential price reversals with a high degree of accuracy. It uses specific Fibonacci ratios to pinpoint market turning points before they happen. This guide offers a complete roadmap to identifying and trading this classic pattern, from its core structure to advanced strategies. Whether you are using an advanced online forex broker or just starting, understanding the Gartley can significantly enhance your technical analysis toolkit. We will cover its structure, the psychology behind it, and a step-by-step trading plan.
Key Takeaways
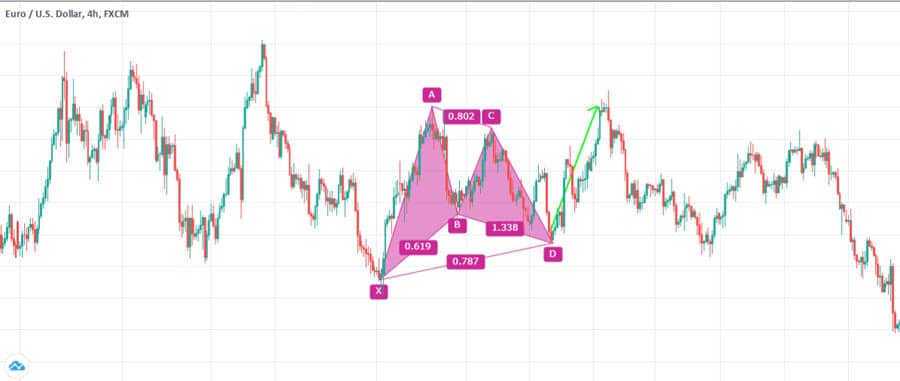
- Definition: The Gartley pattern is a leading indicator consisting of five points (X, A, B, C, D) that form a distinct “M” or “W” shape on the chart.
- Core Ratios: Its structure is defined by precise Fibonacci ratios. The most crucial are the 0.618 retracement of the XA leg to form point B and the 0.786 retracement of the XA leg to identify the completion point D.
- Reversal Indicator: A bullish Gartley signals a potential buying opportunity at point D, while a bearish Gartley suggests a potential selling opportunity.
- Confirmation is Key: While powerful, the pattern should not be traded in isolation. Always seek confirmation from other indicators like candlestick patterns or momentum oscillators (e.g., RSI) at the completion point.
- Universal Application: The Gartley pattern is versatile and can be effectively applied across all markets (forex, stocks, crypto) and timeframes, from minutes to weeks.
Gartley Pattern Explained
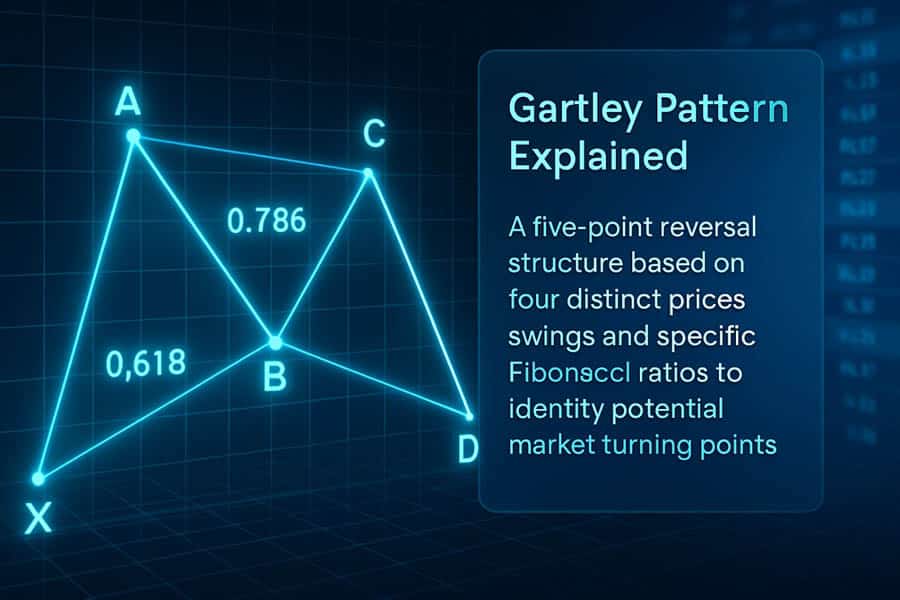
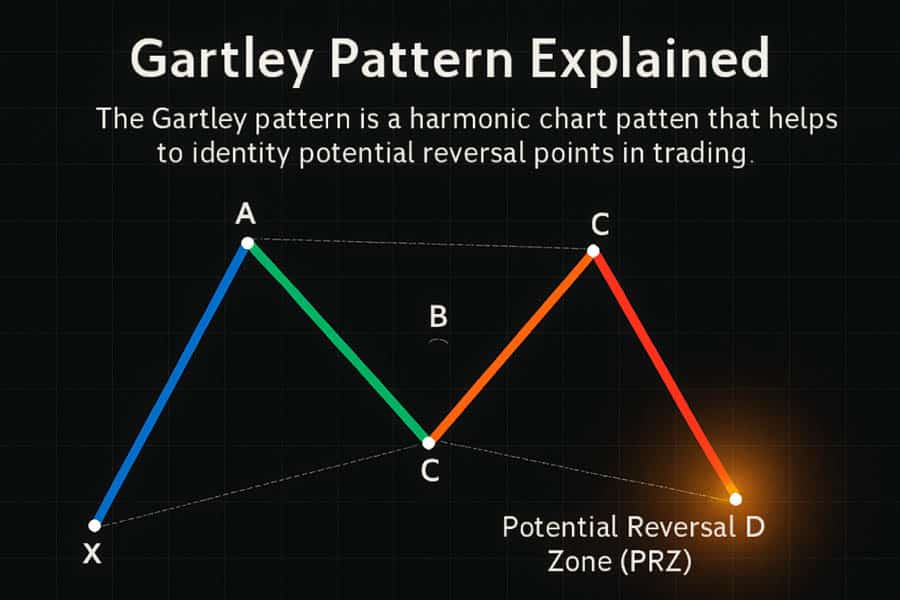
The Gartley pattern is a classic harmonic pattern that provides a framework for identifying high-probability reversal zones based on a specific sequence of price movements and their corresponding Fibonacci levels.
What Is a Gartley Pattern?
So, what is a Gartley pattern exactly? It’s a structure composed of four distinct price swings, or “legs,” that must conform to a specific set of Fibonacci ratios Gartley traders rely on. It was first detailed by H.M. Gartley in his 1935 book, “Profits in the Stock Market,” and later refined by traders like Larry Pesavento, who added the specific Fibonacci measurements that are central to the pattern’s modern application. The enduring appeal of the Gartley pattern lies in its structured, rule-based approach to trading, which removes much of the guesswork from identifying reversals.
- XA Leg: This is the initial impulse move and the longest leg of the pattern. It sets the foundation for all subsequent measurements.
- AB Leg: Price reverses and retraces a portion of the XA leg. This retracement should be as close as possible to 61.8% of the XA move. This is a non-negotiable rule.
- BC Leg: Price reverses again, moving in the same direction as the initial XA leg. It typically retraces between 38.2% and 88.6% of the AB leg.
- CD Leg: This is the final and most crucial leg. Price reverses one last time to complete the pattern. This leg is an extension of the BC leg, typically reaching the 127.2% or 161.8% level. Most importantly, point D must align with the 78.6% retracement of the initial XA leg. This convergence of ratios at point D creates the Potential Reversal Zone (PRZ).
Bullish vs. Bearish Gartley Checklist
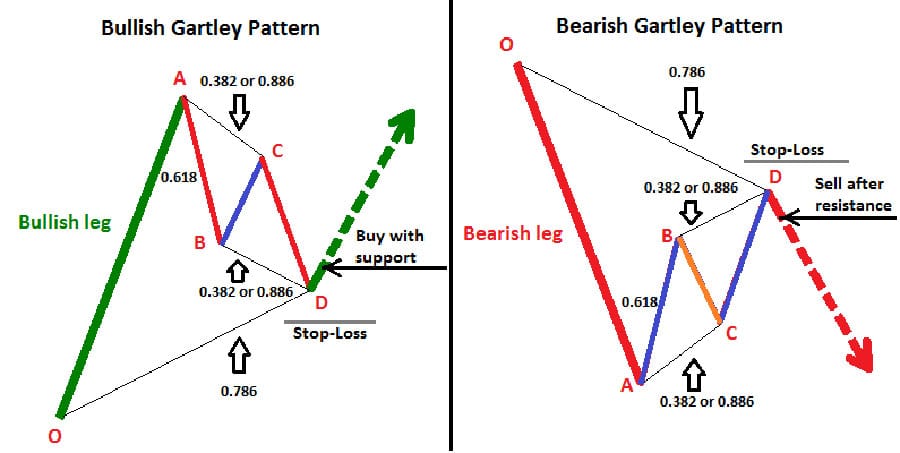
The rules are symmetrical, whether you’re looking for a bottom (bullish) or a top (bearish).
| Pattern Component | Bullish Gartley (Buy Setup) | Bearish Gartley (Sell Setup) |
| Shape | Resembles a “W” | Resembles an “M” |
| Point B Retracement | Retraces to 61.8% of XA | Retraces to 61.8% of XA |
| Point C Retracement | Retraces 38.2% – 88.6% of AB | Retraces 38.2% – 88.6% of AB |
| Point D Completion | Completes at 78.6% retracement of XA | Completes at 78.6% retracement of XA |
| CD Leg Projection | 127.2% – 161.8% extension of BC | 127.2% – 161.8% extension of BC |
| Action at Point D | Look for buy triggers | Look for sell triggers |
Why Traders Trust the Pattern

For nearly a century, traders have relied on the Gartley pattern for good reason. Its structure isn’t random; it reflects the natural ebb and flow of market psychology—the push and pull between buyers and sellers. My own experience has shown that its predictive power comes from its ability to identify points of trend exhaustion. Here are three core benefits.
- It’s a Leading Indicator: Unlike indicators like moving averages that follow price, the Gartley projects where price is likely to reverse *before* it happens. This gives you a significant edge in planning your entry.
- Built-in Risk Management: The pattern provides clear invalidation levels. For a bullish Gartley, a stop-loss is placed just below point X. This defines your maximum risk upfront, leading to excellent risk-to-reward ratios.
- Works on All Markets and Timeframes: The principles of market psychology are universal. I’ve successfully traded the Gartley pattern on everything from the 15-minute EUR/USD chart to the daily chart for major stocks and cryptocurrencies.
Mini-Case Study: Apple (AAPL) 2023 Bullish Reversal
In early 2023, Apple’s stock price formed a textbook bullish Gartley pattern on the daily chart. Point D completed near the $125 level, which coincided with the 78.6% Fibonacci retracement of a major prior upswing (the XA leg). Traders who identified the pattern and entered long positions upon bullish confirmation (such as a bullish engulfing candle at point D) saw the stock rally over 35% in the following months, reaching well above $170. This is a prime example of the pattern’s power to signal major trend changes.
Step-by-Step Identification
Finding a perfect Gartley pattern requires patience and a systematic approach. Don’t try to force a pattern onto a chart. Instead, follow these steps to ensure the structure is valid. I use my Fibonacci retracement and extension tools for this entire process.
Spot the XA Impulse
First, you need to find a significant, clear impulse move on your chart. This will be your XA leg. It should be a strong, directional move that stands out from the surrounding price action. In a bullish Gartley, XA is a sharp move up. In a bearish Gartley, XA is a sharp move down. This leg is the anchor for all your subsequent measurements.
Measure AB Retracement (61.8% of XA)
Once you’ve identified the XA leg, draw a Fibonacci retracement tool from point X to point A. The market should then reverse and form the AB leg. The crucial rule here is that point B must terminate at or very near the 61.8% retracement level of XA. If it falls significantly short or extends much beyond this level, the pattern is not a valid Gartley. This is the most important of the Fibonacci ratios Gartley rules.
Validate BC & CD
After point B is established, price reverses again to form the BC leg. Use your Fibonacci tool to measure the AB leg. Point C should be a retracement of 38.2% to 88.6% of the AB leg. It must not exceed point A. Finally, the CD leg is the last move. This leg is typically a 127.2% or 161.8% extension of the BC leg. The most critical part is that point D, where the pattern completes, must align with the 78.6% retracement of the entire XA leg. This convergence of calculations at D forms your Potential Reversal Zone (PRZ).
Pro Tip: Automate Your Search
Manually plotting every pattern can be time-consuming. Platforms like TradingView offer built-in harmonic pattern drawing tools and community-built scripts that automatically scan charts for the Gartley pattern and other harmonics. While these are great for speeding up your analysis, I always recommend manually verifying the Fibonacci ratios yourself to confirm the pattern’s validity before risking any capital.
Trading Strategy at Point D
Identifying the Gartley pattern is only half the battle; executing the trade correctly is what generates profit. The completion at point D is not an automatic entry signal. It’s an alert that a high-probability reversal zone has been reached. We must wait for the market to confirm our thesis.
Entry Triggers
Once price enters the Potential Reversal Zone (PRZ) around point D, I look for specific confirmation signals before entering a trade. My preferred triggers include:
- Bullish/Bearish Candlestick Patterns: For a bullish Gartley, look for a bullish engulfing, a hammer, or a piercing pattern to form within the PRZ. For a bearish Gartley, look for a bearish engulfing, a shooting star, or a dark cloud cover.
- RSI Divergence: This is a powerful confirmation. In a bullish Gartley, as price makes a lower low to form point D, the RSI indicator should be making a higher low. This bullish divergence suggests that downward momentum is fading and a reversal is imminent. The opposite is true for a bearish setup.
Stop-Loss Logic
The beauty of the Gartley pattern lies in its clearly defined risk. The invalidation point is unambiguous.
- For a bullish Gartley pattern, the stop-loss should be placed a few pips or ticks just below point X. If the price breaks below X, the entire pattern structure is negated.
- For a bearish Gartley pattern, the stop-loss should be placed just above point X. A break above this level invalidates the sell setup.
This logical placement ensures your losses are contained if the pattern fails.
Profit Targets
Once the trade is active, we need predefined exit points. A common and effective strategy is to use the Fibonacci retracement levels of the move from point A to point D.
- Target 1 (TP1): The 38.2% retracement of the AD leg. This is a conservative target where I often take partial profits and move my stop-loss to break-even.
- Target 2 (TP2): The 61.8% retracement of the AD leg. This is the most common primary target for the pattern.
- Stretch Target: For very strong reversals, some traders target point C or even a 127.2% extension of the AD leg, but it’s crucial to trail your stop-loss aggressively if aiming for these extended targets.
Psychology Behind Each Leg
To truly master the Gartley pattern, it helps to understand the market psychology driving its formation. Each leg represents a battle between bulls and bears, fueled by common human emotions.
- XA – Optimism/Pessimism: This is a strong, trending move. In a bullish pattern, it’s driven by strong buying optimism. In a bearish pattern, it’s fueled by fear and selling pressure. This sets the primary market direction.
- AB – Profit-Taking & Contrarian Entry: The first retracement is typically caused by early traders taking profits off the strong XA move. Contrarian traders also see this as a chance to fade the initial trend, causing the pullback to the 61.8% level.
- BC – Fear of Missing Out (FOMO): The trend resumes, but it’s weaker. Traders who missed the initial XA move jump in, fearing they’ll be left behind. However, this move lacks the conviction of the first leg and fails to make a new high (or low), stopping short of point A.
- CD – Exhaustion & Final Push: The last leg sees one final attempt to push the price. However, conviction is low, and the move extends to a point where the initial XA trend followers are exhausted. At point D (the 78.6% retracement), the market has stretched too far, and the conditions are ripe for a sharp reversal as smart money begins to enter in the opposite direction.
Common Mistakes & How to Avoid Them
Over the years, I’ve seen many traders fail with the Gartley pattern due to a few avoidable errors. Understanding these pitfalls is crucial for long-term success.
- Forcing the Ratios: The most common mistake is trying to make a pattern fit. If point B isn’t at 61.8% or D isn’t at 78.6% of XA, it’s *not* a Gartley. Don’t bend the rules. Move on and wait for a textbook setup.
- Ignoring Market Context: A perfect-looking bearish Gartley forming just before a major positive earnings announcement is a low-probability trade. Always be aware of the fundamental backdrop and high-impact news events.
- Trading Without Confirmation: Never enter a trade just because price has hit the PRZ. The market can and will push through these levels. Wait for a confirmation candle or indicator divergence to signal that the reversal has actually begun.
Pattern Invalidation Checklist
- Point B retraces more than 78.6% of XA.
- Point C moves beyond point A.
- Point D fails to reach the 78.6% retracement of XA.
- Price breaks beyond point X after the pattern completes.
Gartley vs. Other Harmonic Patterns
The Gartley is often called the “original” harmonic pattern, but it’s part of a larger family. Knowing the key differences helps you correctly identify the structure on your chart. The primary differentiator is the location of point B, which dictates the pattern type and the subsequent PRZ at point D. Here’s a quick comparison.
| Pattern | Point B Retracement (of XA) | Point D Reversal Zone (of XA) | Key Characteristic |
| Gartley pattern | 0.618 | 0.786 | The most balanced and common pattern. |
| Bat Pattern | 0.382 – 0.500 | 0.886 | Requires less of a pullback to B, resulting in a deeper D point. |
| Butterfly Pattern | 0.786 | 1.272 – 1.618 (Extension) | Point D extends beyond the initial starting point X. |
| Crab Pattern | 0.382 – 0.618 | 1.618 (Extension) | A very stretched pattern with an extreme extension for point D. |
Back-Testing Results & Stats
While no pattern is foolproof, the Gartley pattern has demonstrated a historically positive success rate when its rules are strictly followed. Several independent studies and trading communities have back-tested the pattern across various markets.
Typical Win Rate: 60% – 70%
When all Fibonacci rules are met and trades are confirmed with additional signals (like RSI divergence or candlesticks), the Gartley pattern often produces a win rate in the 60% to 70% range. This, combined with a risk-to-reward ratio that is often greater than 1:2, makes it a statistically profitable strategy over the long term.
However, I strongly encourage you to conduct your own back-testing. Don’t take anyone’s word for it. Go through historical data on your preferred asset and timeframe. Manually identify valid Gartley patterns and record the outcomes. This will not only validate the strategy for you but also build the screen time and confidence needed to trade it effectively with real money. You can use a simple spreadsheet (CSV) to log your findings.
Is the Gartley Pattern For You?
The Gartley pattern is a fantastic tool, but it may not suit every trading style. It is most beneficial for:
- Swing Traders & Day Traders: The pattern works well on intermediate timeframes (like the 1-hour, 4-hour, and daily charts), making it ideal for traders who hold positions for several hours to several days.
- Price Action & Technical Traders: If you base your decisions on chart patterns, support/resistance, and Fibonacci levels, the Gartley will integrate seamlessly into your existing methodology.
- Patient & Disciplined Traders: The pattern requires waiting for precise setups to form. It is not a strategy for those seeking constant action.
You might want to skip using the Gartley pattern during times of extreme volatility, such as during a major news release (e.g., NFP or CPI), or in markets with very low liquidity where price movements can be erratic and unreliable.
Trade with an Edge at Opofinance
Leverage your pattern trading skills with Opofinance, an ASIC-regulated broker designed for modern traders. Gain access to a suite of powerful tools and platforms.
- Advanced Trading Platforms: Choose from MT4, MT5, cTrader, and the exclusive OpoTrade platform.
- Innovative AI Tools: Utilize our AI Market Analyzer, AI Coach, and AI Support to refine your strategy.
- Flexible Trading Options: Explore Social Trading and Prop Trading opportunities.
- Secure & Flexible Transactions: Enjoy safe and convenient deposits and withdrawals, including crypto payments with zero fees.
Start Trading with Opofinance Today
Conclusion
The Gartley pattern is more than just a shape on a chart; it is a comprehensive trading methodology rooted in market structure and human psychology. By mastering its strict Fibonacci ratios Gartley traders swear by, you can identify high-probability reversal zones with remarkable precision. Remember that success with the Gartley pattern hinges on patience to wait for valid setups, discipline to follow the rules for entry and risk management, and the wisdom to always seek confirmation before committing capital.
Disclaimer: Trading financial markets involves significant risk. The information provided in this article is for educational purposes only and should not be considered financial advice. Always conduct your own research and consider your risk tolerance before making any trading decisions.
What is the success rate of the Gartley pattern?
When all rules are strictly followed and trades are taken with confirmation, many back-testing studies show a success rate between 60% and 70%. However, performance can vary based on market conditions, the asset being traded, and the trader’s skill.
Can I use Gartley on crypto?
Yes, the Gartley pattern is highly effective in the cryptocurrency markets. Because crypto is traded by humans and algorithms reacting to price, the same psychological principles apply, making harmonic patterns like the Gartley a valuable tool for crypto traders.
Best timeframe for Gartley?
There is no single “best” timeframe. The pattern is fractal, meaning it appears on all timeframes. However, it is most commonly and reliably used by swing traders on the 1-hour, 4-hour, and daily charts, as these tend to filter out market noise.
What’s the most critical Fibonacci ratio in a Gartley?
The most critical measurement is the B point retracement, which must be at the 0.618 level of the XA leg. This rule is the primary qualifier for a valid Gartley pattern and distinguishes it from other harmonic patterns like the Bat or Crab.
Is the Gartley pattern a leading or lagging indicator?
The Gartley is a leading indicator. Unlike lagging indicators that confirm a trend after it has started (e.g., moving averages), the Gartley pattern projects a Potential Reversal Zone (PRZ) where a turn is likely to occur in the future.
Related Top-Ranking References:
- https://www.investopedia.com/terms/g/gartley.asp
- https://www.babypips.com/learn/forex/the-gartley-and-the-animals
- https://www.ig.com/en/trading-strategies/top-7-harmonic-patterns-every-trader-should-know-210608


