

Heikin Ashi, which translates to “average bar” in Japanese, is a powerful charting technique that smooths price action to provide a clearer view of market trends. Unlike standard candlesticks that use a direct open-high-low-close (OHLC), Heikin Ashi candles use a modified formula based on averaged price values. This filters out market noise, making it easier to identify the underlying trend direction and strength. This guide will break down what a Heikin Ashi chart is, how the formula works, its key differences from traditional candlesticks, and how to interpret its signals, helping you decide if it’s the right tool for your trading style with your preferred online forex broker.
Key Takeaways
- Trend Clarity: Heikin Ashi charts are designed to smooth out price data, which helps to filter market noise and make identifying the direction and strength of trends significantly easier.
- Averaged, Not Actual Price: The core distinction is that Heikin Ashi candles are calculated using averaged price data from the current and prior periods. They do not represent the exact open, high, low, and close prices of the asset.
- The Formula Matters: Each Heikin Ashi candle’s open, close, high, and low is derived from a specific mathematical formula, which creates its characteristic continuity and smooth appearance.
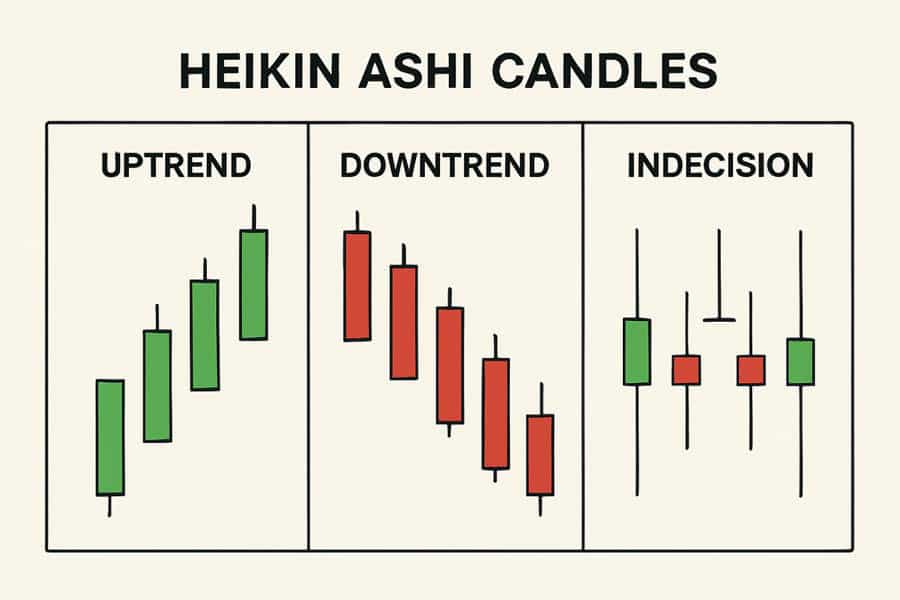
- Reading the Signals: Strong trends are identified by consecutive, same-colored candles with no shadows (or wicks) pointing against the trend. Small candle bodies with wicks on both sides signal potential indecision or a transition phase in the market.
- A Tool, Not a System: While powerful for trend visualization, Heikin Ashi has limitations, such as a lag in its signals due to its averaging nature. It should be used as an analytical tool, not a standalone trading system, and orders must be placed based on the actual market price, not the Heikin Ashi value.
What is Heikin Ashi?
As a trader who has spent countless hours staring at charts, I can tell you that one of the biggest challenges is cutting through the noise. Volatile markets create erratic price swings that can trigger false signals and lead to premature entries or exits. This is where the Heikin Ashi technique comes in. At its heart, it’s a different way of looking at the same price data. Its name, “average bar,” is the perfect description of its purpose: to average out price movements to present a cleaner, more readable picture of the market’s trend.
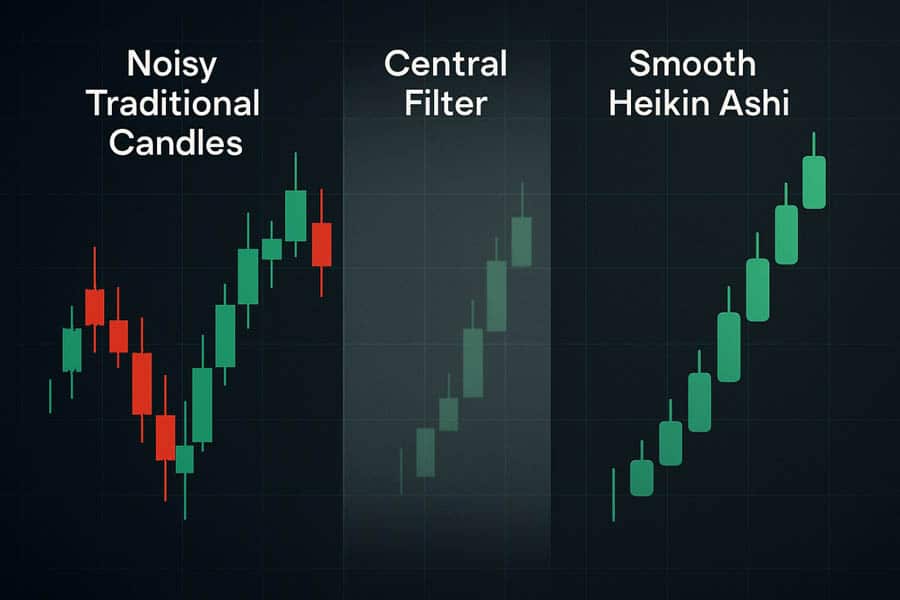
Think of it as a filter. A standard candlestick chart shows you the raw, unfiltered story of price in a given period. It’s precise but can be choppy and confusing. The Heikin Ashi chart, however, is like putting on noise-canceling headphones. It mutes the minor, insignificant fluctuations and allows you to focus on the dominant melody of the trend. This is achieved through a fundamental difference in its construction. Instead of each candle being an independent data point (Open, High, Low, Close), each Heikin Ashi candle is mathematically linked to the one before it. This dependency on the prior bar is the secret to its smoothness, creating a continuous flow that makes uptrends and downtrends stand out with remarkable clarity. For traders who find themselves constantly whipsawed by market volatility, understanding what is heikin ashi chart can be a game-changing revelation.
How Heikin Ashi Is Built
To truly appreciate why Heikin Ashi charts look the way they do, you have to understand what’s going on under the hood. It’s not magic; it’s math. Unlike a standard candle where the OHLC values are taken directly from the market, every part of a Heikin Ashi candle is a calculation. My own “aha!” moment with this technique came when I finally sat down and worked through the formulas myself. It was then I understood that the chart isn’t just showing me price; it’s telling me a story about momentum and continuity.
The Four Core Calculations
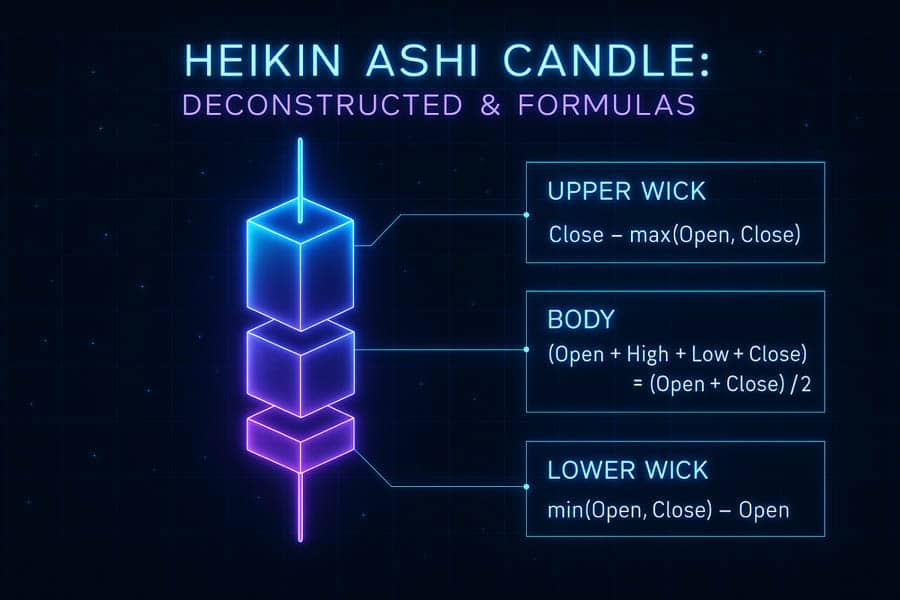
The construction of each Heikin Ashi candle is based on these four specific formulas:
- Heikin Ashi Open: (Open of Previous HA Bar + Close of Previous HA Bar) / 2
- Heikin Ashi Close: (Actual Open + Actual High + Actual Low + Actual Close) / 4
- Heikin Ashi High: The Maximum value of [Actual High, HA Open, HA Close]
- Heikin Ashi Low: The Minimum value of [Actual Low, HA Open, HA Close]
Right away, you can see the key difference. The heikin ashi formula for the open is the midpoint of the previous candle’s body. This is crucial. It’s the anchor that smooths the entire chart, forcing each new candle to originate from the center of the prior one, eliminating the gaps and sharp reversals you often see on standard charts. The close is an average of the current bar’s four main price points. The high and low are then determined by taking the most extreme value among the actual high/low and the calculated HA open/close.
Why It Creates Smoothing and Lag
This construction method has two profound effects. First, the continuity. By anchoring the open to the previous bar’s midpoint, the chart develops a flowing, trend-following appearance. Sharp, single-candle reversals are mathematically filtered out, which is why you see long, uninterrupted strings of green or red candles. The second effect is a slight delay, or calculation latency. Because the current Heikin Ashi candle’s calculation depends on the previous candle’s data, the chart is inherently reactive, not predictive. It will always be a step behind the live price. For a scalper, this might be a dealbreaker. But for a swing or position trader, this lag is often a blessing in disguise, as it prevents overreacting to minor noise and keeps you focused on the bigger picture.
Heikin Ashi vs Standard Candlesticks
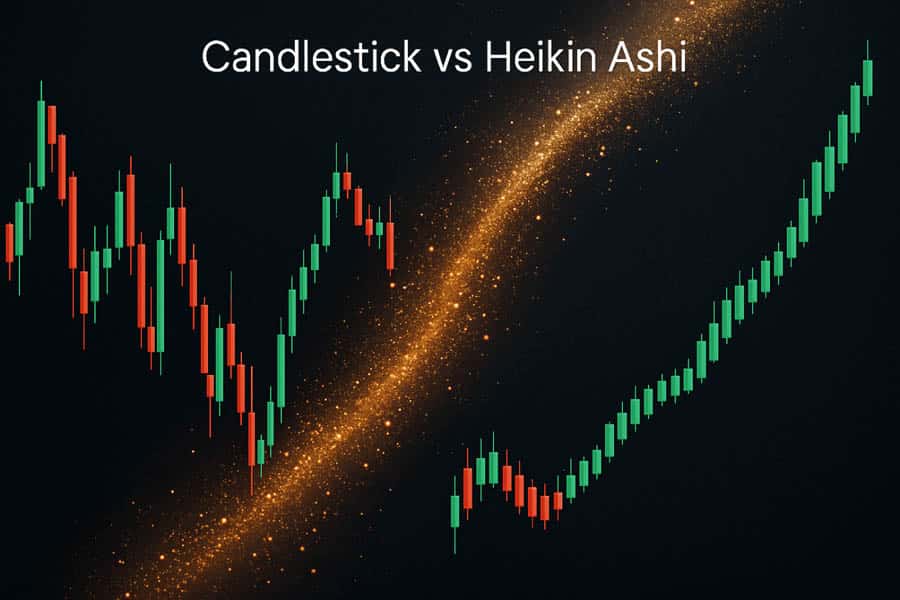
Placing a Heikin Ashi chart next to a standard candlestick chart of the same market and timeframe is one of the most illuminating exercises a trader can do. The difference is immediately obvious and speaks volumes about their respective strengths and weaknesses. It’s a classic trade-off between precision and clarity. My experience has taught me that neither is definitively “better”—they are simply different tools for different jobs. The real question is: what information are you trying to get from the chart?
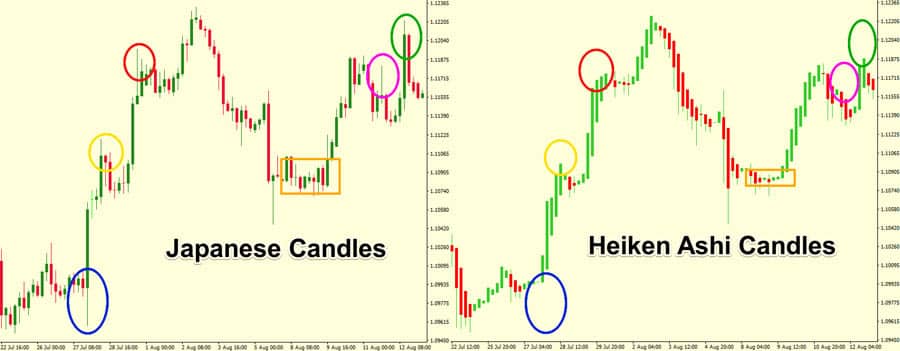
The standard candlestick chart gives you the unvarnished truth of the price. The top of the wick is the absolute high, the bottom is the absolute low, and the body shows the raw open-to-close battle between buyers and sellers for that session. It’s perfect for identifying specific price levels, support/resistance, and classic single-bar patterns. However, during choppy conditions, it can look like a mess of conflicting signals. This is the core of the heikin ashi vs candlestick debate. The Heikin Ashi chart willingly sacrifices this exact price representation for a smoothed, more directional view. It filters the noise to make the trend undeniable, but the values you see on a Heikin Ashi candle are not the actual prices at which you can place an order.
| Feature | Standard Candlesticks | Heikin Ashi Candlesticks |
| Price Representation | Displays the actual, raw Open, High, Low, and Close (OHLC) prices for the period. | Displays calculated, averaged values. Does not show the true market price. |
| Primary Purpose | To show the exact price action, volatility, and specific price levels. | To smooth price action and provide a clearer visualization of the underlying trend and its strength. |
| Visual Appearance | Can be choppy with frequent color changes and price gaps, reflecting market noise. | Smoother appearance with long, consecutive runs of same-colored candles and fewer gaps. |
| Signal Lag | Real-time signals. What you see is the current market price. | Inherent lag due to its averaging formula. Signals may appear delayed compared to candlesticks. |
| Best For | Price action trading, identifying exact support/resistance, scalping, and pattern recognition. | Trend following, filtering out market noise, and reducing false signals in volatile markets. |
How to Read Heikin Ashi Candles
Reading a Heikin Ashi chart is less about complex patterns and more about interpreting simple, powerful visual cues. It simplifies price action into a story of trend strength and potential turning points. After using these charts for years, I’ve learned to rely on three primary signals: the color, the body size, and the wicks (or shadows). These elements, when read together, provide a remarkably clear narrative of market sentiment.
Bullish and Bearish Series
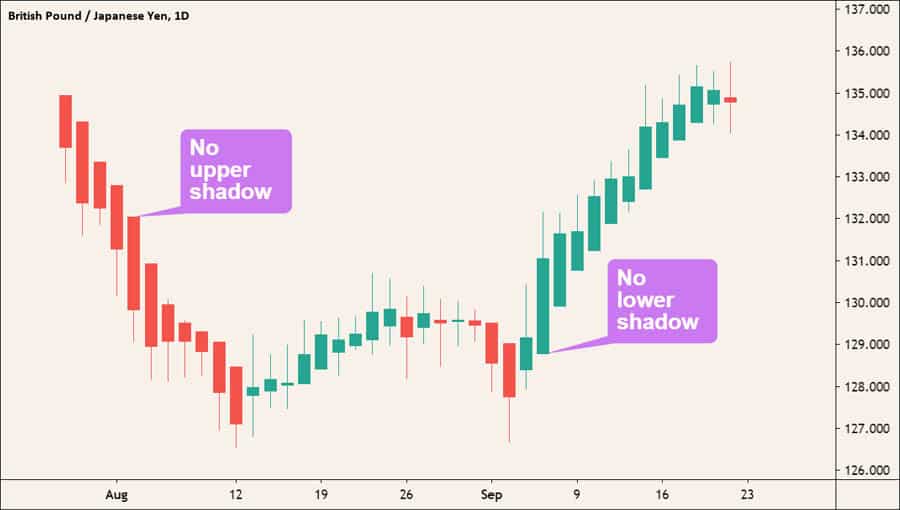
This is the most fundamental signal. A series of long, green (or bullish-colored) candles indicates a strong uptrend. What you’re specifically looking for are green candles with no lower shadows. The absence of a lower wick tells you that the price never dipped below the midpoint of the previous candle, indicating consistent and powerful buying pressure. Conversely, a series of long, red (or bearish-colored) candles with no upper shadows signals a strong, dominant downtrend. This means sellers are in complete control, and the price hasn’t had the strength to rally above the previous candle’s midpoint. As a trend-follower, seeing these “shaved” candles is one of the most reassuring signals you can get.
Indecision and Transition Candles
When the market starts to lose momentum, the appearance of the Heikin Ashi candles changes dramatically. You’ll start to see candles with smaller bodies and wicks appearing on both sides. This is a clear sign of indecision. The buyers and sellers are reaching an equilibrium, and the strong directional momentum is fading. I’ve found these to be invaluable early warnings. When a strong uptrend starts producing candles with small bodies and lower wicks, it’s a heads-up that the trend might be pausing or preparing to reverse. Similarly, in a downtrend, the appearance of upper wicks on red candles suggests that buying pressure is starting to creep back in.
Doji-Style Candles as Reversal Clues
A doji-like candle on a Heikin Ashi chart—a candle with a very small or non-existent body but long upper and lower wicks—is a powerful signal of potential change. It represents a moment of pure standoff between bulls and bears. While a single doji isn’t a definitive command to reverse your position, it is a non-negotiable signal to pay close attention. In my experience, seeing a doji after a long, sustained trend is the market’s way of tapping you on the shoulder and telling you that the character of the trend is changing. It’s a time to tighten stops, take partial profits, or wait for confirmation of the next move.
Chart Behavior and Smoothing Effects
The primary benefit that draws traders to Heikin Ashi is its remarkable ability to reduce noise and clarify trend continuity. This “smoothing effect” isn’t just a cosmetic feature; it has profound psychological and analytical benefits. By averaging out the price data, the chart filters away the minor, jerky movements that can cause so much confusion and second-guessing on a standard candlestick chart.
In a volatile market, a standard chart might show a series of alternating red and green candles, even within a clear overall uptrend. This visual “noise” can be unnerving and might tempt a trader to exit a perfectly good position too early. The Heikin Ashi chart, by its very nature, will often remain steadfastly green during such periods, reflecting the dominant upward pressure and helping the trader to stay in the trade with more confidence. However, this clarity comes at a cost: a trade-off between delayed signals and visual simplicity. Because the calculations are based on past data, a major trend reversal will show up on a Heikin Ashi chart later than on a standard candlestick chart. An entry signal might come after a significant portion of the initial move has already occurred, and an exit signal might cause you to give back some profit. This is the fundamental compromise of the Heikin Ashi technique. It helps you catch the main body of a trend but often misses the exact top or bottom. For many, avoiding the stress of noise is well worth this price.
Heikin Ashi on Popular Platforms
One of the best things about the Heikin Ashi technique is its widespread availability. You don’t need niche software or a custom-coded indicator to use it. Virtually all modern charting platforms and brokers, including the immensely popular TradingView, offer Heikin Ashi as a standard chart type. Enabling it is usually as simple as clicking on the chart style menu and selecting it from the list.
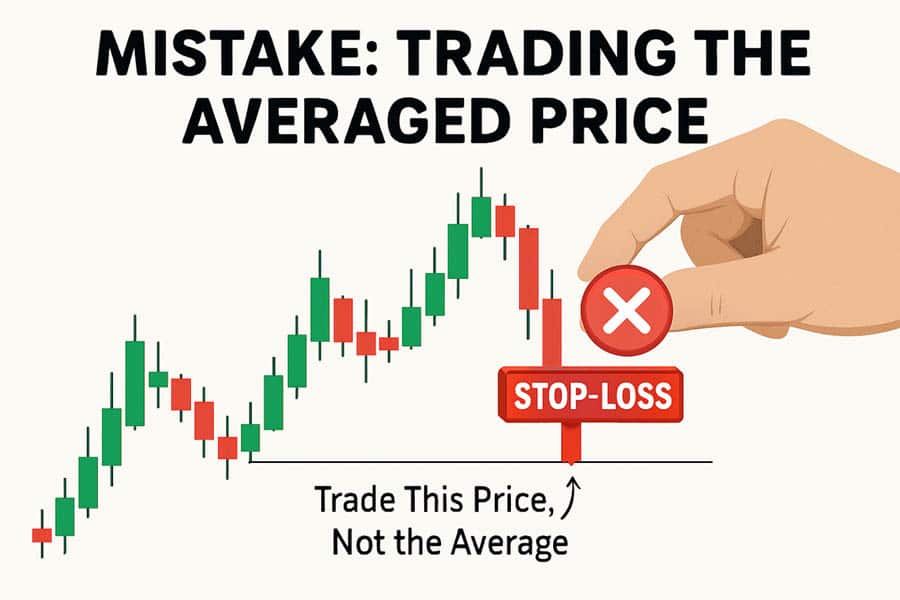
A crucial point to understand, especially on a platform like TradingView, is how the price axis is displayed. When you switch to a Heikin Ashi chart, you’ll often see two different price values on the right-side scale. One is the current, actual price of the asset, often represented by a thin line or a label. The other is the closing price of the current, still-forming Heikin Ashi candle. It is absolutely vital to recognize that these are two different things. The Heikin Ashi price is a calculated value; the actual price is the live, tradable rate. I’ve seen novice traders make the painful mistake of trying to set an order based on the Heikin Ashi price, only to realize their order never fills because the real market never traded at that level. Always use the actual market price for your execution and risk management.
Common Reading Mistakes to Avoid
While Heikin Ashi simplifies trend analysis, its unique construction can lead to some common and costly misunderstandings if you’re not careful. From my own journey and from observing others, a few key pitfalls stand out. Avoiding these mistakes is crucial to using the tool effectively.
Treating HA Prices as Real Market Prices
This is, without a doubt, the most critical error. The price you see on a Heikin Ashi candle is an averaged, synthetic value. It is not the actual price at which the asset is trading. When you place a market order, a stop-loss, or a take-profit, your broker executes it based on the real bid/ask spread in the market, not the smoothed value on your Heikin Ashi chart. Always, always have the actual price line visible on your chart for order placement and risk management. The Heikin Ashi is for analysis, not execution.
Misinterpreting the Highs and Lows
Remember the heikin ashi formula for the high and low? The HA High is the maximum of the actual high, the HA open, and the HA close. This means the top of a Heikin Ashi wick does not always represent the true high of that trading session. The actual price may have wicked significantly higher, but if the HA open and close were lower, that extreme may not be fully reflected. This is part of the smoothing process, but it can be misleading if you’re using exact highs and lows to identify breakout levels or place stop orders. The same logic applies to the lows.
Ignoring Context like Wicks and Body Size
A third mistake is reading the chart based on color alone. Seeing a green candle is bullish, yes, but its context is everything. Is it a long, powerful candle with no lower wick, continuing a strong trend? Or is it a small-bodied candle with long wicks on both sides that just happens to be green, appearing after a long run-up? The latter is a sign of weakness and indecision, not strength. The story of Heikin Ashi is told through the combination of color, body size, and wicks. Ignoring any one of these elements is like reading only every third word in a sentence—you’ll miss the real meaning.
Strengths and Limitations
No tool in a trader’s arsenal is perfect, and Heikin Ashi is no exception. Acknowledging its strengths while respecting its limitations is the key to incorporating it successfully into your analysis. I view it as a specialized lens: it brings certain things into sharp focus while intentionally blurring others.
Strengths: Clarity and Composure
- Unmatched Trend Clarity: Its primary strength is its ability to smooth out volatile price action, making uptrends, downtrends, and consolidation phases visually distinct and easy to follow.
- Reduced False Signals: By filtering out minor counter-trend movements, it helps traders avoid getting shaken out of good positions by market noise, especially on lower timeframes.
- Improved Psychological Discipline: The smooth, flowing nature of the chart can have a calming effect, promoting patience and helping traders stick with a trend instead of over-trading.
Limitations: Lag and Imprecision
- Lagging Nature: The averaging formula means that signals—entries, exits, and reversals—are inherently delayed compared to raw price action. It is a reactive, not predictive, tool.
- Not for Precise Execution: As stressed before, the chart does not show actual market prices. It’s unsuitable for strategies that rely on exact price levels, such as scalping or tight range trading.
- Can Obscure Key Price Data: The smoothing can hide important price action details, like gaps and precise support/resistance levels, that are clearly visible on a standard candlestick chart. It should be used in conjunction with, not as a complete replacement for, other forms of analysis.
Glossary and Quick Reference
To help solidify your understanding of the what is heikin ashi chart, here’s a quick reference guide to its key components and formulas. Keeping these simple definitions in mind will help you interpret the charts quickly and accurately.
Key Terms
- Body: The part of the candle between the Heikin Ashi Open and Close. Its color indicates the trend’s direction (e.g., green for up, red for down).
- Wick (or Shadow): The lines extending above and below the body, representing the calculated Heikin Ashi High and Low.
- Color Sequence: A series of consecutive candles of the same color, indicating a sustained trend.
- “No-Shadow” Bar: A bullish (green) candle with no lower wick or a bearish (red) candle with no upper wick. This is a sign of a very strong, dominant trend.
- Doji-like Bar: A candle with a very small or flat body and wicks on both sides, signaling market indecision and a potential turning point.
Formula Cheat Sheet
- Open: (Previous HA Open + Previous HA Close) / 2
- Close: (Actual O + H + L + C) / 4
- High: Max of [Actual High, HA Open, HA Close]
- Low: Min of [Actual Low, HA Open, HA Close]
Experience Superior Trading with Opofinance
Elevate your tr
ading journey with Opofinance, an ASIC-regulated broker dedicated to providing a secure and advanced trading environment. Benefit from a suite of powerful tools and features designed for the modern trader.
- Advanced Trading Platforms: Choose from industry-leading platforms including MT4, MT5, cTrader, and the intuitive OpoTrade.
- Innovative AI Tools: Gain a competitive edge with our AI Market Analyzer, AI Coach, and instant AI Support.
- Flexible Trading Options: Explore Social & Prop Trading opportunities to diversify your strategies.
- Secure & Convenient Transactions: Enjoy seamless, secure deposits and withdrawals, including crypto payments with zero fees.
Join Opofinance today and transform your trading experience!
Conclusion
The Heikin Ashi chart is an invaluable tool for any trader who values trend clarity over raw price precision. By averaging price data, it masterfully filters out market noise, allowing for a calmer, more disciplined approach to trend following. Understanding the heikin ashi formula and the nuances of the heikin ashi vs candlestick debate is essential. While its inherent lag and lack of exact price data make it unsuitable for some strategies, its ability to clearly delineate trend strength and direction makes it a powerful addition to any analytical toolkit.
Is Heikin Ashi better than Renko charts?
Neither is “better”; they serve different purposes. Heikin Ashi smooths price within time-based bars, making trends clearer. Renko charts ignore time completely and only draw new bricks when price moves a specific amount, focusing purely on price movement magnitude.
Can you use moving averages with Heikin Ashi?
Yes, combining moving averages with Heikin Ashi is a very popular technique. The smoothed nature of the Heikin Ashi candles can lead to cleaner crossovers and a clearer relationship between price and the average, further confirming trend direction.
Does Heikin Ashi work in all timeframes?
Yes, it can be applied to any timeframe, from one-minute charts to weekly charts. However, its noise-filtering properties are often most beneficial on lower, more volatile timeframes where erratic price action is common.
How do you spot a trend getting weaker with Heikin Ashi?
A weakening trend is typically signaled by two things: the candle bodies getting smaller and the appearance of shadows (wicks) against the primary trend. For example, in an uptrend, the emergence of lower wicks on green candles is an early warning sign.
Why does the Heikin Ashi chart look different from my broker’s price?
The Heikin Ashi chart displays calculated, averaged prices, not the live, tradable price. Your broker’s price feed shows the actual bid/ask where trades are executed. This is a critical distinction for placing orders and managing risk.


