

The best Heikin Ashi strategy is a simple, trend-following system that enters on a candle color change confirmed by a momentum indicator like the RSI, MACD, or a moving average. This approach excels at filtering out market noise, allowing traders to stay in profitable trends longer. To succeed, you need a clear trading plan with precise entry and exit rules, robust risk management, and an understanding of the best markets and timeframes. As an experienced trader using a top-tier online forex broker, I’ve found that a well-defined Heikin Ashi trading strategy is a game-changer for clarity and discipline. This guide will cover everything from reading the candles to deploying five distinct, data-backed strategies.
Key Takeaways
- Core Concept: Heikin Ashi charts smooth out price action, making it easier to identify and follow market trends by averaging price data.
- Primary Strategy: The most effective Heikin Ashi strategy involves entering a trade on a candle color flip that aligns with the dominant trend, confirmed by an indicator like an EMA, Supertrend, or MACD.
- Confirmation is Key: Never use Heikin Ashi in isolation. Its inherent lag means you need confirmation from other tools (like RSI for momentum) to avoid false signals and late entries, especially in ranging markets.
- Risk Management First: Set stops based on actual price swing lows/highs, not just Heikin Ashi levels. Risk a small percentage of your capital (0.5-1.5%) per trade to mitigate drawdowns.
- Optimal Conditions: This technique performs best on higher timeframes (4-hour, daily) and in markets known for clean trends, such as major forex pairs, stock indices, and large-cap cryptocurrencies.
- Backtested Reality: Data shows a simple Heikin Ashi strategy on its own can reduce drawdowns significantly compared to a buy-and-hold approach, but may yield lower absolute returns. Filters and active management are crucial for enhancing performance.
Heikin Ashi Strategy: What Works Now
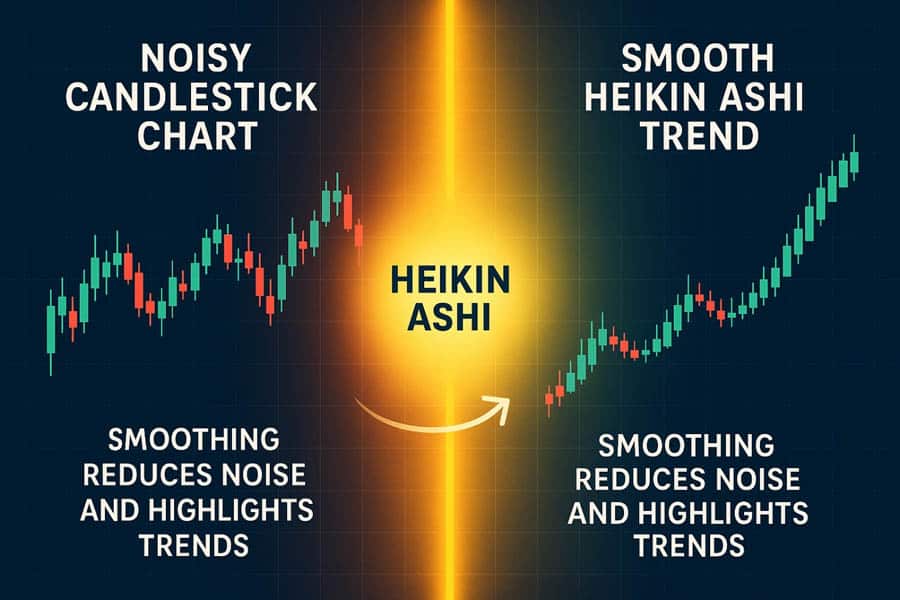
In today’s volatile markets, traders are constantly searching for an edge—a way to cut through the noise and see the real story the market is telling. This is where the Heikin Ashi technique shines. At its heart, Heikin Ashi (Japanese for “average bar”) is a chart visualization method that re-calculates candlestick values to create a smoother, more readable chart. It excels at one thing above all else: trend identification. Unlike standard candlesticks that can whip you in and out of positions with volatile spikes, Heikin Ashi paints a clearer picture of trend strength and direction. However, this smoothing comes with a trade-off: lag. Because it’s based on averages, it reacts slower than raw price. The most effective Heikin Ashi Strategy acknowledges this reality. It doesn’t rely on the candles alone but pairs them with a confirmation filter—like a moving average or a momentum oscillator—to reduce whipsaws and validate signals, ensuring you’re trading with the market’s true momentum.
Quick Rules: Entry And Exit
A successful trading system is built on clear, unambiguous rules. A core heikin ashi trading strategy provides exactly that. The rules are beautifully simple, removing guesswork and emotional decision-making from the process. Here is the foundational framework I’ve refined over years of trading.
Long Entry/Exit
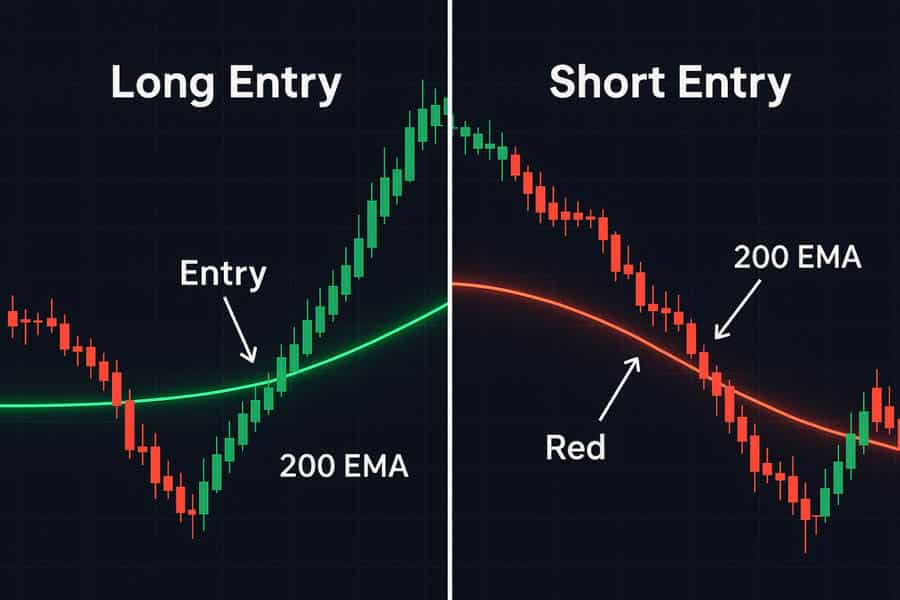
- Entry: Enter a long position on the first green Heikin Ashi candle following a series of red candles. Crucially, this signal must be confirmed by a bullish filter, such as the price being above the 200-period EMA or the MACD crossing bullishly.
- Exit: Exit the long position on the first red candle. Alternatively, for a more conservative exit, you can close the trade on an indecision candle (a small body with long upper and lower wicks), which often signals that momentum is waning.
Short Entry/Exit
- Entry: Enter a short position on the first red Heikin Ashi candle following a series of green candles. This signal must be confirmed by a bearish filter, like the price being below the 200 EMA or a bearish Supertrend signal.
- Exit: Exit the short position on the first green candle or on a clear indecision candle.
Best Timeframes And Markets

Not all markets and timeframes are created equal, and this is especially true for a Heikin Ashi Strategy. The technique’s strength in trend-following means it thrives in certain environments and struggles in others. From my experience, the key is to align your strategy with the chart’s “personality.” Higher timeframes, like the 4-hour (H4), Daily (D1), and Weekly (W1), are the sweet spot. They naturally filter out the intraday noise that can trigger false signals on lower timeframes. On these charts, trends are more established and sustained, allowing the Heikin Ashi smoothing effect to work its magic. For scalpers using 1-minute or 5-minute charts, the noise can be overwhelming, making strong filters an absolute necessity. Regarding markets, instruments that trend cleanly are your best bet. This includes major forex pairs (like EUR/USD, GBP/USD), major stock indices (S&P 500, NASDAQ), and large-cap cryptocurrencies (Bitcoin, Ethereum), which tend to have enough liquidity and participation to form sustained moves.
Pros And Cons (Reality Check)
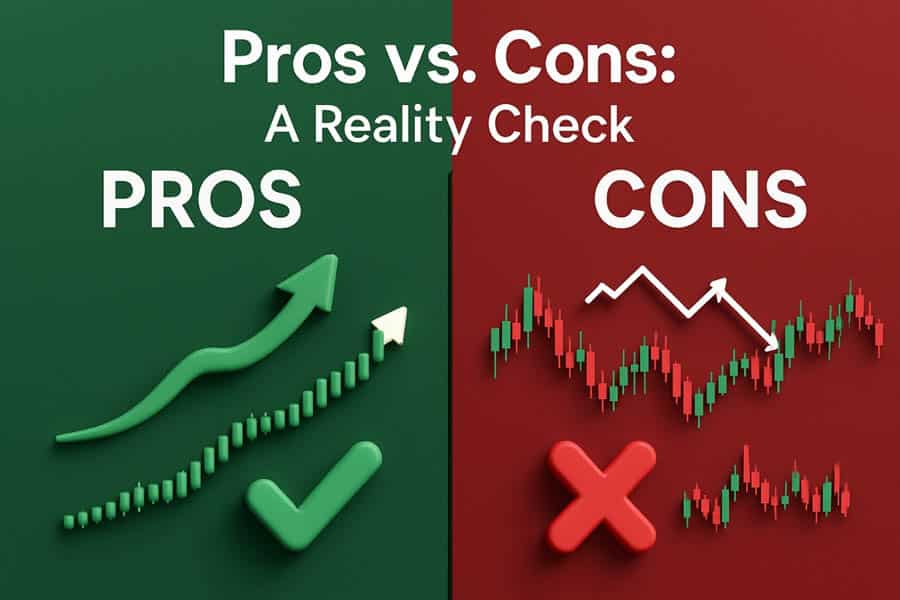
Every tool in a trader’s arsenal has its strengths and weaknesses, and Heikin Ashi is no exception. It’s crucial to have a realistic understanding of what it can and cannot do before you risk a single dollar. Ignoring its limitations is a recipe for frustration.
The Pros: Why Traders Love It
- Smoother Trends: The averaging formula filters out minor corrections and market noise, producing a chart that is visually cleaner and makes trends much easier to spot and follow.
- Reduced Decision Fatigue: By presenting a clearer picture, Heikin Ashi reduces the mental stress of analyzing volatile price action. The simple color-coded system helps you stay in winning trades longer without getting scared out by minor pullbacks.
- Clarity on Trend Strength: A series of tall, green candles with no lower wicks signals powerful upward momentum. Conversely, strong red candles with no upper wicks indicate a powerful downtrend. This visual cue is incredibly intuitive.
The Cons: Where It Falls Short
- Inherent Lag: The biggest drawback. Because it averages price, Heikin Ashi is always slightly behind the actual market price. This can lead to later entries and exits compared to standard candlesticks.
– False Reversals in Ranging Markets: In a sideways or choppy market, the color flips can occur frequently, generating a series of false signals (whipsaws) that can quickly deplete your account. This is why a trend filter is non-negotiable.
- Obscures Actual Price Levels: The Heikin Ashi candle’s open and close are not the true open and close of the trading period. This makes setting precise stop-losses and take-profits based on the candles themselves unreliable. You must always reference a standard price chart for these critical levels.
Read Heikin Ashi Candles Fast
Learning to read Heikin Ashi candles is like learning a new visual language for the market—one that speaks in trends, not noise. It’s simpler than standard candlesticks and can be mastered quickly. Once you know what to look for, you can assess the market’s health in a single glance. Here’s a quick guide to interpreting the three main candle types you’ll encounter.
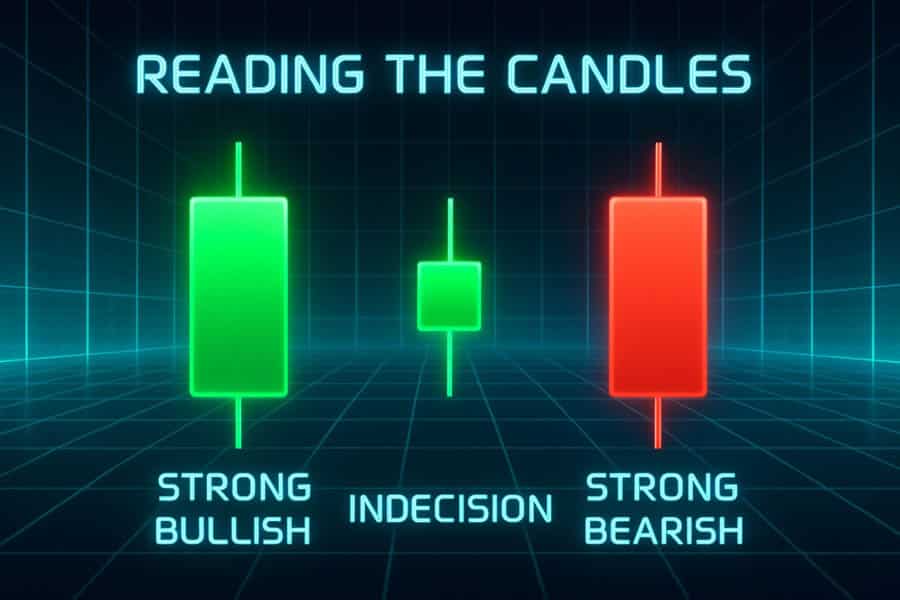
Strong Trend (Continuation)
- Bullish: A green candle with a full body and an upper wick, but no lower wick. This is a sign of strong, confident buying pressure. When you see a series of these, the uptrend is healthy and likely to continue.
- Bearish: A red candle with a full body and a lower wick, but no upper wick. This indicates intense selling pressure. A sequence of these signals a strong, sustained downtrend.
Indecision or Pause
- Small Body, Both Wicks: A candle with a small body (either green or red) and both an upper and lower wick is a classic sign of indecision. The market is pausing. Neither buyers nor sellers are in control. This candle often appears before a potential reversal or the start of a ranging period. It’s a warning sign to tighten stops or consider taking profits.
Potential Reversal
- Color Flip: The most basic signal is a change in color. A red candle appearing after a long string of green candles suggests the uptrend might be over. Conversely, a green candle after a series of red candles signals a potential bottom. This is the foundational signal for any Heikin Ashi Strategy, but remember, it demands confirmation.
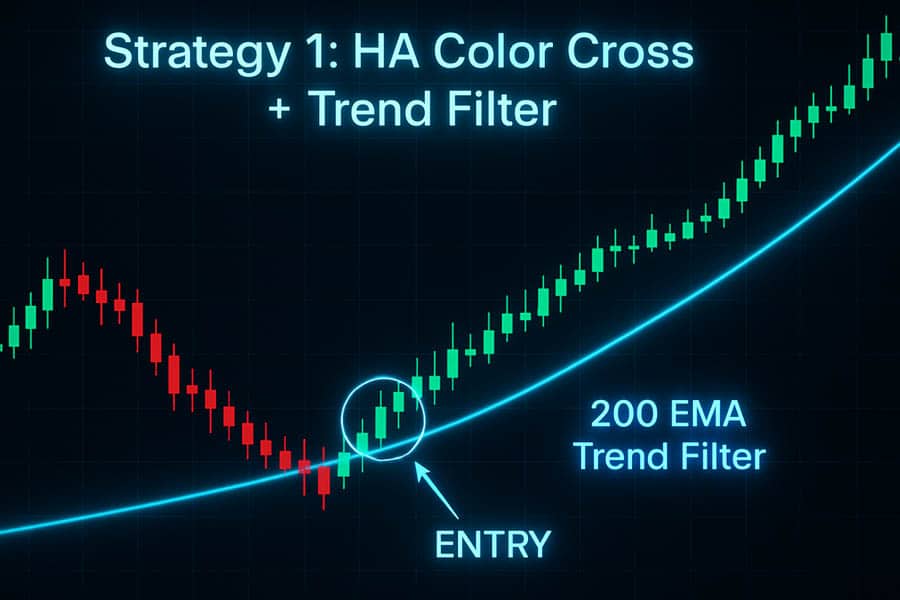
Strategy 1: HA Color Cross + Trend Filter
This is the foundational heikin ashi trading strategy, a simple yet robust method that combines the clarity of Heikin Ashi with the context of a long-term trend filter. The goal is to ensure you only take trades in the direction of the prevailing market tide. The most common and reliable filters are the 200-period Exponential Moving Average (EMA) or the Supertrend indicator. The rule is simple: only take long trades when the price is above the 200 EMA and only short trades when it’s below. This single condition dramatically improves the probability of your trades by filtering out weak, counter-trend signals.
Rule Set
- Long Entry: Wait for the first green Heikin Ashi candle to close after a pullback. The entry is only valid if the price is trading above the 200 EMA (or the Supertrend indicator is green/bullish).
- Short Entry: Wait for the first red Heikin Ashi candle to close after a rally. This signal is only valid if the price is trading below the 200 EMA (or the Supertrend is red/bearish).
- Stop-Loss: Place your stop-loss just below the most recent swing low (for longs) or above the most recent swing high (for shorts) on the standard price chart.
- Profit Target: You can take partial profits as the trend progresses, especially as long as the candles show no lower wicks (for longs) or no upper wicks (for shorts). A common exit is the first candle of the opposite color.
Strategy 2: HA + RSI Momentum Align
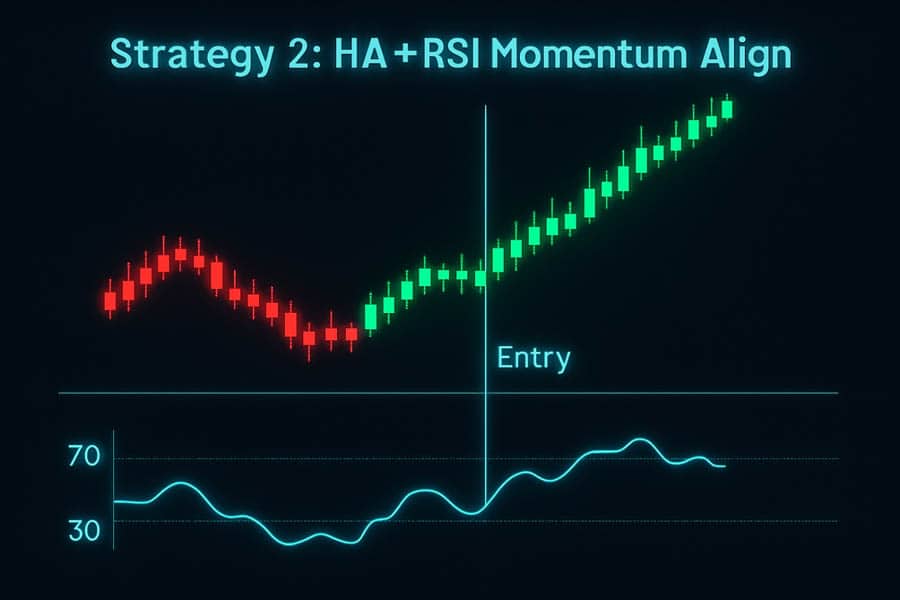
While the first strategy confirms the trend, this one adds a layer of momentum analysis using the Relative Strength Index (RSI). The RSI helps us identify when a market is “overbought” or “oversold,” providing a powerful edge in timing entries. A common mistake traders make is buying an asset just because it’s going up. This heikin ashi with rsi strategy prevents that by ensuring you buy into strength after a period of exhaustion. It’s about entering a new trend wave as it begins, not chasing the tail end of an old one. This approach improves entry timing and helps you avoid getting caught in reversals.
Rule Set
- Long Entry: Look for the RSI to dip into the oversold territory (below 30). Wait for the RSI to cross back above 30, and then enter on the first green Heikin Ashi candle that forms. This confirms that momentum is shifting back to the upside.
- Short Entry: Look for the RSI to enter the overbought territory (above 70). Wait for it to cross back below 70, and then enter on the first red Heikin Ashi candle.
- Exit Signal: The RSI can also provide early exit warnings. If you are in a long trade and see a bearish divergence (price makes a higher high, but the RSI makes a lower high), it’s a strong signal that the trend is losing momentum and it’s time to tighten your stop or exit.
Strategy 3: HA + MACD Trend Confirm
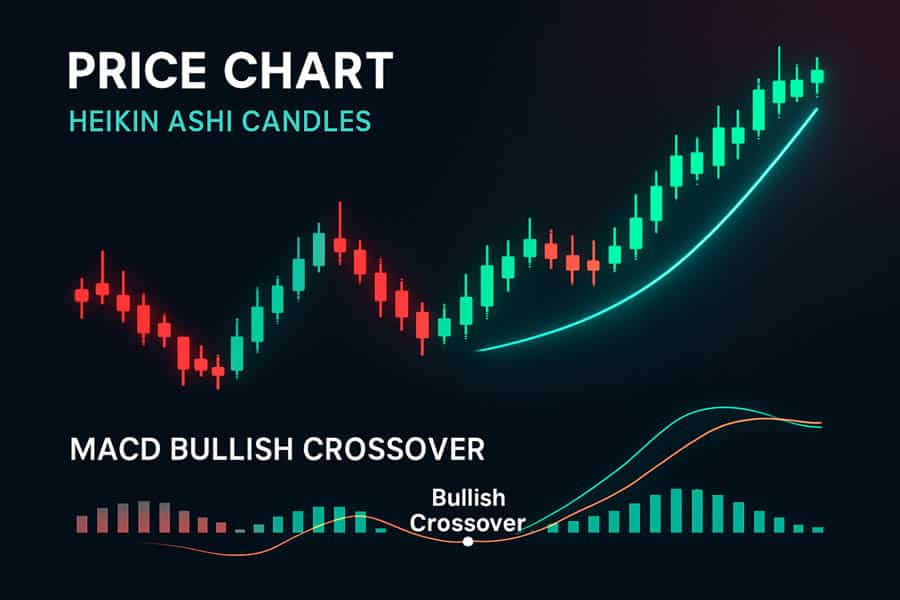
The Moving Average Convergence Divergence (MACD) is another classic momentum indicator that pairs exceptionally well with Heikin Ashi. While the RSI is great for overbought/oversold levels, the MACD excels at confirming trend direction and momentum through its crossovers and histogram. This Heikin Ashi Strategy uses the MACD as a secondary confirmation tool to validate the color flips, adding another layer of confidence to your trades. The MACD histogram, in particular, is a fantastic visual tool for gauging whether bullish or bearish momentum is strengthening or weakening.
Rule Set
- Long Entry: Enter on a green Heikin Ashi candle only if it’s accompanied by a bullish MACD crossover (the MACD line crosses above the signal line) and the MACD histogram is positive and ideally rising.
- Short Entry: Enter on a red Heikin Ashi candle only when there is a bearish MACD crossover (the MACD line crosses below the signal line) and the histogram is negative and ideally falling.
- Filter: Avoid taking trades when the MACD lines are flat and tangled together, as this indicates a weak, directionless market. You want to see clear separation and a decisive crossover angle. The exit is triggered by a Heikin Ashi color flip or a bearish MACD crossover.
Strategy 4: HA + EMA 9/200 Filter
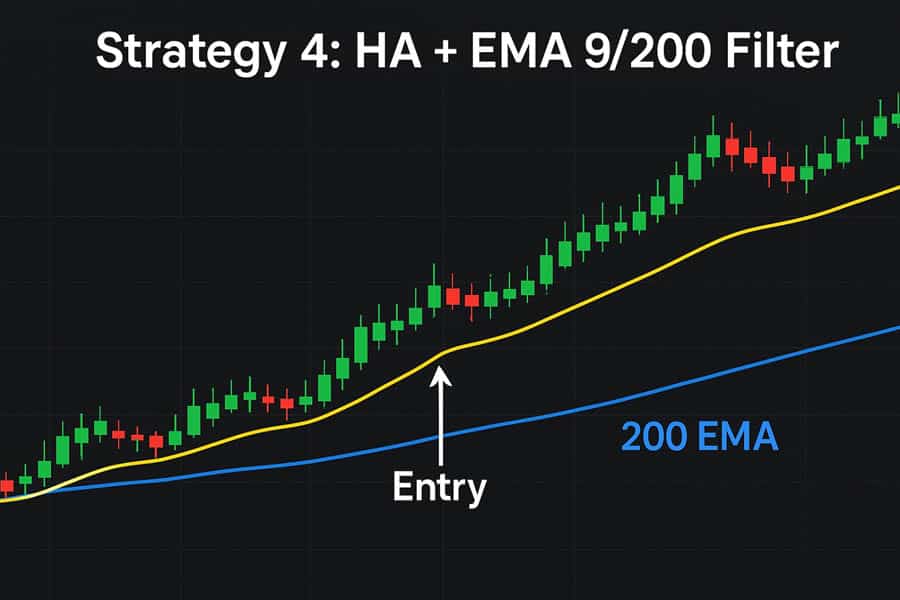
This dynamic Heikin Ashi Strategy uses two Exponential Moving Averages (EMAs) to create a comprehensive trading system. The 200 EMA acts as our long-term trend filter (the “tide”), while the 9 EMA serves as a short-term momentum guide (the “wave”). By combining these with Heikin Ashi candles, we can pinpoint high-probability entries where short-term momentum aligns with the long-term trend. It’s a classic setup that has remained popular for a reason: it’s effective, visual, and helps traders stay on the right side of the market. The key is to wait for the Heikin Ashi candle to confirm what the EMAs are already telling you.
Rule Set
- Long Entry: The 200 EMA must be angling upwards, with the price trading above it. Wait for a pullback towards the 9 EMA. Enter long when a green Heikin Ashi candle closes above the 9 EMA. This confluence—long-term trend up, short-term momentum turning bullish—is a powerful signal.
- Short Entry: The 200 EMA must be angling downwards, with the price below it. Wait for a rally towards the 9 EMA. Enter short when a red Heikin Ashi candle closes below the 9 EMA.
- Context: This strategy works exceptionally well when these signals occur near known support or resistance zones, adding even more weight to the trade setup.
Strategy 5: HA + Supertrend Trail
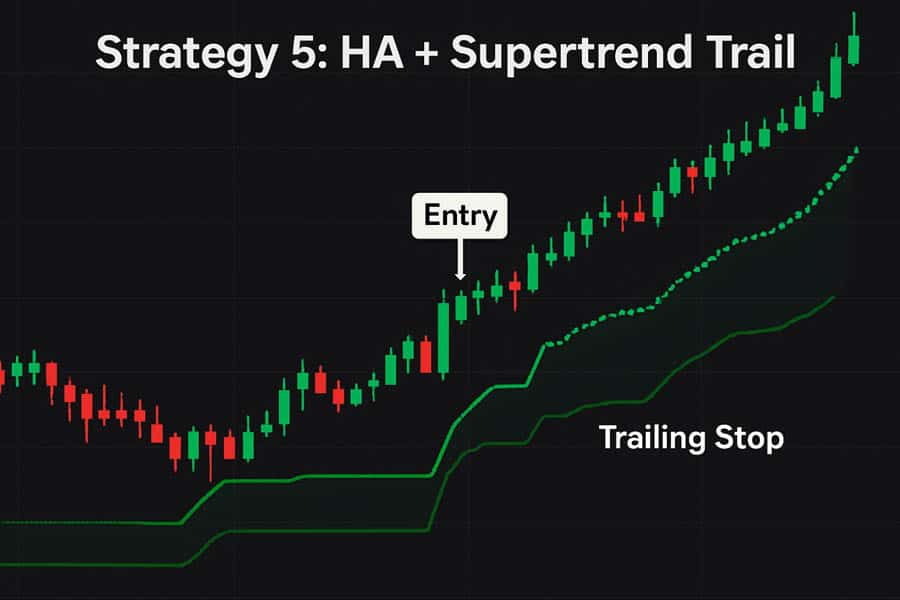
For traders who love to catch and ride long, powerful trends, the combination of Heikin Ashi and the Supertrend indicator is a match made in heaven. The Supertrend indicator is brilliant at both identifying the trend and providing a dynamic, trailing stop-loss. This heikin ashi trading strategy is designed to maximize profits from a trend by keeping you in the trade as long as the trend is valid. The Supertrend line acts as a clear “line in the sand”; as long as the price stays on one side, the trend is intact. The Heikin Ashi candles help you manage the trade and even add to your position (pyramiding) during periods of strong momentum.
Rule Set
- Entry: Enter a long trade when the Supertrend indicator flips to a buy signal (usually turning green and appearing below the price) and this is confirmed by the formation of a green Heikin Ashi candle. The opposite is true for short trades (red Supertrend, red HA candle).
- Trade Management: Stay in the trade as long as the Heikin Ashi candles remain green (for longs) and the Supertrend remains in buy mode. During periods of very strong trend (green candles with no lower wicks), you can consider adding to your position.
- Exit: Exit the trade when either the Heikin Ashi candle closes red (signaling a potential momentum shift) or the Supertrend indicator flips to a sell signal. The Supertrend flip is a more definitive exit that confirms a trend change.
Scalping Vs Swing With HA
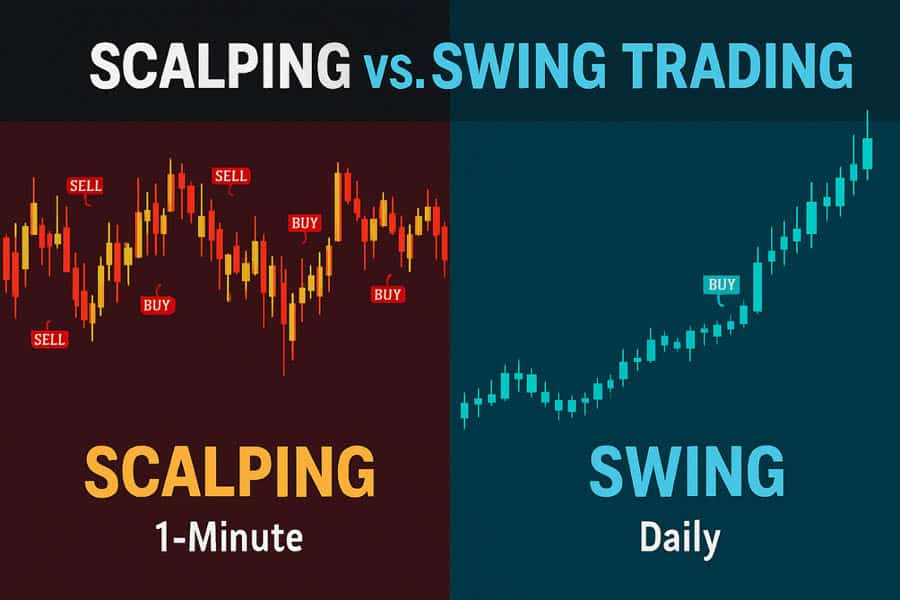
The versatility of Heikin Ashi allows it to be adapted to different trading styles, from rapid-fire scalping to patient swing trading. However, the application and rules must be adjusted to fit the timeframe. What works on a daily chart will lead to disaster on a 1-minute chart if not handled correctly. My experience has taught me that success depends on respecting the level of market noise inherent in your chosen timeframe.
Scalping (1-5 Minute Charts)
Scalping with Heikin Ashi is a high-octane endeavor. The primary challenge is the sheer volume of noise and false signals. To succeed, you need extremely fast filters and a disciplined exit strategy. A very short-term moving average (like a 5 or 9 EMA) is essential. Your exit rule must be strict: the moment an indecision candle with two wicks appears, the trade is often over. Profit targets are small, and you must be content with capturing quick, small moves during high-volume market sessions.
Swing Trading (H4-D1 Charts)
This is where the heikin ashi candle strategy truly excels. On the 4-hour and daily charts, market noise is significantly reduced. Here, you can pair Heikin Ashi with a slower filter like the 200 EMA to establish the primary trend. Entries are taken on color flips that occur at significant market structure levels, such as major support/resistance or after a bounce off a trendline. This patient approach leads to less overtrading and allows you to capture much larger, more significant market moves.
Wick Traps And Fakeouts
One of the more advanced skills in using a Heikin Ashi Strategy is learning to read the wicks, especially around key market levels. Wicks tell a story of buying and selling pressure and can provide crucial clues about potential traps and fake breakouts. A “fakeout” occurs when the price appears to break through a key level, only to reverse sharply, trapping traders who entered on the breakout. Heikin Ashi wicks can help you avoid this. For instance, if you see a long upper wick pushing into a major resistance level, followed by a small body, it’s a red flag. It shows that buyers tried to push the price higher but were aggressively rejected by sellers. Instead of jumping into a breakout, a savvy trader waits for confirmation—often a second candle that closes decisively beyond the level—before committing to the trade.
Risk Controls That Matter
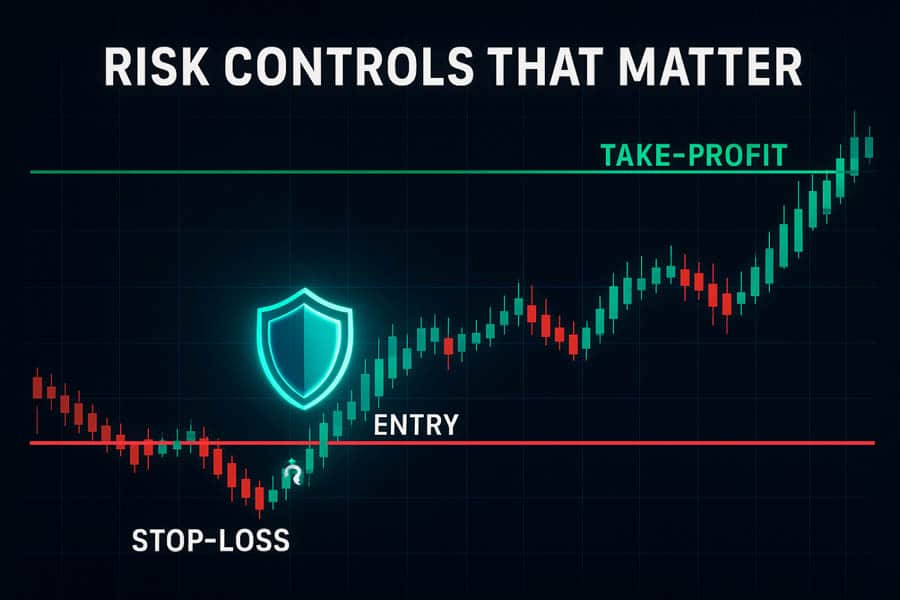
No trading strategy, no matter how effective, will be profitable in the long run without disciplined risk management. This is the bedrock of a professional trading career. Because a heikin ashi trading strategy has an inherent lag, your risk controls must be anchored to the actual market price, not the smoothed Heikin Ashi values. This is a critical distinction that many new traders miss. A professional approach involves setting a fixed risk percentage per trade, typically between 0.5% and 1.5% of your total account equity. This ensures that a string of losses will not cripple your account. Furthermore, after your trade has moved in your favor by a certain amount (e.g., a 1:1 risk/reward ratio), move your stop-loss to breakeven. This turns it into a “risk-free” trade, allowing you to ride the rest of the trend with less stress.
Instruments And Volatility Notes
The effectiveness of a Heikin Ashi Strategy can vary significantly depending on the instrument you are trading and its typical volatility. You must adapt your approach accordingly. For major equity indices like the S&P 500, trend-following on higher timeframes (daily, weekly) with Heikin Ashi works beautifully, as they tend to form long, sustained trends. In the world of forex, major pairs like EUR/USD and GBP/USD are generally cleaner than exotic pairs, which can be prone to lower liquidity and erratic spikes. Cryptocurrencies present a unique challenge. While they offer incredible trends, they also exhibit extreme volatility and more frequent, violent whipsaws. To trade crypto successfully with this method, using stronger confirmation filters and perhaps slightly wider stops becomes essential to survive the volatility.
Backtest: What The Data Shows
Theories and strategies are great, but as traders, we must be guided by data. A historical backtest provides an objective look at how a strategy might have performed in the past. It’s not a guarantee of future results, but it sets realistic expectations. A long-term backtest was performed on a simple, long-only Heikin Ashi Strategy using the monthly color-cross rule on the S&P 500 from 1960 to the present. The results are fascinating and reveal the core trade-off of this system.
The strategy significantly cut the maximum drawdown—the largest peak-to-trough drop in account value—to just under 30%, compared to a gut-wrenching 52.56% for a simple buy-and-hold approach. This highlights Heikin Ashi’s strength in risk management and capital preservation during bear markets. However, this safety came at the cost of absolute returns, with the strategy yielding a lower annual growth rate. This is a classic trend-following profile: you sacrifice some upside potential to chop off the downside risk. The risk-adjusted return, however, was competitive, proving that on a risk-per-unit-of-reward basis, the simple HA system holds its own. This data underscores the importance of adding filters (like RSI, MACD, etc.) to a basic Heikin Ashi Strategy to improve trade selectivity and potentially enhance the return profile.
Backtest Summary Table: HA Color Cross (Monthly S&P 500)
| Metric | Heikin Ashi Strategy | Buy & Hold | Notes |
| Trades | 83 | N/A | Monthly HA color cross, long-only |
| Win Rate | 49.4% | N/A | Typical for trend-following |
| CAGR (no div.) | 4.77% | 7.03% | Partial exposure, reduced upside |
| Max Drawdown | 29.89% | 52.56% | Smoother equity curve |
| Time in Market | 66.76% | 100% | Lower exposure reduces drawdowns |
| Risk-Adjusted Return | 7.15% | 7.03% | Simple HA can be competitive on a risk basis |
Mistakes To Avoid With HA
Even with the best Heikin Ashi Strategy, there are common pitfalls that can trap inexperienced traders. Being aware of these mistakes is the first step to avoiding them. Over the years, I’ve seen these same errors repeated time and again, and they are almost always preventable with a bit of discipline and knowledge.
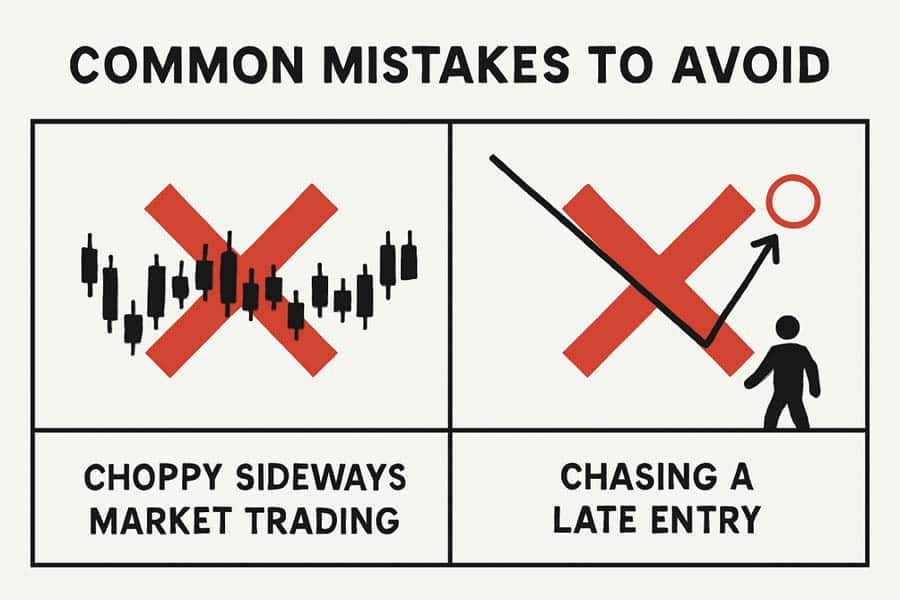
- Using HA Alone in Ranging Markets: This is the number one mistake. Heikin Ashi is a trend-following tool. Using it in a sideways, choppy market will generate a constant stream of false buy and sell signals, leading to death by a thousand cuts. Always confirm the market is actually trending before deploying your strategy.
- Chasing Late Color Flips: Because of the lag, the color flip might appear well after a significant move has already occurred. Entering late dramatically increases your risk and reduces your potential reward. If you miss the initial entry signal near the start of a trend, it’s often better to wait for the next pullback and setup.
- Ignoring Wicks as Risk Signals: A long wick against your position is a warning sign from the market that opposing pressure is building. Ignoring a series of long wicks on your Heikin Ashi candles is like ignoring the check engine light in your car. Pay attention to them as they signal potential trend exhaustion.
- Applying Indicators to HA Values: This is a subtle but critical technical error. Most indicators like RSI or Stochastics should be calculated based on the actual open, high, low, and close prices of the asset, not the averaged values of the Heikin Ashi candles. Applying an indicator to the HA chart itself can distort its readings and give you false signals. Ensure your charting platform is set up correctly.
Upgrade Your Trading with Opofinance
To effectively implement any Heikin Ashi Strategy, you need a reliable and innovative broker. Opofinance, regulated by ASIC, offers the perfect environment for traders seeking an edge.
- Advanced Trading Platforms: Choose from industry-leading platforms including MT4, MT5, cTrader, and the intuitive OpoTrade app.
- Innovative AI Tools: Leverage the power of AI with our Market Analyzer for insights, an AI Coach for personalized guidance, and 24/7 AI Support.
- Flexible Trading Options: Explore Social Trading to follow experts or take on a challenge with Prop Trading.
- Secure & Flexible Transactions: Enjoy peace of mind with safe, convenient deposits and withdrawals, including crypto payments with zero fees.
Take your trading to the next level. Discover the Opofinance advantage today!
Conclusion
Mastering a Heikin Ashi Strategy is about embracing clarity and discipline over noise and emotion. By focusing on trend-following principles, confirming signals with reliable indicators like the RSI or EMAs, and implementing iron-clad risk management, you can build a robust trading system. Remember that Heikin Ashi is a visualization tool; its power is unlocked when combined with a solid understanding of market structure and momentum. The data shows its strength lies in drawdown reduction, making it an excellent foundation for a risk-conscious heikin ashi trading strategy.
Can you use Heikin Ashi for entry and exit signals?
Yes, but with caution. A color flip is a primary signal, but it should be confirmed by another indicator (like MACD or RSI) to avoid acting on false signals caused by its inherent lag. Exits can be triggered by a reverse color flip or indecision candles.
Is Heikin Ashi better than regular candlesticks?
It’s not better, it’s different. Heikin Ashi is superior for identifying trend direction and strength by smoothing price. Regular candlesticks are better for viewing exact price levels, identifying chart patterns, and executing precise entries and stops.
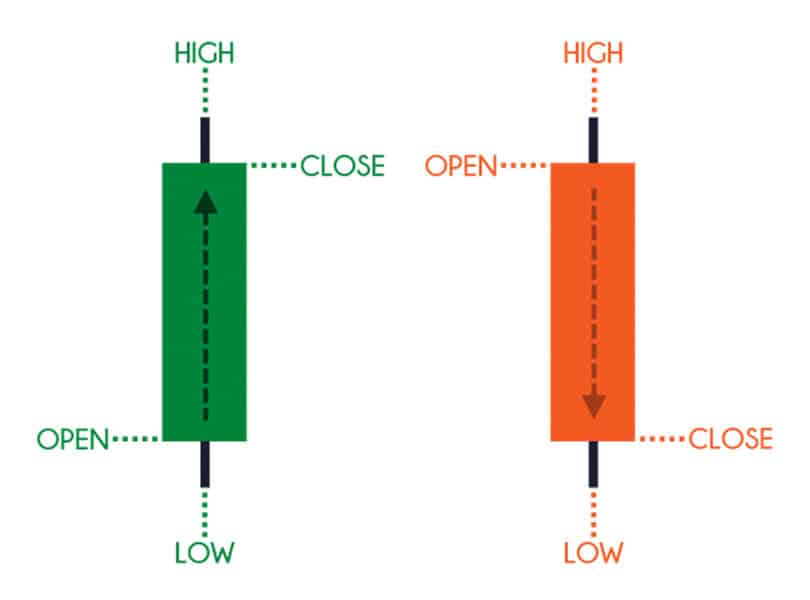
How do you calculate Heikin Ashi candles?
Each HA candle is calculated using some information from the previous candle: The HA Close is the average of the open, high, low, and close of the current period. The HA Open is the average of the open and close of the previous HA candle.
What is the best indicator to combine with a Heikin Ashi strategy?
There is no single “best” one, but the most effective combinations involve a trend-confirming indicator. The 200 EMA is excellent for a macro trend filter, while the RSI or Supertrend indicator is great for confirming momentum and timing entries.
Does the Heikin Ashi candle strategy work in crypto?
Yes, it works well for identifying the strong trends common in crypto. However, due to high volatility, you must use it on higher timeframes (4-hour and up) and pair it with strong confirmation filters to avoid getting stopped out by sharp, noisy price swings.
References:


