

In the perennial debate of heikin ashi vs candlestick charts, the answer depends entirely on your trading objective. For traders seeking to identify and ride strong trends with less market noise, Heikin Ashi charts are superior. Conversely, for those requiring precise entry and exit points based on raw price action and classic patterns, traditional candlestick charts are unbeatable. This guide will dissect the core differences, provide data-driven comparisons, and showcase practical strategies for both. We’ll explore the mathematical formulas, side-by-side analyses, and even hybrid techniques, helping you decide which tool is right for your strategy when trading with an online forex broker. The ultimate goal is to clarify the heikin ashi vs candlestick dilemma once and for all.
Key Takeaways
- Core Difference: Heikin Ashi charts smooth out price action by averaging data, making trends clearer. Traditional candlestick charts display raw open, high, low, and close (OHLC) prices, showing every price fluctuation.
- Best Use for Heikin Ashi: Ideal for trend-following strategies in volatile markets like crypto or forex. It helps traders stay in profitable trades longer by filtering out minor corrections and noise.
- Best Use for Candlesticks: Essential for scalping, day trading, and strategies that rely on specific chart patterns (e.g., Doji, Engulfing patterns) for high-precision entries and exits.
- The Verdict on Heikin Ashi vs Candlestick: Neither is universally “better.” Heikin Ashi offers trend clarity at the cost of price sensitivity. Candlesticks provide price accuracy at the cost of potential noise. The choice hinges on your trading style.
- Hybrid Strategy: Many experienced traders use a hybrid approach—employing Heikin Ashi on a higher timeframe to identify the dominant trend and switching to candlestick charts on a lower timeframe for precise trade execution.
Heikin Ashi vs Candlestick: The Fast Answer
In the direct comparison of heikin ashi vs candlestick, the winner is determined by the trader’s immediate goal. Heikin Ashi is the preferred tool for trend identification and noise reduction, while candlesticks are the champion of price precision and pattern recognition.
To make a quick decision, consider your primary need:
- If you are a trend-follower: Choose Heikin Ashi to avoid getting shaken out of trades by minor pullbacks and market noise. It excels at visualizing the strength and direction of a sustained move.
- If you are a day-trader or scalper: Stick with traditional candlesticks. Your strategy depends on capturing small price movements and identifying exact entry/exit levels, which Heikin Ashi obscures.
- If you are an algorithmic developer: Use candlestick data for back-testing strategies based on exact price levels. Use Heikin Ashi calculations as a supplementary “trend filter” within your algorithm’s logic.
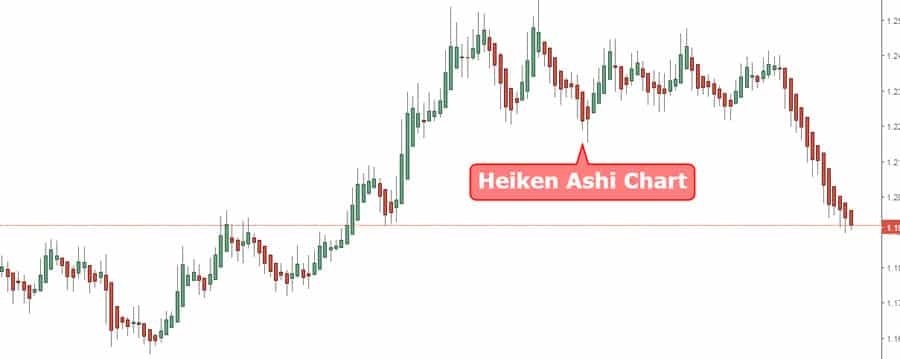
How Heikin Ashi Charts Work
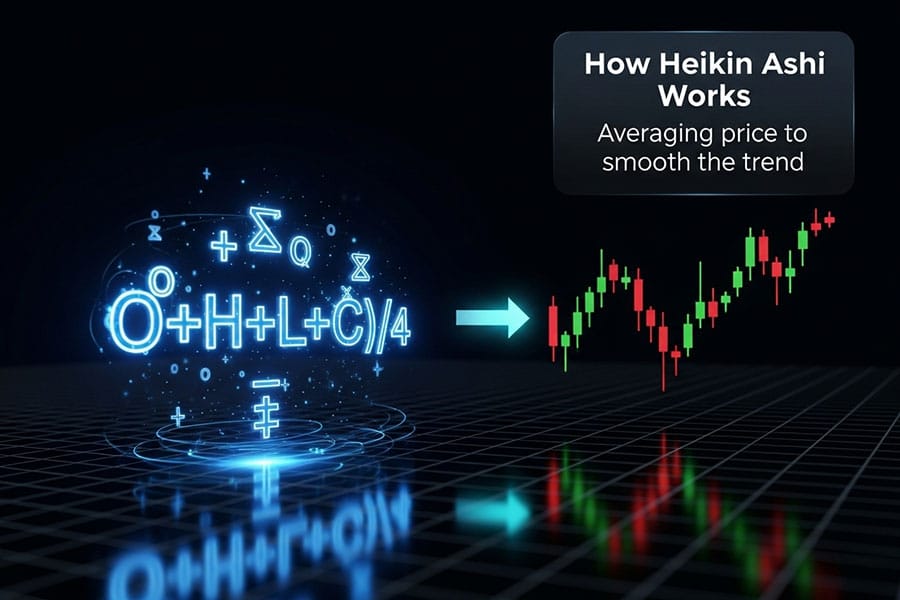
Heikin Ashi, which translates to “average bar” in Japanese, is a chart type that modifies how price values are displayed. Unlike traditional candlesticks that use raw OHLC data for each period, Heikin Ashi candles use a formula to average the price movements, creating a smoother, more coherent visual representation of the trend. This filtering process is what makes the heikin ashi vs candlestick discussion so relevant for trend traders.
The core of the Heikin Ashi technique lies in its unique calculation for each candle’s components:
- Heikin Ashi Close: (Open + High + Low + Close) / 4. This is the average price of the current bar.
- Heikin Ashi Open: (Previous Heikin Ashi Open + Previous Heikin Ashi Close) / 2. This is the midpoint of the previous Heikin Ashi bar.
- Heikin Ashi High: The maximum value among the current bar’s High, the Heikin Ashi Open, and the Heikin Ashi Close.
- Heikin Ashi Low: The minimum value among the current bar’s Low, the Heikin Ashi Open, and the Heikin Ashi Close.
This averaging mechanism is the reason Heikin Ashi charts look different from their candlestick counterparts, showing longer stretches of bullish or bearish candles with fewer interruptions.
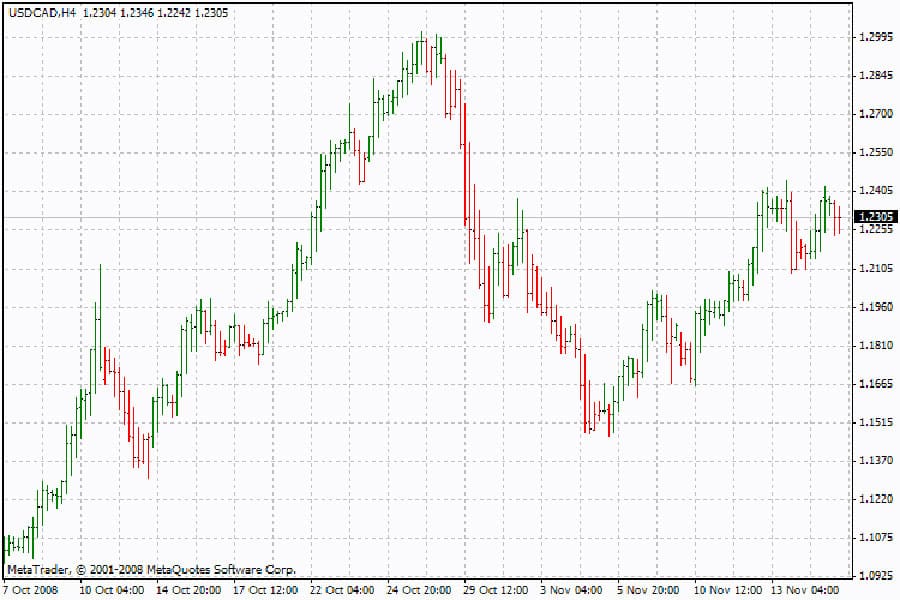
How Traditional Candlestick Charts Work
The traditional Japanese candlestick chart is the default for most traders worldwide. Each candle provides a direct, unfiltered snapshot of price movement for a specific period by showing four key data points: the open, high, low, and close (OHLC). This raw data representation is the fundamental difference in the heikin ashi candles vs candlestick debate.
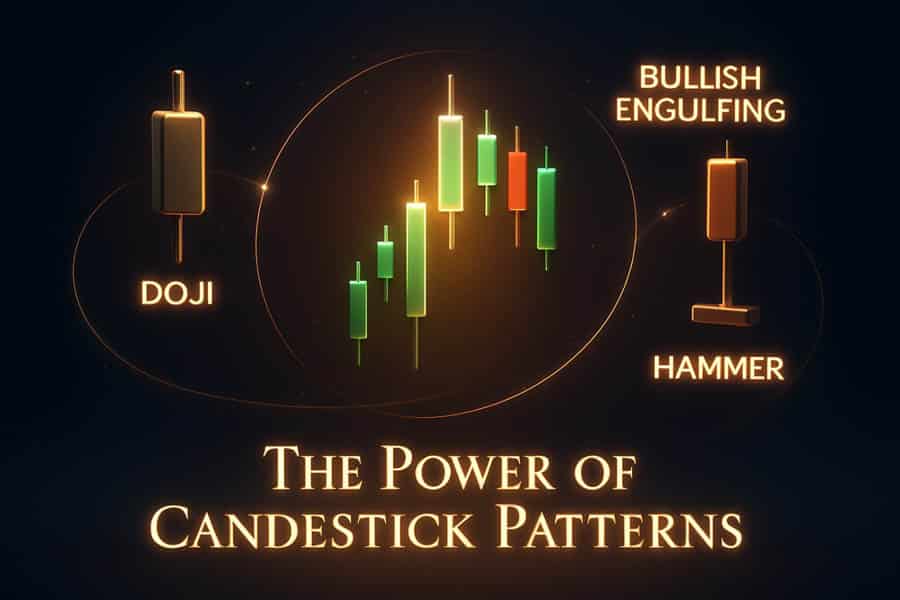
Their power lies in the patterns formed by individual or groups of candles, which traders have used for centuries to predict short-term price movements. Some of the most common patterns include:
- Doji: Indicates indecision in the market, where the open and close prices are nearly identical.
- Engulfing (Bullish/Bearish): A strong reversal signal where one candle’s body completely covers the body of the previous candle.
- Hammer and Hanging Man: Reversal patterns characterized by long lower wicks and small bodies.
Side-by-Side Comparison: Heikin Ashi vs Candlestick
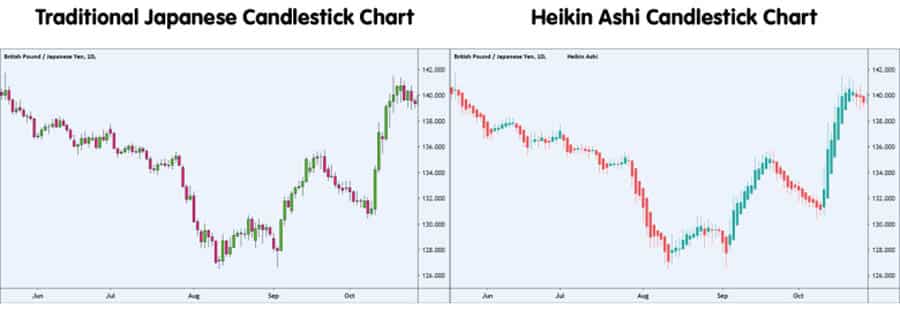
To truly understand the functional differences in the heikin ashi vs candlestick matchup, a direct comparison is essential. This table breaks down the key characteristics of each chart type, helping you align their features with your trading style and strategic needs.
| Criterion | Heikin Ashi | Traditional Candlestick |
| Price Data | Averaged/Modified – Does not show the true open and close price. | Raw/Actual – Shows the exact open, high, low, and close price. |
| Noise Level | Low – Filters out minor price fluctuations and market noise. | High – Displays all price movements, including noise and volatility. |
| Pattern Recognition | Poor for classic patterns (e.g., Doji, Hammer). Better for trend patterns. | Excellent for identifying classic reversal and continuation patterns. |
| Indicator Lag | Higher – The averaging formula introduces a slight lag. | Minimal – Reflects price action in real-time. |
| Best For | Trend-following, swing trading, identifying market direction. | Scalping, day trading, precise entry/exit, pattern trading. |
| Strengths | Clarity of trend, stress reduction, prevents premature exits. | Price accuracy, reveals true volatility, enables precise stops. |
| Drawbacks | Obscures actual price, gaps are not visible, lags behind price. | Can be “noisy,” leading to false signals and whipsaws in choppy markets. |
When to Choose Heikin Ashi Charts
The decision to use Heikin Ashi charts comes down to prioritizing trend clarity over price precision. From my experience, these charts are invaluable in specific scenarios where emotional discipline and trend conviction are paramount. The very nature of the heikin ashi vs candlestick choice is about managing information flow; Heikin Ashi deliberately simplifies it.
You should opt for Heikin Ashi in the following situations:
- Riding Strong, Sustained Trends: When an asset is in a clear uptrend or downtrend, Heikin Ashi shines. It produces consecutive candles of the same color, making it psychologically easier to hold a winning trade without being panicked by minor pullbacks that would appear as contrary-colored candles on a traditional chart.
- Filtering Out False Breakouts: In choppy or consolidating markets, candlestick charts can generate numerous false breakout signals. Heikin Ashi’s smoothing mechanism helps filter these out, as a true breakout will be represented by a strong Heikin Ashi candle with a full body and no lower (in an uptrend) or upper (in a downtrend) wick.
- Trading Highly Volatile Assets (e.g., Crypto): The crypto market is notorious for its extreme volatility and whipsaws. Using Heikin Ashi can help traders maintain their sanity and focus on the underlying trend rather than reacting to every sudden price spike or dip. The heikin ashi chart advantages are most pronounced here.
Real-Trade Example: Bitcoin’s 2021 Bull Run
During the 2021 Bitcoin bull run, traders using traditional candlestick charts were often shaken out by sharp, but temporary, pullbacks. In contrast, a Heikin Ashi chart on the daily timeframe showed a long, almost uninterrupted series of green candles from late 2020 through the first quarter of 2021. This visual clarity would have provided a much stronger conviction to hold the long position, capturing a significant portion of the trend. This is a classic example of winning the heikin ashi candles vs candlestick battle by focusing on the bigger picture.
When to Choose Candlestick Charts
While Heikin Ashi is excellent for trends, the traditional candlestick chart remains the tool of choice for precision. If your strategy relies on speed, exact price levels, and classic charting techniques, then candlesticks are non-negotiable. The debate over heikin ashi vs candlestick often ends here for short-term traders.
You should stick with traditional candlesticks for these scenarios:
- Scalping and High-Frequency Trading: Scalpers profit from tiny price movements. They need to see the exact bid and ask in real-time and cannot afford the lag introduced by Heikin Ashi’s averaging formula. The raw OHLC data from candlesticks is essential for this style.
- Setting Precise Stop-Loss and Take-Profit Orders: Strategies that require placing stop-losses just below a specific support level or a candle’s low demand the accuracy of candlestick charts. Heikin Ashi’s averaged values do not reflect the true price highs and lows, making precise order placement impossible.
- Classic Pattern Trading: If your trading system is built on identifying patterns like the Bullish Engulfing, Head and Shoulders, or Doji stars, you must use candlestick charts. These patterns are defined by the relationships between raw OHLC prices, and their formations are completely obscured on a Heikin Ashi chart.
Real-Trade Example: EUR/USD 5-Minute Scalp
Imagine a scalper watching the EUR/USD on a 5-minute chart. They see a perfect Doji form right at a key resistance level, signaling potential exhaustion of the uptrend. They enter a short position, placing their stop-loss just a few pips above the high of the Doji. This level of precision is only possible with a traditional candlestick chart. A Heikin Ashi chart would have likely shown a small-bodied green candle, completely hiding the critical indecision signal the Doji provided. Here, the heikin ashi vs candlestick argument is settled by the need for actionable, immediate data.
A Hybrid Strategy: Getting the Best of Both Worlds
Why choose one when you can use both? Many seasoned traders, myself included, resolve the heikin ashi vs candlestick dilemma by employing a hybrid approach. This strategy leverages the strengths of each chart type for different aspects of the trading process: trend identification and trade execution. It’s a powerful way to combine macro clarity with micro precision.
The core idea is to use Heikin Ashi on a higher timeframe to define the dominant trend and then switch to traditional candlesticks on a lower timeframe to pinpoint exact entry and exit points. This systematic approach enhances discipline and improves the quality of trade signals. The ongoing heikin ashi vs candlestick discussion often overlooks this powerful synthesis.
Step-by-Step Hybrid Checklist:
- Step 1: Define the Primary Trend. Open a Heikin Ashi chart on a higher timeframe (e.g., Daily or 4-Hour). Look for a clear series of bullish (green/white) or bearish (red/black) candles. If you see two or more strong Heikin Ashi candles in one direction, the primary trend is confirmed.
- Step 2: Await a Pullback on the Execution Timeframe. Switch to a traditional candlestick chart on a lower timeframe (e.g., 1-Hour or 15-Minute). In an uptrend, wait for the price to pull back to a key support level, moving average, or Fibonacci retracement level.
- Step 3: Identify the Entry Signal. Look for a classic bullish reversal pattern on the candlestick chart. This could be a Bullish Engulfing, a Hammer, or a Morning Star pattern. This signal confirms that the pullback is likely over and the primary trend is resuming.
- Step 4: Execute and Manage the Trade. Enter the trade based on the candlestick signal. Place your stop-loss below the low of the reversal pattern and set your take-profit targets based on your risk-reward rules. You can then switch back to the Heikin Ashi chart to manage the trade, holding it as long as the strong trend candles persist.
This hybrid method is one of the most effective ways to resolve the heikin ashi vs candlestick debate in practice.
Back-Test Results: A Data-Driven Look
Theoretical advantages are great, but as a trader, I rely on data. While individual results vary, public back-tests and academic studies offer valuable insights into the performance of heikin ashi vs candlestick based strategies. A study frequently cited in trading forums and analyzed by multiple sources tested a simple moving average crossover strategy on the same asset, once using Heikin Ashi signals and once using traditional candlestick signals.
The results consistently highlight the core trade-off. A summary of findings from a public back-test published on a popular trading platform revealed:
- Win Rate & Profit Factor: The Heikin Ashi version of the strategy often showed a slightly higher win rate. Because it filters out noise, it enters fewer trades, but the trades it does enter are more likely to be aligned with a strong, underlying trend. This led to a better profit factor in trending markets.
- Sharpe Ratio: The Heikin Ashi strategy generally produced a higher Sharpe ratio. This metric measures risk-adjusted return. The smoother equity curve, a result of avoiding whipsaws and holding onto trends longer, means the returns were achieved with lower volatility (and less psychological stress).
- Drawdown: This is where Heikin Ashi’s strength becomes most apparent. The maximum drawdown for the Heikin Ashi strategy was significantly lower. By preventing premature exits during minor pullbacks and avoiding choppy market conditions, it protected capital more effectively during periods of consolidation.
However, the study also confirmed that in ranging or non-trending markets, the candlestick-based strategy performed better, capturing small oscillations that the lagging Heikin Ashi system missed entirely. This data reinforces the verdict: the superiority in the heikin ashi candles vs candlestick comparison is context-dependent. The heikin ashi chart advantages are tied directly to trend persistence.
How to Set Up Heikin Ashi on Popular Platforms
Switching your chart type from traditional candlesticks to Heikin Ashi is simple on virtually all modern trading platforms. This accessibility is a key reason why the heikin ashi vs candlestick debate is so practical for retail traders. Here’s a quick guide for the most popular platforms.
TradingView
TradingView offers one of the easiest ways to toggle between chart types. Simply click on the chart style icon in the top toolbar (it looks like two candles next to each other). A dropdown menu will appear. Select “Heikin Ashi” from the list. Your chart will instantly transform, but your underlying candlestick chart remains accessible just a click away.
MetaTrader 4/5 (MT4/MT5)
On MT4 and MT5, Heikin Ashi is typically available as a custom indicator rather than a built-in chart type. Go to the “Navigator” window, expand the “Indicators” tree, and you should find “Heikin Ashi” listed. Drag and drop it onto your chart. It will overlay the Heikin Ashi candles on top of your existing candlestick chart. You can customize the colors in the indicator’s settings to hide the underlying candles for a cleaner view.
NinjaTrader
In NinjaTrader, you can change the chart style directly from the chart window. Right-click on the chart, select “Data Series,” and in the settings window, you will find a parameter for “Chart style” or “Type.” Click the dropdown menu and select “Heikin Ashi.” This platform, like TradingView, treats it as a primary chart type, making the switch seamless.
Trade with Opofinance
Ready to apply your knowledge of the heikin ashi vs candlestick charts? Opofinance, an ASIC-regulated broker, provides the tools and environment for success. Benefit from a suite of powerful features designed for the modern trader.
- Advanced Trading Platforms: Choose from industry standards like MT4, MT5, cTrader, or the intuitive OpoTrade platform.
- Innovative AI Tools: Gain a competitive edge with our AI Market Analyzer, AI Coach, and instant AI Support.
- Diverse Trading Options: Explore opportunities in Social Trading and Prop Trading to diversify your strategies.
- Secure & Flexible Transactions: Enjoy safe and convenient deposits and withdrawals, including crypto payments with zero fees.
Take your trading to the next level with a broker that combines security and innovation. Start trading with Opofinance today!
Conclusion
The heikin ashi vs candlestick debate is not about finding a single “best” chart, but about understanding the right tool for the job. Heikin Ashi provides a clear, noise-free view of the market’s trend, making it ideal for swing and position traders. Traditional candlesticks offer unfiltered, real-time price data, a necessity for scalpers and pattern traders. By understanding their distinct advantages and considering a hybrid approach, you can harness the power of both to make more informed, confident, and ultimately more profitable trading decisions.
Does the Heikin Ashi chart show the real price?
No, and this is a critical point. The closing price you see on a Heikin Ashi candle is not the actual closing price of the asset. It is a calculated average. Always refer to the actual price scale on your trading platform or a candlestick chart for the true market price.
Is Heikin Ashi good for identifying support and resistance?
It is generally not recommended. Because Heikin Ashi averages the price, it does not show the true highs and lows where support and resistance levels are formed. For accurate S/R analysis, always use a traditional candlestick chart.
Can you use indicators like RSI or MACD with Heikin Ashi?
Yes, you can. In fact, many traders find that indicators produce smoother, more reliable signals when paired with Heikin Ashi charts because the smoothed price data filters out much of the noise that can cause false indicator crossovers.
Which timeframe is best for Heikin Ashi?
Heikin Ashi is most effective on higher timeframes, such as the 4-hour, daily, or weekly charts. On these timeframes, trends are more established, and the smoothing effect of Heikin Ashi is most beneficial for identifying and riding these major moves.
Does Heikin Ashi repaint?
No, Heikin Ashi does not “repaint” in the traditional sense of indicators changing past signals. However, since a candle’s open is based on the previous candle’s midpoint, its values are inherently retrospective and will look different from a standard candlestick chart for the same period.
References:


