Unlock the full potential of your trading strategy with how to use the On Balance Volume indicator effectively. The On-Balance Volume (OBV) indicator is a powerful tool that leverages volume changes to predict price movements, making it indispensable for traders seeking to gain an edge in the market. Whether you’re a beginner or an experienced trader, understanding the OBV can significantly enhance your decision-making process. In this comprehensive guide, we’ll delve deep into the on balance volume indicator, exploring its key concepts, practical applications, and advanced tips to elevate your trading game. Additionally, discover how partnering with a regulated forex broker like Opofinance can complement your OBV-based strategies for optimal results.
Key Concepts of OBV
OBV as a Momentum Indicator
The On-Balance Volume indicator serves as a momentum indicator, tracking the cumulative flow of volume in and out of a security. By monitoring volume changes, OBV helps traders identify the strength of a trend and potential reversals. Unlike price-based indicators, OBV emphasizes the relationship between volume and price, providing a deeper insight into market sentiment.
Basic Calculation
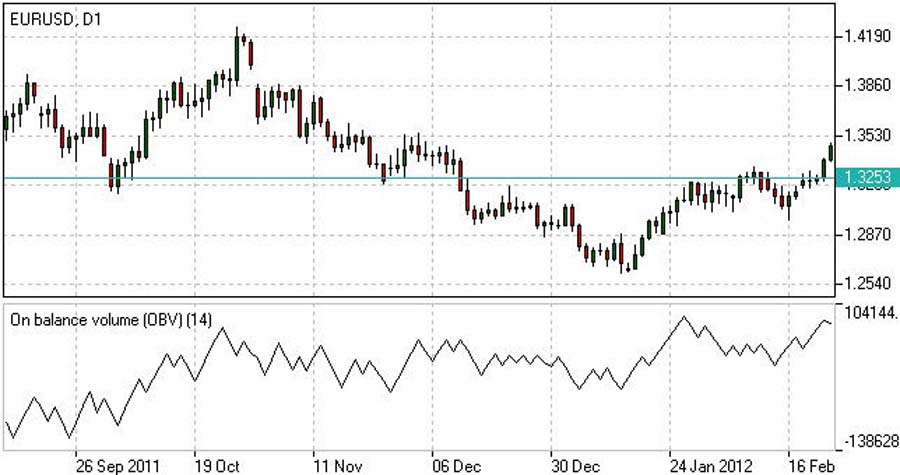
Calculating OBV is straightforward, yet its simplicity hides its analytical power:
- Add the volume on up days (when the closing price is higher than the previous day).
- Subtract the volume on down days (when the closing price is lower than the previous day).
For example:
- Day 1: Close = $100, Volume = 1,000 → OBV = 1,000
- Day 2: Close = $102 (up), Volume = 1,500 → OBV = 2,500
- Day 3: Close = $101 (down), Volume = 1,200 → OBV = 1,300
This cumulative total provides insights into the buying and selling pressure behind price movements, allowing traders to anticipate future price actions based on volume trends.
Importance of the OBV Direction
The direction of OBV is more crucial than its absolute value. An upward-sloping OBV suggests accumulation (buying pressure), while a downward slope indicates distribution (selling pressure). This directional trend helps in confirming the overall market sentiment and can be a reliable indicator for potential trend continuation or reversal.
How to Use OBV in Trading
1. Trend Confirmation
Trend confirmation is one of the most fundamental uses of OBV. By comparing OBV with price movements, traders can validate the strength and direction of a trend.
- Bullish Trend: When OBV is rising alongside the price, it confirms an ongoing bullish trend. This indicates that the volume is increasing on up days, reinforcing the upward price movement.
Example: If a stock’s price is climbing and OBV is simultaneously increasing, it suggests strong buying interest, making the bullish trend more reliable.
- Bearish Trend: Conversely, if OBV is falling while the price declines, it indicates a bearish trend. This shows that selling pressure is consistent, supporting the downward price movement.
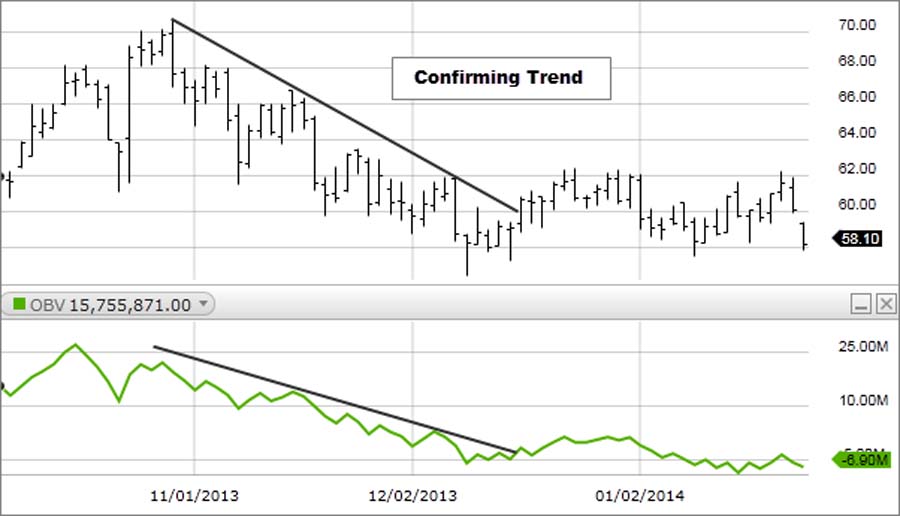
Example: A declining stock price accompanied by decreasing OBV signals sustained selling pressure, confirming the bearish trend.
2. Identifying Divergences
Divergences between OBV and price can signal potential reversals, offering traders early warnings before the trend changes.
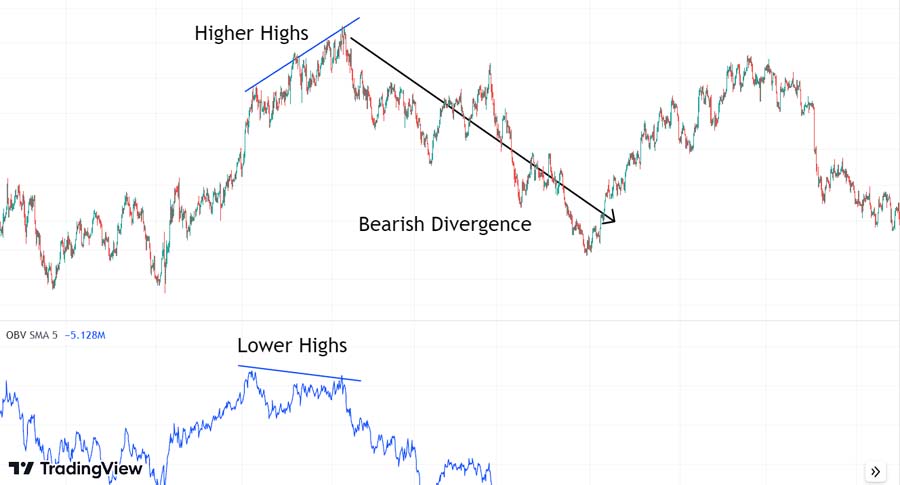
- Bullish Divergence: Occurs when the price makes lower lows while OBV makes higher lows. This suggests that despite the declining price, buying volume is increasing, indicating potential upward reversal.
Example: If a stock hits a new low but OBV rises, it implies that the selling pressure is diminishing, and buyers may step in, signaling a possible trend reversal to the upside.
- Bearish Divergence: Happens when the price records higher highs, but OBV makes lower highs. This indicates that the buying volume is weakening despite rising prices, signaling a potential downward reversal.
Example: A stock reaches a new high, but OBV declines, suggesting that the upward price movement is not supported by strong buying volume, and a reversal may be imminent.
3. Trading Ranges and Breakouts
OBV can provide valuable insights during trading ranges and breakouts, helping traders anticipate significant market moves.
- Accumulation Phase: A rising OBV during price consolidation suggests accumulation, hinting at an upcoming upward breakout. This phase often precedes a significant price increase as large investors accumulate positions.
Example: If a stock is trading sideways and OBV is steadily increasing, it may indicate that accumulation is underway, and a breakout to the upside could follow.
- Distribution Phase: A falling OBV in a trading range may signal distribution, pointing towards a potential downward breakout. This phase often precedes a price decline as large investors distribute their holdings.
Example: If a stock is trading sideways and OBV is decreasing, it may indicate that distribution is occurring, and a breakout to the downside could ensue.
4. Combining OBV with Other Indicators
Enhancing OBV with other technical indicators can improve signal reliability and provide a more comprehensive trading strategy.
- Moving Averages: Pairing OBV with moving averages (e.g., 20-period EMA) can smooth out the OBV line and highlight trend changes more clearly.
Example: When OBV crosses above its 20-period EMA, it can signal a buy opportunity, while a cross below may indicate a sell signal.
- Crossovers: OBV crossovers with its moving average can serve as actionable buy/sell signals. These crossovers indicate shifts in volume momentum that may precede price movements.
Example: A bullish crossover occurs when OBV moves above its moving average, suggesting increasing buying pressure, while a bearish crossover occurs when OBV drops below its moving average, indicating rising selling pressure.
- Secondary Indicators: Incorporating tools like Bollinger Bands alongside OBV can provide additional confirmation for trades. Bollinger Bands can help identify overbought or oversold conditions in conjunction with OBV trends.
Example: If OBV is rising and the price breaks above the upper Bollinger Band, it may confirm a strong upward trend, signaling a buy opportunity.
OBV in Different Market Conditions
The on balance volume indicator is highly versatile and can be applied across various asset classes and timeframes, making it a valuable tool for diverse trading strategies.
- Asset Classes: Whether you’re trading stocks, forex, commodities, or cryptocurrencies, OBV can help gauge the underlying volume trends, providing insights into market sentiment and potential price movements.
Example: In forex trading, OBV can help identify currency pairs with strong buying or selling pressure, aiding in the selection of profitable trades.
- Timeframes: OBV can be effectively used on multiple timeframes, from intraday charts for short-term trading to daily, weekly, or monthly charts for long-term investing. This flexibility allows traders to adapt OBV to their specific trading styles and objectives.
Example: A day trader might use OBV on a 15-minute chart to make quick trading decisions, while a swing trader might analyze OBV on a daily chart to identify longer-term trends.
- Price Reversals: OBV is particularly useful in anticipating price reversals when it shows divergence from price action. This can provide early warnings of potential trend changes, allowing traders to adjust their positions accordingly.
Example: If a commodity is in a downtrend but OBV starts to rise, it may indicate an impending reversal to the upside, presenting a buying opportunity.
In volatile markets, OBV can be a reliable guide to underlying volume trends, offering a clearer picture amidst price fluctuations.
Read More: How to Use the ATR Indicator in Forex
Advantages and Limitations of OBV
Advantages
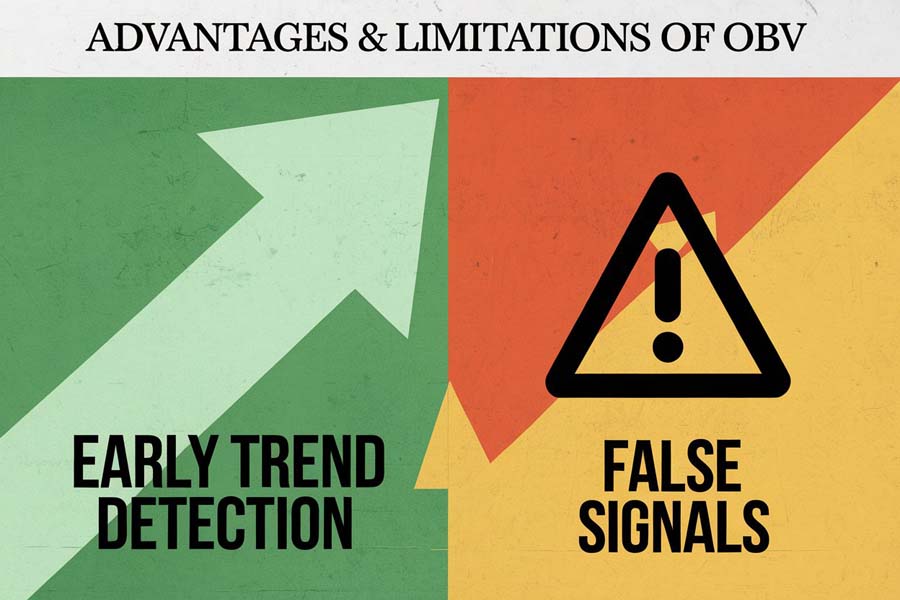
- Early Trend Detection: OBV can signal trends and potential reversals before they become apparent in price movements, giving traders a head start in their trading decisions.
Example: A rising OBV in a stock that hasn’t yet broken out of its consolidation phase can indicate impending upward movement.
- Simple Interpretation: Its straightforward calculation makes it easy to understand and apply across different assets, making it accessible for traders of all experience levels.
Example: Even novice traders can quickly grasp OBV concepts and integrate them into their trading strategies without the need for complex analysis.
- Volume-Based Insights: Unlike purely price-based indicators, OBV incorporates volume data, providing a more comprehensive view of market activity and sentiment.
Example: OBV can reveal hidden buying or selling pressure that may not be immediately visible through price charts alone.
Limitations
- False Signals: In low-volume markets, OBV may generate false signals, making it less reliable. It’s important to consider the overall market context and volume characteristics.
Example: A thinly traded stock might show misleading OBV movements due to sporadic volume spikes, leading to incorrect trading signals.
- Lagging Indicator: While OBV can provide early signals, it still relies on historical volume data, which may not always predict future price movements accurately.
Example: During sudden market news events, OBV may not adjust quickly enough to reflect the new trading dynamics, potentially delaying reaction to price changes.
- Best When Combined: To mitigate false signals and enhance reliability, it’s advisable to use OBV in conjunction with other indicators and analysis techniques.
Example: Combining OBV with RSI or MACD can provide a more robust trading strategy, filtering out unreliable signals and confirming trends.
Example Strategy Using OBV
Implementing a practical strategy using OBV can streamline your trading process and enhance decision-making. Here’s a step-by-step guide:
- Identify the Trend: Use OBV to confirm the current trend direction. Look for OBV moving in the same direction as the price to validate the trend.
Example: If a stock is trending upwards and OBV is also rising, it confirms a strong bullish trend.
- Look for Divergences: Spot any bullish or bearish divergences between OBV and price. Divergences can signal potential trend reversals.
Example: If the price is making higher highs but OBV is making lower highs, it indicates a bearish divergence, suggesting a possible downward reversal.
- Set Entry Points: Enter trades based on OBV crossovers or breakout signals. Use OBV trends to time your entries for optimal results.
Example: When OBV crosses above its moving average, it can signal a buy opportunity.
- Manage Risk: Set stop losses below support levels for long trades or above resistance levels for short trades to protect against unexpected market moves.
Example: If entering a long position based on OBV signals, place a stop loss below the recent swing low to limit potential losses.
- Take Profit: Determine exit points based on OBV signals or predefined profit targets to lock in gains.
Example: If OBV starts to flatten or reverse after a significant rise, it may be time to take profits on your long position.
By following this step-by-step process, traders can effectively leverage the On Balance Volume indicator to make informed trading decisions, manage risks, and maximize profits.
Read More: How to Use the Momentum Indicator in Forex
Pro Tips for Advanced Traders

Enhancing your OBV strategy with advanced techniques can provide deeper insights and improve trading performance.
- Combine Multiple Timeframes: Analyze OBV across different timeframes to get a comprehensive view of market trends. This multi-dimensional approach can help identify long-term and short-term opportunities.
Example: Use daily OBV to identify the primary trend and 1-hour OBV to time entry points within that trend.
- Integrate Volume Patterns: Look for specific volume patterns in OBV, such as spikes or plateaus, to anticipate significant market moves. Understanding these patterns can enhance your predictive accuracy.
Example: A sudden spike in OBV during a price consolidation phase can signal the start of a strong trend.
- Use Custom Indicators: Enhance OBV with custom indicators or scripts tailored to your trading style for better precision. Customizing OBV settings can help align it with specific market conditions or trading strategies.
Example: Create a custom OBV indicator that highlights significant volume changes or incorporates additional filters for more refined signals.
- Monitor Volume Indicators: Combine OBV with other volume-based indicators like Volume Weighted Average Price (VWAP) or Chaikin Money Flow (CMF) for a more holistic volume analysis.
Example: Using OBV alongside VWAP can provide a balanced view of both price and volume trends, improving trade accuracy.
- Backtest Strategies: Rigorously backtest your OBV-based strategies using historical data to validate their effectiveness before applying them in live trading.
Example: Test your OBV divergence strategy on past market data to assess its performance and refine your approach accordingly.
Opofinance Services
Why Choose Opofinance?
Discover the advantages of trading with Opofinance, an ASIC-regulated forex broker renowned for its exceptional services. Whether you’re new to trading or an experienced trader, Opofinance offers the tools and support you need to succeed.
Key Features
- Robust Social Trading Platform
- Engage with a Community: Mirror strategies from successful traders effortlessly. Learn from their insights and replicate their trades to enhance your own performance.
- Collaborative Environment: Share ideas, discuss strategies, and grow together with a network of like-minded traders.
- Advanced Trading Tools
- MT5 Integration: As an officially featured broker on the MT5 brokers list, Opofinance provides access to MetaTrader 5’s advanced charting tools, automated trading, and customizable indicators.
- On Balance Volume Integration: Seamlessly incorporate OBV and other technical indicators into your trading strategy using MT5’s powerful platform.
- Secure and Convenient Transactions
- Safe Deposits and Withdrawals: Opofinance ensures your funds are protected with a variety of secure methods, making deposits and withdrawals both safe and convenient.
- Transparent Fees: Enjoy competitive spreads and transparent fee structures without hidden costs.
- Exceptional Customer Support
- 24/7 Assistance: Get timely support from a dedicated customer service team, available five days a week to address your trading needs and inquiries.
- Educational Resources: Access a wealth of educational materials, webinars, and tutorials to help you master OBV and other trading strategies.

Why Opofinance is Perfect for OBV-Based Strategies
- Reliable Execution: Fast and reliable trade execution ensures that your OBV signals are acted upon swiftly, maximizing your trading opportunities.
- Customizable Platforms: Tailor your trading environment to suit your OBV-based strategies, enhancing your ability to analyze and act on volume trends effectively.
- Community and Support: Benefit from a supportive trading community and expert guidance to refine your use of the On Balance Volume indicator and other technical tools.
Get Started with Opofinance Today
Embark on your trading journey with Opofinance and leverage the full power of the On Balance Volume indicator to achieve your financial goals. Sign up today and take advantage of a secure, feature-rich trading environment designed to support both novice and seasoned traders.
Conclusion
Mastering how to use the On Balance Volume indicator can significantly elevate your trading strategy by providing deeper insights into market dynamics. Throughout this guide, we’ve explored the fundamental concepts of the on balance volume indicator, including its role as a momentum indicator, basic calculations, and the importance of its directional trends. By leveraging OBV for trend confirmation, identifying divergences, and anticipating breakouts, you can make more informed and strategic trading decisions.
The versatility of OBV across various asset classes and timeframes makes it an indispensable tool for both novice and seasoned traders. Whether you’re trading stocks, forex, commodities, or cryptocurrencies, integrating OBV with other technical indicators like moving averages and Bollinger Bands can enhance signal reliability and reduce the likelihood of false signals.
Advanced techniques, such as combining multiple timeframes and customizing indicators, further refine your OBV strategy, allowing for greater precision and adaptability in different market conditions. Additionally, partnering with a regulated forex broker like Opofinance ensures that you have a secure and efficient trading environment to implement your OBV-based strategies effectively.
In summary, the On Balance Volume indicator offers a powerful way to decode market sentiment and anticipate price movements by analyzing volume flow. By understanding and applying the strategies outlined in this article, you can harness the full potential of OBV to optimize your trading performance and achieve your financial goals.
Empower your trading journey by incorporating the On Balance Volume indicator into your strategy and take advantage of the robust tools and support provided by trusted brokers like Opofinance.
Key Takeaways
- On Balance Volume (OBV) is a crucial momentum indicator that tracks cumulative volume flow to predict price movements.
- Trend Confirmation and Divergences: Use OBV to confirm trends and identify potential reversals through bullish or bearish divergences.
- Strategic Combinations: Enhancing OBV with other indicators like moving averages and Bollinger Bands improves signal reliability.
- Versatility: OBV is effective across various asset classes and timeframes, aiding in anticipating price reversals.
- Balanced Use: While OBV offers early trend detection, it’s most effective when combined with other tools to avoid false signals.
- Advanced Techniques: Incorporate multiple timeframes, volume patterns, and custom indicators to refine your OBV strategy.
- Reliable Broker: Partnering with a regulated broker like Opofinance ensures a secure and efficient trading environment, enhancing your OBV-based strategies.
Can the OBV indicator be used effectively in cryptocurrency trading?
Yes, the OBV indicator can be effectively applied to cryptocurrency markets. It helps traders gauge the buying and selling pressure, which is particularly useful in the highly volatile crypto space. Cryptocurrencies often experience rapid price movements driven by volume changes, making OBV a valuable tool for identifying trend strength and potential reversals.
How does OBV differ from other volume-based indicators?
Unlike other volume-based indicators, OBV focuses on the cumulative flow of volume, emphasizing the direction of volume changes rather than just the volume itself. This approach provides a clearer trend signal by integrating volume with price movements, offering deeper insights into market sentiment. While indicators like Volume Oscillator or Chaikin Money Flow analyze volume in specific ways, OBV’s cumulative nature makes it uniquely effective for trend confirmation and divergence analysis.
What timeframes are best suited for using the OBV indicator?
OBV is versatile and can be used on various timeframes, from intraday charts to weekly or monthly charts, depending on your trading strategy and goals. Short-term traders may find OBV useful on minute or hourly charts for quick entries and exits, while long-term investors can utilize daily or weekly OBV to identify major trend shifts and sustained volume trends.


