

The ICT 30 Second Model, also known as ICT’s Son’s Model, has emerged as a powerful forex trading strategy that’s taking the trading world by storm. This innovative approach, developed by the renowned trader known as “ICT” for his son, offers a unique perspective on market analysis and decision-making. The ICT 30 Second Model provides traders with a structured framework to identify high-probability trading opportunities within a remarkably short timeframe, making it an invaluable tool for both novice and experienced forex traders alike.
As we delve into the intricacies of this model, we’ll explore how it can be applied to enhance your trading performance and potentially increase your profitability in the dynamic forex market. The model’s emphasis on multi-timeframe analysis, combined with its focus on specific market structures and price action patterns, sets it apart from traditional trading approaches.
For those seeking a reliable online forex broker to implement this strategy, understanding the ICT 30 Second Model is crucial for success in today’s competitive trading landscape. This model not only offers a fresh perspective on market dynamics but also provides a systematic approach to entering trades with precision timing.
In this comprehensive guide, we’ll break down the key components of the ICT 30 Second Model, discuss its implementation, explore advanced techniques, address psychological aspects of trading with this model, and look at its potential future developments. Whether you’re new to forex trading or an experienced trader looking to refine your strategy, this article will provide valuable insights into mastering the ICT 30 Second Model.
Understanding the Basics of the ICT 30 Second Model
What is the ICT 30 Second Model?
The ICT 30 Second Model is a trading methodology that focuses on identifying key market structures and price action patterns across multiple timeframes, culminating in a 30-second chart analysis for precise entry. This approach is based on the principle that significant market movements often occur in short bursts, and by analyzing these brief moments, traders can gain valuable insights into potential future price directions.
The model’s name comes from its final step, which involves analyzing the 30-second chart for entry opportunities. However, it’s important to note that the strategy involves a comprehensive analysis across multiple timeframes before reaching this final step.
Key Components of the Model
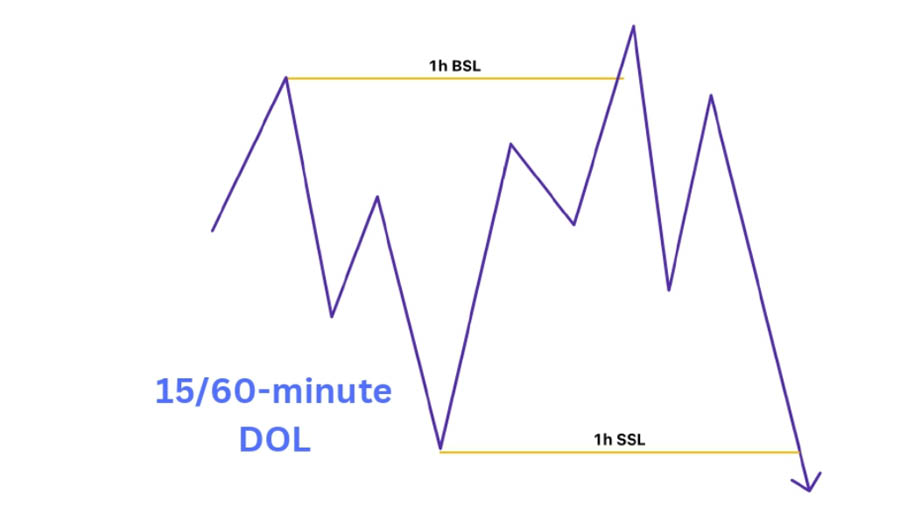
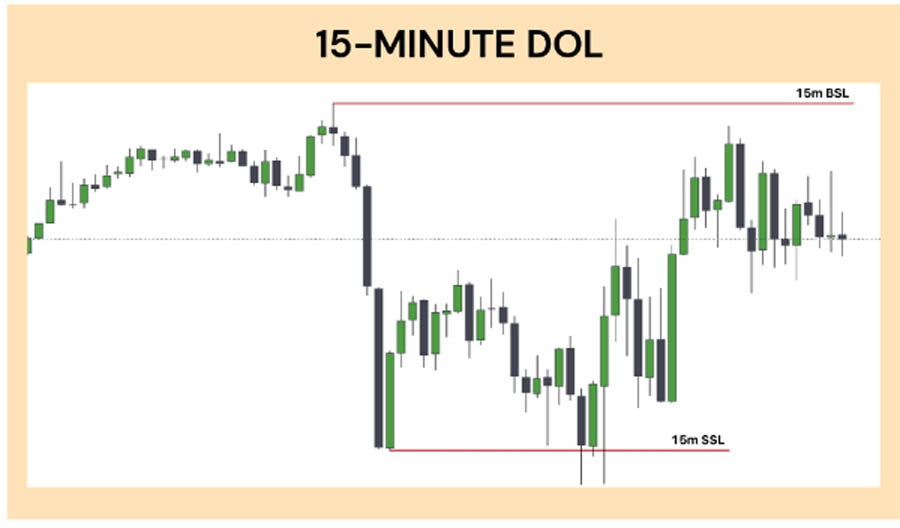
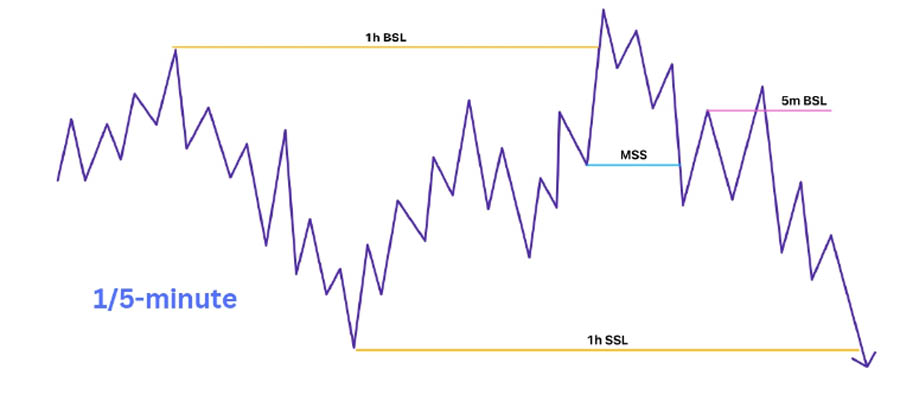
- Higher Timeframe Draw on Liquidity (DOL): This is the foundation of the model. Traders identify potential price targets on the 1-hour or 15-minute charts. The DOL represents where the market is likely to go and serves as the overall directional bias for the trade.
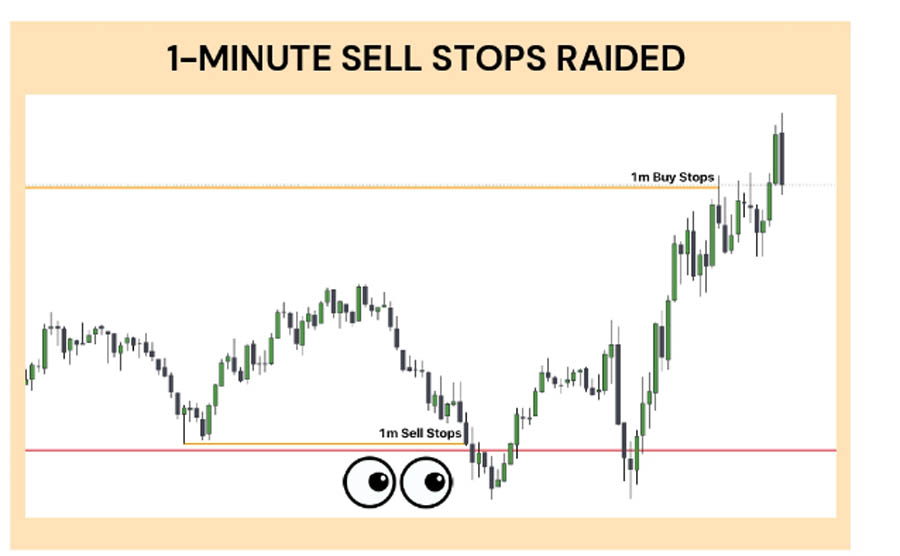
- Stop Run: This component involves looking for price action that takes out key swing highs or lows against the expected direction. It’s a crucial element as it often represents institutional trading activity.
- Rejection and Directional Move: After the stop run, traders observe for a price rejection and subsequent movement in the direction of the DOL. This confirms the validity of the initial analysis.
- Confirmation Candle: Traders wait for an up-close candle (in bullish scenarios) or down-close candle (in bearish scenarios) on the timeframe where the stop run occurred. This candle serves as additional confirmation of the directional move.
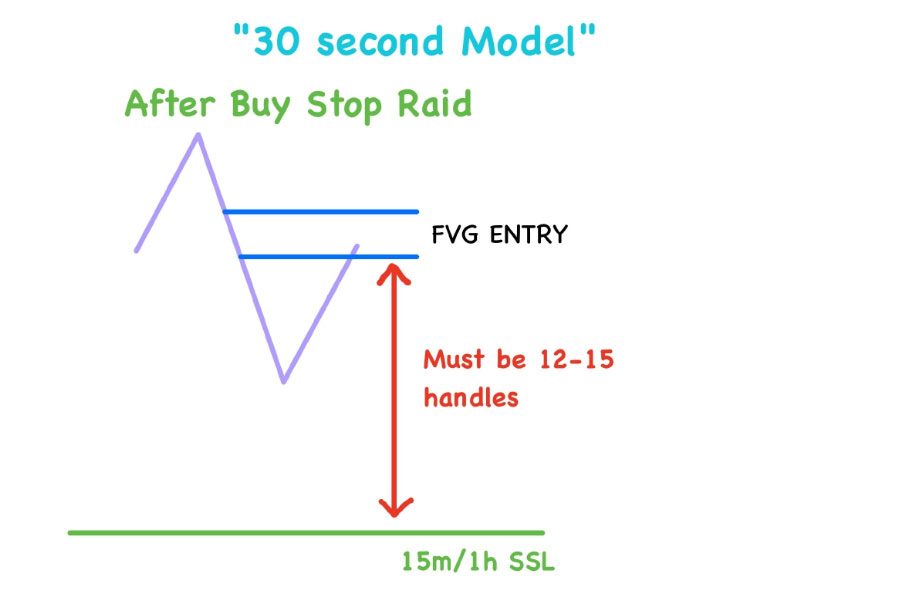
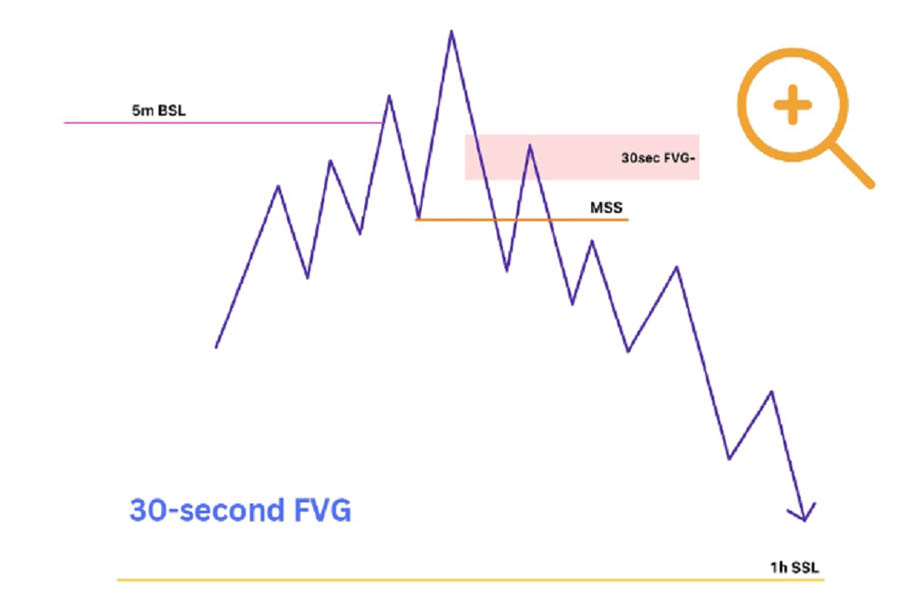
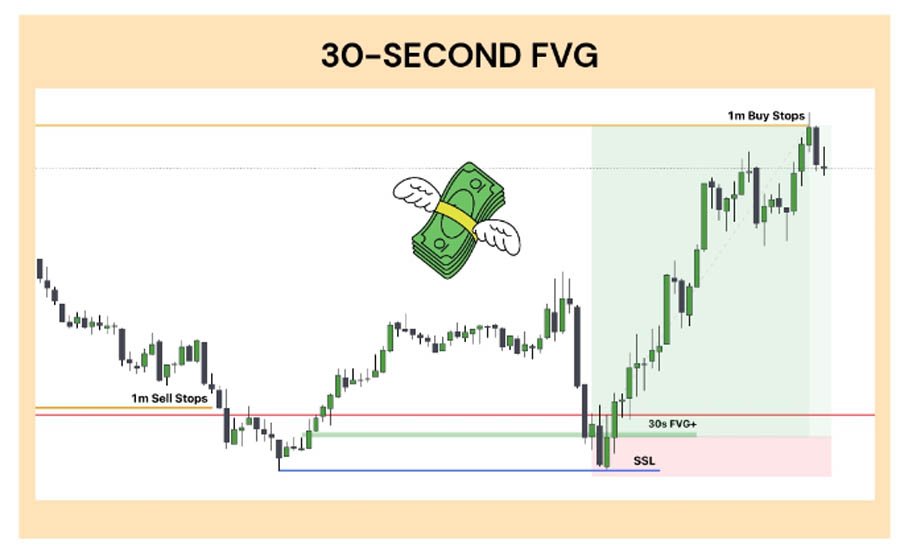
- Fair Value Gap Entry: The final step involves using the 30-second chart to find precise entry points. Traders look for Fair Value Gaps (FVGs) as potential entry zones.
The Importance of Multiple Timeframes
The ICT 30 Second Model utilizes a top-down approach, which is one of its key strengths. This multi-timeframe analysis allows traders to align their trades with larger market structures while capitalizing on short-term inefficiencies. The model typically uses the following timeframes:
- Higher timeframes (1-hour or 15-minute) for identifying the Draw on Liquidity (DOL)
- 5-minute or 1-minute chart for confirming stop runs and directional moves
- 30-second chart for precise entry timing using Fair Value Gaps (FVGs)
This approach helps traders to contextualize short-term price movements within the broader market trend, potentially leading to more accurate trade setups.
Implementing the ICT 30 Second Model in Your Trading
Step-by-Step Guide
- Identify Higher Timeframe Draw on Liquidity (DOL): Begin by outlining the expected price move for the 1-hour or 15-minute swing point. This step is crucial as it sets the overall direction for your trade. Look for significant swing highs or lows, or areas where price has shown strong reactions in the past. These levels often represent areas of liquidity that larger players in the market may target.
Read More: Mastering ICT Change In State Of Delivery: Your Comprehensive Guide
- Spot Stop Run: Move down to the 5-minute or 1-minute chart and look for a stop run against the direction you believe the draw is. For example, if your analysis suggests a bearish move (downward DOL), you should look for a run above a recent swing high. This move often traps traders on the wrong side of the market and can precede a reversal.
- Observe Rejection and Directional Move: After identifying the stop run, watch for a rejection of those higher (or lower) prices. This rejection should be followed by price beginning to trade in the direction of your identified DOL. This step confirms that the stop run was indeed a false move and that the market is likely to continue in your anticipated direction.
- Confirm with Candle Close: On the timeframe where the stop run occurred (5-minute or 1-minute), wait for a confirming candle close. In a bearish scenario, this would be a down-close candle. In a bullish scenario, look for an up-close candle. This candle serves as additional confirmation that the market is moving in your anticipated direction.
- Find Fair Value Gap Entry: Once the above conditions are met, drop down to the 30-second chart. Here, you’re looking for a Fair Value Gap (FVG) to form. An FVG is essentially a gap in price action that the market has yet to fill. These gaps often serve as excellent entry points as the market frequently returns to fill these inefficiencies.
- Set Stop Loss and Take Profit: After identifying your entry point, it’s crucial to set appropriate stop loss and take profit levels. The original model suggests using a fixed stop loss (e.g., 10-12 handles for indices) and aiming for a 1:1 risk-reward ratio. However, you might also consider using the identified DOL as your ultimate target.
Tools and Indicators
While the ICT 30 Second Model primarily relies on raw price action, there are several key elements and concepts that traders should be familiar with:
- Multiple Timeframe Analysis: Understanding how to interpret price action across different timeframes is crucial for this model.
- Fair Value Gaps: These are areas on the chart where price has moved so quickly that it’s left an imbalance. Identifying these gaps is key for finding entry points.
- Market Structure: This includes concepts like higher highs and higher lows (uptrend) or lower highs and lower lows (downtrend).
- Stop Runs and Liquidity Concepts: Understanding how large players in the market might try to trigger stop losses before moving price in the intended direction.
It’s essential to remember that while these tools and concepts are important, they should complement, not replace, the core principles of the ICT 30 Second Model. The power of this model lies in its ability to help traders read raw price action and market structure.
Advanced Techniques in the ICT 30 Second Model

Understanding External and Internal Liquidity
The concept of external and internal liquidity is crucial for this model and represents a more advanced understanding of market dynamics:
- External Liquidity: This refers to significant highs or lows that are taken out before a reversal occurs. External liquidity often represents levels where a large number of stop losses are placed.
- Internal Liquidity: This typically refers to Fair Value Gaps within the current price structure that price is likely to fill. These gaps represent inefficiencies in the market that often get resolved.
Understanding the interplay between external and internal liquidity can help traders anticipate market moves with greater accuracy.
Recognizing Complex Market Structure Shifts
While basic market structure involves identifying higher highs and higher lows (or vice versa), advanced traders learn to recognize more complex structural shifts:
- Change in Market Character: This involves noticing when the market transitions from trending to ranging, or vice versa.
- Hidden Divergences: These occur when price makes a new high (or low) but momentum indicators don’t confirm this move.
- Nested Market Structures: Understanding how smaller timeframe structures fit within larger timeframe structures.
Recognizing these complex structural elements can provide additional confirmation for trade setups and help in identifying potential reversal points.
Read More: Understanding And Trading With ICT Breaker Blocks In Forex
Incorporating Order Flow Analysis
While not explicitly part of the original model, some advanced traders incorporate order flow analysis to enhance their trading decisions:
- Volume Delta: This measures the difference between buying and selling volume, providing insights into the strength of moves.
- Footprint Charts: These display additional information about trading activity within each candle, helping to identify areas of high interest.
- Heat Maps: These visual tools can help identify areas of significant buying or selling pressure.
By incorporating order flow analysis, traders can gain additional insights into market dynamics, potentially improving their timing and conviction in trades.
Common Mistakes to Avoid When Using the ICT 30 Second Model
- Ignoring Higher Timeframes: Always consider the broader market context. The 30-second entries should align with the higher timeframe analysis.
- Rushing Entries: Wait for all the required conditions to be met before entering a trade. Patience is key in this model.
- Neglecting Risk Management: Stick to the recommended stop loss and risk-reward ratios. Don’t be tempted to widen stops or take premature profits.
- Overcomplicating the Strategy: While it’s tempting to add additional indicators or conditions, remember that the power of this model lies in its simplicity and focus on raw price action.
- Emotional Trading: Maintain objectivity and follow your trading plan. Don’t let the fast-paced nature of lower timeframe trading lead to impulsive decisions.
- Failing to Adapt: Market conditions change. Be prepared to step aside when the model isn’t performing well in current market conditions.
- Neglecting Fundamentals: While this is primarily a technical model, be aware of major economic events that could impact price action.
OpoFinance: Your Trusted Partner for ICT 30 Second Model Trading
When it comes to implementing sophisticated strategies like the ICT 30 Second Model, having a reliable and regulated forex broker is crucial. OpoFinance, an ASIC-regulated broker, offers traders a secure and advanced platform to execute their ICT 30 Second Model trades with confidence.
Key Benefits of Trading with OpoFinance:
- Regulatory Compliance: As an ASIC-regulated broker, OpoFinance ensures the highest standards of financial security and transparency.
- Advanced Trading Platforms: Access state-of-the-art platforms that support the detailed analysis required for the ICT 30 Second Model, including the ability to view 30-second charts.
- Fast Execution: Benefit from lightning-fast trade execution, essential for capitalizing on the short-term opportunities identified by the model.
- Educational Resources: Enhance your understanding of the ICT 30 Second Model with OpoFinance’s comprehensive educational materials.
- Social Trading: For those new to the ICT 30 Second Model, OpoFinance’s social trading feature allows you to learn from and copy the trades of successful ICT traders.
- Competitive Spreads: Enjoy tight spreads, which are particularly important when trading on lower timeframes like the 30-second chart.
- Robust Risk Management Tools: Utilize advanced risk management features to implement the stop loss and take profit levels required by the ICT 30 Second Model.
By choosing OpoFinance as your forex broker, you’re not just getting a trading platform – you’re gaining a partner committed to your success in mastering the ICT 30 Second Model and achieving your financial goals.
Read More: ICT Breaker Block Vs Mitigation Block
Conclusion
The ICT 30 Second Model represents a paradigm shift in forex trading, offering traders a unique approach to capitalizing on short-term market inefficiencies. By focusing on multi-timeframe analysis, market structure shifts, stop runs, and precise entries using fair value gaps, this model provides a framework for making informed trading decisions in a rapidly changing market environment.
The model’s emphasis on raw price action and market structure, combined with its systematic approach to trade identification and execution, sets it apart from many traditional trading strategies. It offers traders a way to potentially profit from the constant ebb and flow of liquidity in the forex market, particularly by identifying and capitalizing on institutional trading activity.
However, as with any trading strategy, success with the ICT 30 Second Model requires dedication, practice, and continuous learning. Traders must not only master the technical aspects of the model but also develop the mental discipline required to trade effectively on such short timeframes. Risk management remains paramount, and traders should always adhere to sound money management principles.
As the forex market continues to evolve, so too will the application of the ICT 30 Second Model. Traders who remain adaptable, continuously educate themselves, and stay attuned to changing market dynamics will be best positioned to benefit from this powerful trading approach.
Remember, the journey to mastering the ICT 30 Second Model is ongoing. Stay committed to your education, remain disciplined in your approach, and always prioritize risk management. With persistence and the right mindset, the ICT 30 Second Model could become a valuable addition to your forex trading arsenal, potentially leading to improved results and greater success in the challenging world of currency trading.
Q: Can the ICT 30 Second Model be applied to other financial markets besides forex?
While the ICT 30 Second Model was primarily developed for forex trading, its principles can potentially be applied to other liquid financial markets such as indices, commodities, and even some cryptocurrencies. However, traders should be aware that the model may require some adjustments to account for the specific characteristics of each market. It’s crucial to thoroughly test and validate the model’s effectiveness in any new market before using it with real capital.
How long does it typically take to become proficient in using the ICT 30 Second Model?
The time it takes to become proficient in the ICT 30 Second Model can vary greatly depending on the individual trader’s experience, dedication, and learning curve. Generally, it may take several months of consistent practice and study to gain a solid understanding of the model’s intricacies. Many traders report spending 3-6 months in demo trading before feeling confident enough to use the model with real money. Continued improvement and mastery can take years, as with any advanced trading strategy.
Are there any specific currency pairs that work best with the ICT 30 Second Model?
The ICT 30 Second Model can be applied to various currency pairs, but it tends to work best with highly liquid pairs that exhibit clear price action and volatility. Major pairs like EUR/USD, GBP/USD, and USD/JPY are often favored by traders using this model due to their tight spreads and consistent market activity. However, some traders also find success applying the model to certain volatile cross pairs. It’s important for each trader to test the model on different pairs and identify those that align best with their trading style and the model’s principles.


