In the highly competitive realm of forex trading, understanding the Inner Circle Trader (ICT) draw on liquidity is crucial. This advanced concept, integral for both novice and experienced traders, can significantly enhance your trading strategies by focusing on how the market seeks and interacts with liquidity. When working with a regulated forex broker, it becomes even more important to apply these strategies within a secure and compliant trading environment. This guide delves deeply into ICT draw on liquidity, offering comprehensive insights and actionable strategies to improve your trading decisions.

ICT draw on liquidity is a fundamental concept in forex trading that revolves around how financial markets attract and utilize liquidity at specific price levels. Liquidity—the ease with which an asset can be bought or sold without affecting its price—is essential for market functionality. For a regulated forex broker, understanding and utilizing liquidity effectively can lead to more strategic trades and optimized execution.
In this guide, we will explore the intricacies of ICT draw on liquidity, explaining its significance, how to identify key liquidity levels, and strategies to leverage this concept in your trading approach. By the end, you will have a robust understanding of how to harness liquidity to enhance your trading performance.
What Is Liquidity and Why Is It Important?
Understanding Liquidity
Liquidity refers to how quickly and easily an asset can be bought or sold in the market without affecting its price. High liquidity indicates a high volume of transactions, which allows for smoother execution of trades. Conversely, low liquidity can lead to price slippage and increased volatility.

In financial markets, liquidity is crucial because it facilitates efficient trading. For retail traders, liquidity ensures that orders can be executed promptly at desired prices. For institutional players, liquidity is even more critical as they execute large trades that require significant liquidity to avoid substantial price impacts.
The Role of Liquidity in Forex Trading
In forex trading, liquidity is a key factor that influences price movements and trading opportunities. It allows traders to enter and exit positions without significantly affecting the market price. High liquidity typically occurs during major trading hours when global markets are active, resulting in tighter spreads and more favorable trading conditions.
Liquidity also helps in determining market trends. By analyzing liquidity levels at various price points, traders can predict potential price movements and identify key support and resistance levels. This understanding of liquidity can be leveraged to make more informed trading decisions and manage risks effectively.
The Concept of ICT Draw on Liquidity
Defining ICT Draw on Liquidity
ICT draw on liquidity refers to the market’s tendency to move towards areas of high liquidity. These areas are often found at significant price levels such as old highs, old lows, and equal highs or lows. The market seeks out these liquidity zones to fill pending orders and execute trades.
This concept is grounded in the observation that financial markets exhibit patterns in how they attract and use liquidity. By identifying these patterns, traders can better predict where the market is likely to move next, allowing for more strategic entries and exits.
Key Liquidity Levels
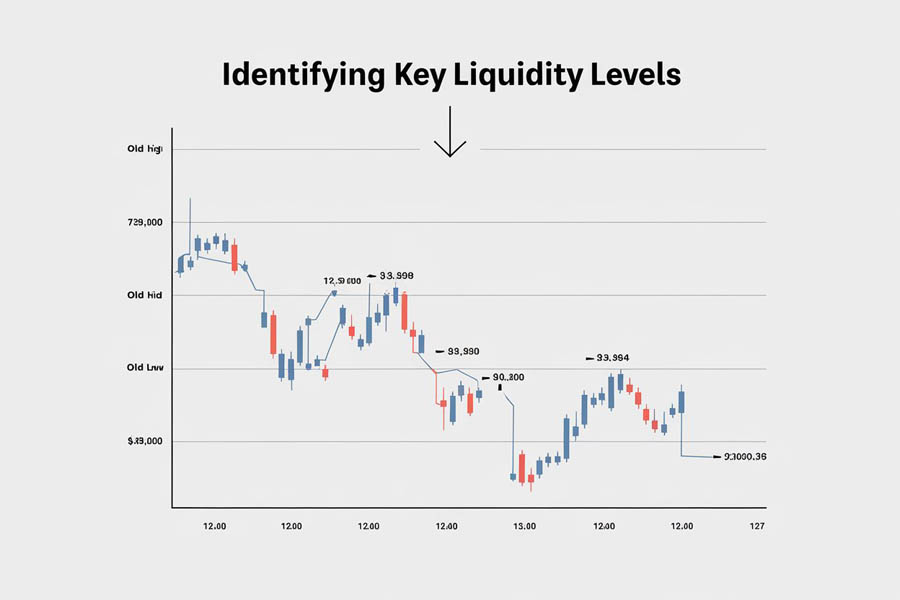
Key liquidity levels include:
- Old Highs and Lows: Historical price levels where significant trading activity occurred. The market often revisits these levels to fill orders.
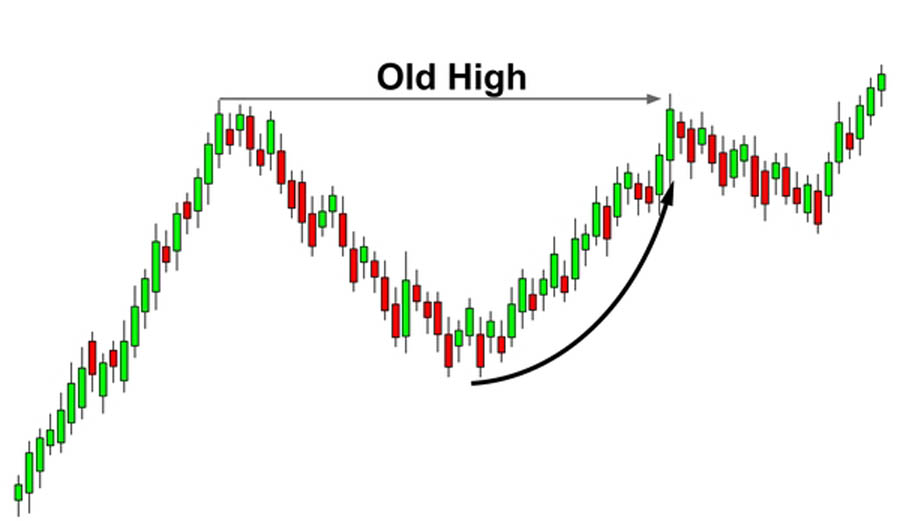
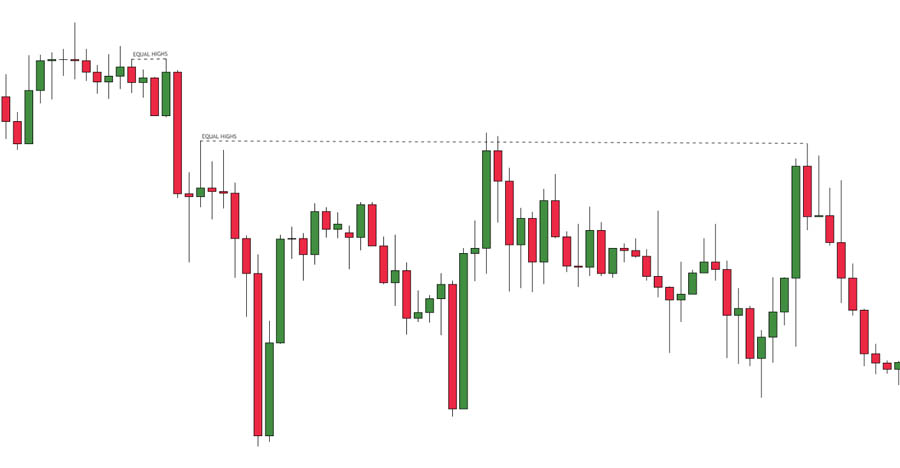
- Equal Highs and Lows: Price levels where multiple highs or lows align. These levels attract liquidity as institutions seek to execute large orders.
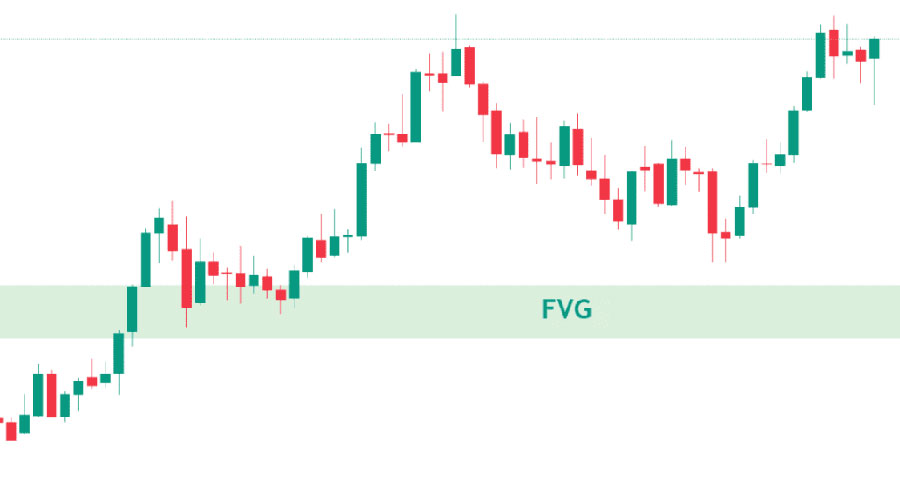
- Fair Value Gaps: Areas where there has been a significant price move without corresponding trading activity. The market often revisits these gaps to balance out price discrepancies.
Understanding these levels is crucial for applying ICT draw on liquidity effectively. By identifying where liquidity is likely to accumulate, traders can position themselves strategically to take advantage of anticipated price movements.
How to Identify Liquidity Zones
Identifying liquidity zones in Forex is crucial for making informed trading decisions, as these zones often represent areas where substantial market activity occurs. Liquidity zones are locations on a chart where traders can expect significant buying or selling pressure, which can influence price movement. Here’s a comprehensive guide on how to identify these zones:
1. Recognize Key Liquidity Patterns
Equal Highs and Lows:
- Definition: Equal highs and lows are price levels where the market has repeatedly reached the same high or low, indicating strong support or resistance.
- Identification: Look for multiple touches at the same price level on your chart. For example, if the price repeatedly fails to break above a certain high or below a certain low, this creates a liquidity zone.
- Significance: These levels often attract stop-loss orders from traders who believe in the trend, making them key areas where smart money may look to enter or exit positions.
Double or Triple Bottoms/ Tops:
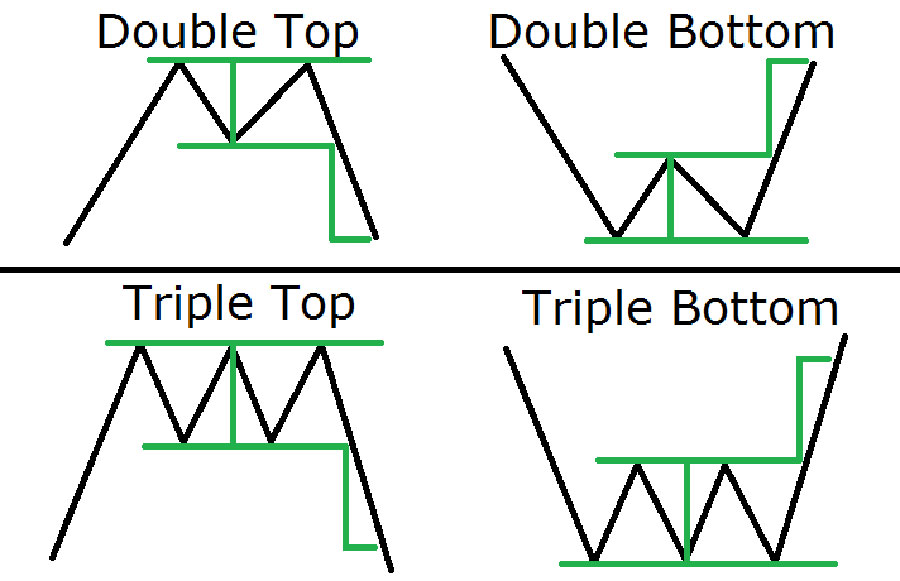
- Definition: These are chart patterns where the price forms two or three bottoms (in an uptrend) or tops (in a downtrend) at the same price level.
- Identification: These patterns can be spotted by identifying price points that consistently test the same support or resistance level.
- Significance: Such formations often indicate that a liquidity zone is forming as traders place their stop-loss orders around these critical levels.
2. Examine Fair Value Gaps (FVGs)
Fair Value Gap (FVG):
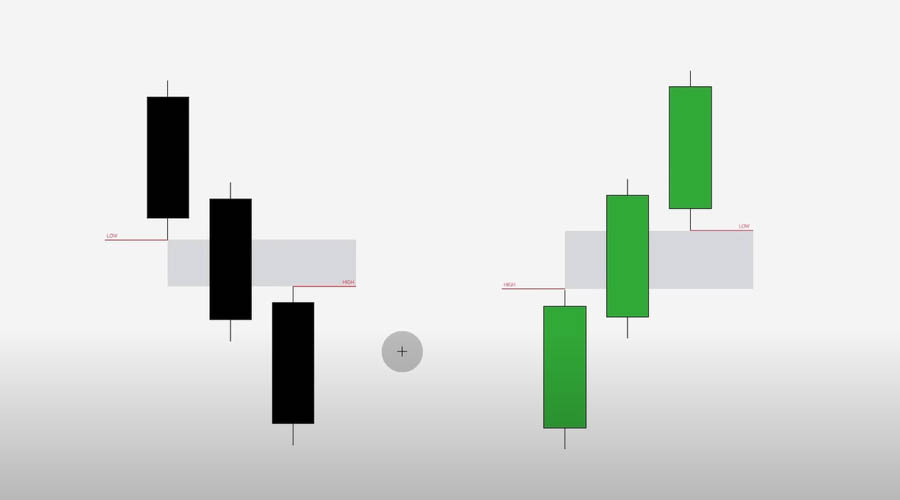
- Definition: An FVG is a price range where there is a significant imbalance between supply and demand, often due to a rapid price move that leaves a gap.
- Identification: Use tools like the Fibonacci retracement or simply observe areas where the price has moved quickly, leaving a gap in price action. These gaps usually represent areas of high liquidity.
- Significance: These gaps act as magnets for price movements, where the market may return to fill the gap before continuing in the original direction. This makes FVGs vital in spotting potential entry points.
3. Analyze Market Structure and Price Action
Swing Highs and Lows:
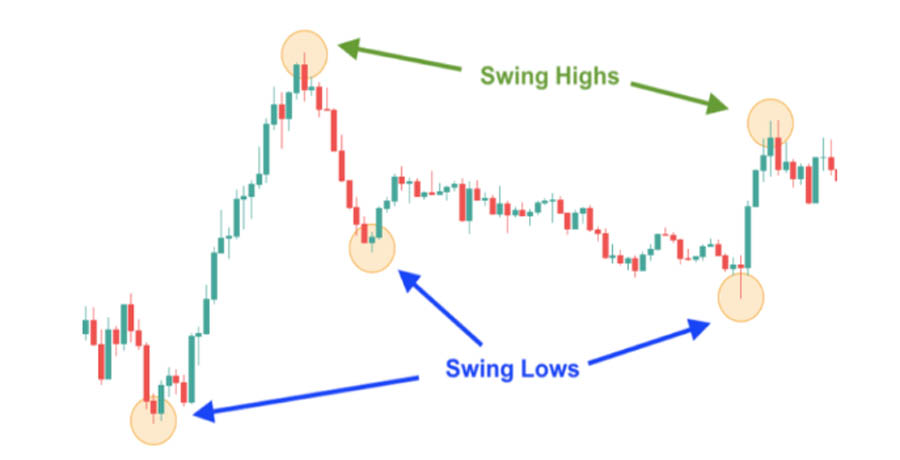
- Definition: Swing highs are the peaks in a price uptrend, while swing lows are the troughs in a downtrend.
- Identification: Identify these points by observing where the price makes significant highs or lows between trends.
- Significance: These points often attract liquidity as they are natural levels where traders might place stop-loss orders or expect reversals, creating potential liquidity zones.
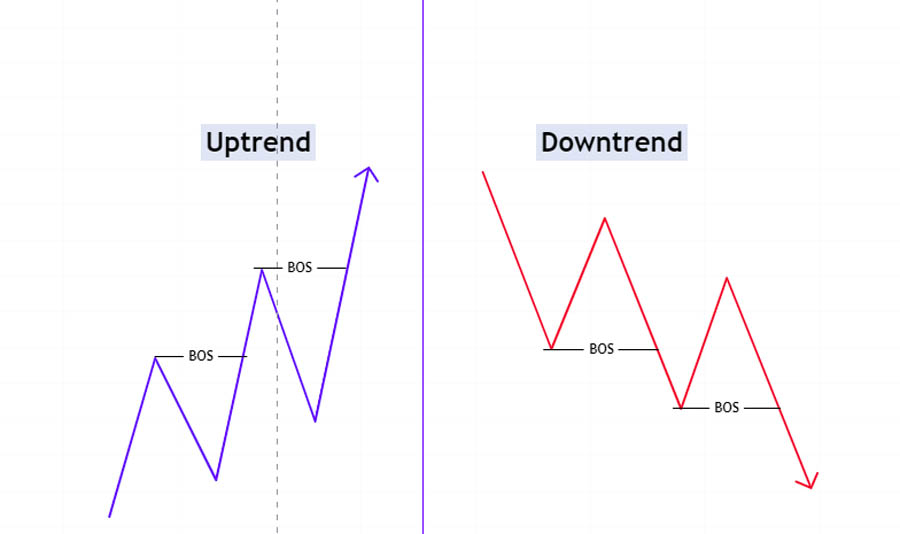
- Definition: A break of structure occurs when the price moves past a previous high or low, indicating a potential shift in market dynamics.
- Identification: Track the price action to see if it breaks through previous highs or lows. This can signal areas where liquidity is likely to be concentrated.
- Significance: These breaks often lead to liquidity zones as traders adjust their positions, creating potential opportunities for smart money to enter or exit trades.
4. Identify Major Supply and Demand Zones
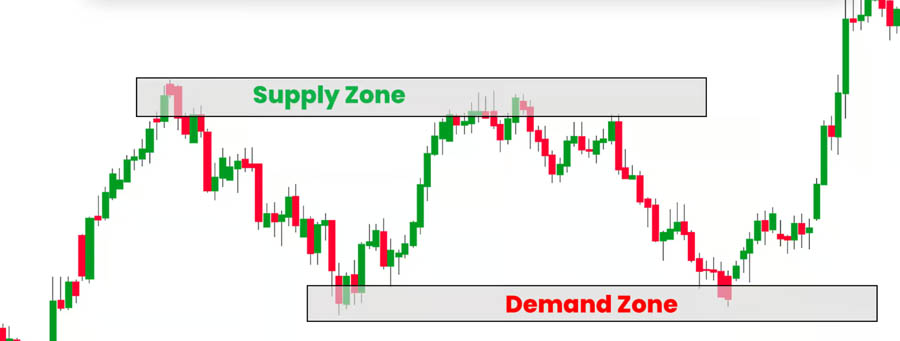
Supply Zones:
- Definition: Supply zones are price levels where selling pressure exceeds buying pressure, often leading to a drop in price.
- Identification: Look for areas where the price has reversed significantly in the past, indicating strong resistance.
- Significance: These zones attract liquidity as traders expect price to react at these levels, making them critical for identifying potential entry or exit points.
Demand Zones:
- Definition: Demand zones are price levels where buying pressure exceeds selling pressure, often leading to an increase in price.
- Identification: Identify these zones by observing areas where the price has previously reversed upward, suggesting strong support.
- Significance: These areas often gather liquidity as traders anticipate a price bounce, creating opportunities for smart money to enter trades.
5. Monitor Price Reaction at Key Levels
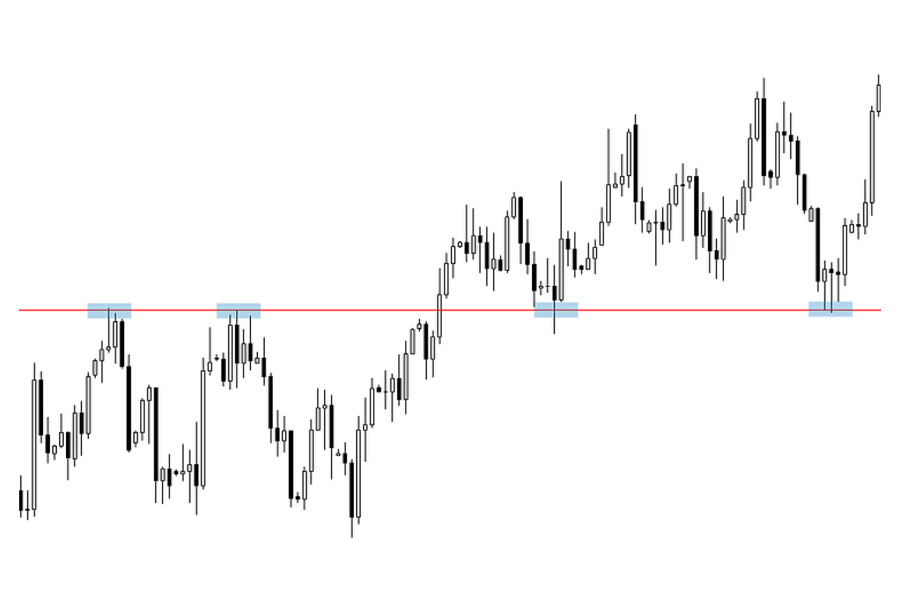
Price Reaction Analysis:
- Definition: Observing how the price behaves at certain levels can reveal important liquidity zones.
- Identification: Watch for sudden spikes in volume or rapid price movements at key levels, indicating where liquidity is concentrated.
- Significance: These reactions can signal where liquidity is present, helping traders identify zones where the market may experience increased activity.
Read More: Identify Liquidity Zones In Forex
6. Utilize Volume Analysis
Volume Spikes:
- Definition: Volume spikes indicate areas where there is a surge in trading activity.
- Identification: Use volume indicators or observe large bars on your volume chart to identify these spikes.
- Significance: High volume often correlates with liquidity zones, as large trades can influence price movement and indicate areas of significant market interest.
Strategies for Leveraging ICT Draw on Liquidity
1. Multi-Time Frame Analysis
Multi-time frame analysis involves examining price action across different time frames to identify liquidity zones. By analyzing multiple time frames, traders can gain a comprehensive view of market trends and liquidity levels.
For example, if you are trading on a five-minute chart, examine daily, four-hour, and one-hour charts to identify key liquidity zones. This approach helps align your trades with broader market trends and increases the accuracy of your trading decisions.
2. Waiting for Confirmations
Patience is crucial when trading based on liquidity. Wait for confirmation signals such as price reversals, breakouts, or displacement before entering a trade. Confirmations help ensure that the market is indeed moving towards the identified liquidity zone.
Confirmation signals can include technical patterns, such as candlestick formations or trend lines, that indicate a potential shift in market direction. By waiting for these signals, traders can avoid premature entries and increase their chances of successful trades.
3. Managing Risks with Stop-Loss Orders
Stop-loss orders are essential for managing risks in forex trading. Place stop-loss orders at strategic points, such as just beyond a key liquidity level, to protect your capital while allowing enough room for the trade to develop.
By setting stop-loss orders at appropriate levels, traders can minimize potential losses and ensure that their trades are executed within acceptable risk parameters.
4. Integrating Market Sentiment Analysis
Market sentiment analysis involves understanding the overall mood of the market. By analyzing factors such as news events, economic data, and trader sentiment, traders can gain insights into potential liquidity zones and market direction.
Sentiment indicators, such as the Commitment of Traders (COT) report or sentiment surveys, can provide additional context for liquidity analysis. By integrating sentiment analysis with liquidity strategies, traders can enhance their decision-making process and improve their trading outcomes.
Read More: Mastering ICT Liquidity Pool Trading
Advanced Concepts in ICT Draw on Liquidity
1. High Resistance vs. Low Resistance Liquidity Runs
Understanding High Resistance Liquidity Runs (HRLR) and Low Resistance Liquidity Runs (LRLR) is crucial for advanced liquidity analysis. HRLR occurs when the market fails to move beyond a previous high or low, indicating strong resistance. LRLR happens when the market fails to take out previous highs or lows, suggesting a more fluid price movement.
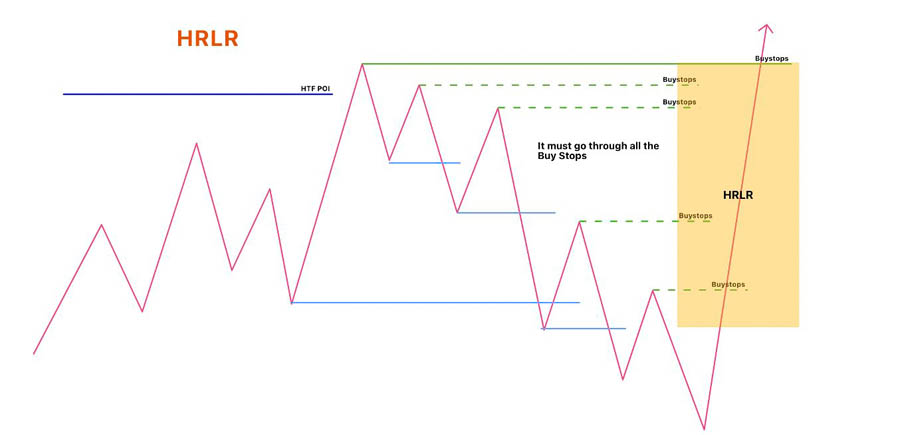
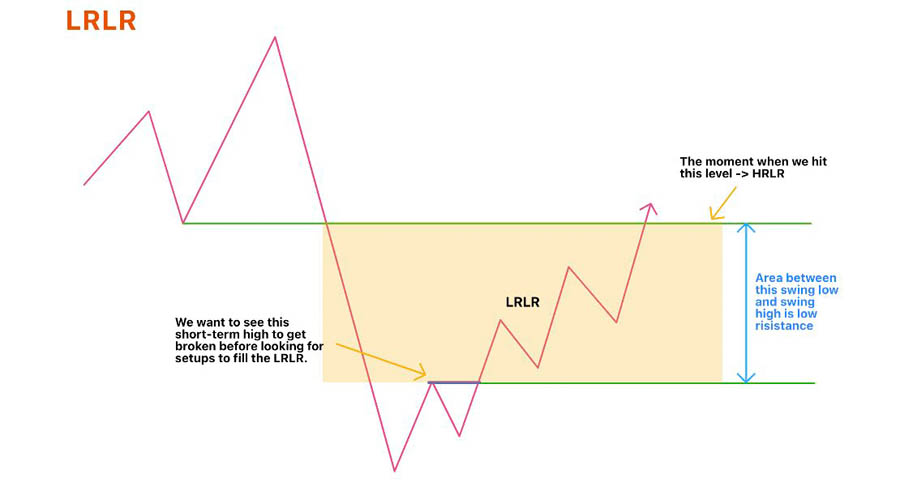
HRLR and LRLR can provide insights into potential price movements and help traders identify optimal entry and exit points. By analyzing these resistance conditions, traders can make more informed decisions and enhance their trading strategies.
2. Annotating Price and Liquidity Zones
Annotating price and liquidity zones involves marking key levels on your charts to track price movements and liquidity patterns. This process helps in visualizing potential liquidity zones and monitoring their impact on market behavior.
Chart annotations can include marking historical highs and lows, fair value gaps, and order blocks. By keeping track of these annotations, traders can identify recurring liquidity patterns and improve their trading strategies.
3. Utilizing Order Flow Analysis
Order flow analysis involves studying the flow of buy and sell orders to gain insights into market liquidity and potential price movements. By analyzing order flow, traders can identify areas of high trading activity and anticipate liquidity draws.
Order flow tools, such as order book analysis or depth-of-market (DOM) data, can provide valuable insights into market liquidity and trader behavior. By incorporating order flow analysis into your trading strategy, you can gain a deeper understanding of liquidity dynamics and improve your trading decisions.
Read More: ICT Internal And External Range Liquidity
Opofinance Services: Enhance Your Trading Experience
For traders seeking a reliable and regulated forex broker, Opofinance offers a range of services designed to enhance your trading experience. As an ASIC-regulated broker, Opofinance provides a secure and transparent trading environment, ensuring that your trades are executed with confidence.

One of the standout features of Opofinance is its social trading service. This platform allows you to follow and replicate the trades of experienced traders, providing valuable insights and strategies. Social trading is particularly beneficial for those who want to learn from successful traders and enhance their trading skills.
Opofinance’s social trading service offers several advantages:
- Access to Expert Strategies: Follow top traders and benefit from their expertise.
- Diversified Trading Approaches: Explore different trading strategies and techniques.
- Enhanced Learning Opportunities: Learn from successful traders’ decision-making processes.
By leveraging Opofinance’s social trading service, you can improve your trading skills and achieve better results in the forex market.
Conclusion
Mastering ICT draw on liquidity is essential for optimizing your forex trading strategy. By understanding how the market seeks and utilizes liquidity, you can make more informed trading decisions, enhance your trade entries and exits, and manage risks effectively.
Utilize the insights and strategies outlined in this guide to improve your trading approach. Remember to choose a regulated forex broker like Opofinance to ensure a secure trading environment. With the right tools and knowledge, you can harness the power of ICT draw on liquidity to achieve consistent trading success.
How Can I Start Implementing ICT Draw on Liquidity in My Trading?
Begin by studying historical price data to identify key liquidity levels such as old highs, old lows, and fair value gaps. Use technical indicators and market reactions to confirm these levels, and practice incorporating this analysis into your trading strategy.
What Are the Main Risks of Trading Without Liquidity Knowledge?
Trading without understanding liquidity can result in poor trade executions, increased risk of slippage, and missed trading opportunities. Lack of liquidity knowledge may also lead to higher volatility exposure and potential losses.
How Can I Combine ICT Draw on Liquidity with Other Trading Techniques?
Combine ICT draw on liquidity with other techniques such as technical analysis, trend following, and sentiment analysis. Integrating multiple strategies can provide a more comprehensive trading approach and enhance overall decision-making.


