

In the ever-evolving world of Forex trading, understanding the complexities of market movements is a key determinant of success. One of the most sophisticated concepts that traders must grasp is the ICT Market Structure. Developed by the Inner Circle Trader (ICT), this advanced trading strategy is centered around the understanding of how markets behave, particularly in relation to institutional order flow, market imbalances, and critical levels of support and resistance. Working with a regulated forex broker ensures that traders operate in a secure and transparent environment, which is essential when applying such advanced strategies. This comprehensive guide will explore the depths of the ICT Advanced Market Structure, breaking down its core concepts, phases, and the practical ways traders can apply this knowledge for more precise and profitable trading.
Understanding ICT Market Structure
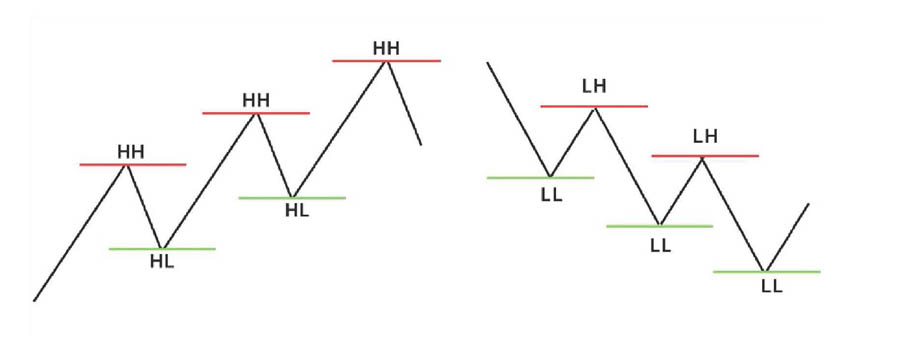
ICT Market Structure is a term that describes the way markets form and shift, typically represented by the creation of higher highs and higher lows in a bullish market, or lower highs and lower lows in a bearish market. This structure is shaped by numerous factors, including institutional trading activity, liquidity, and specific price levels that hold significant importance. Unlike basic technical analysis, the ICT approach goes beyond mere trend identification; it seeks to understand the underlying forces that drive these market movements.
Core Concepts of ICT Market Structure
1. Market Structure for Precision Technicians
At the heart of the ICT methodology is the concept of market structure, which is essential for traders aiming for precision in their market entries and exits. The market structure, as defined by ICT, is broken down into distinct phases and levels, enabling traders to identify the market’s current state and anticipate future movements with greater accuracy.
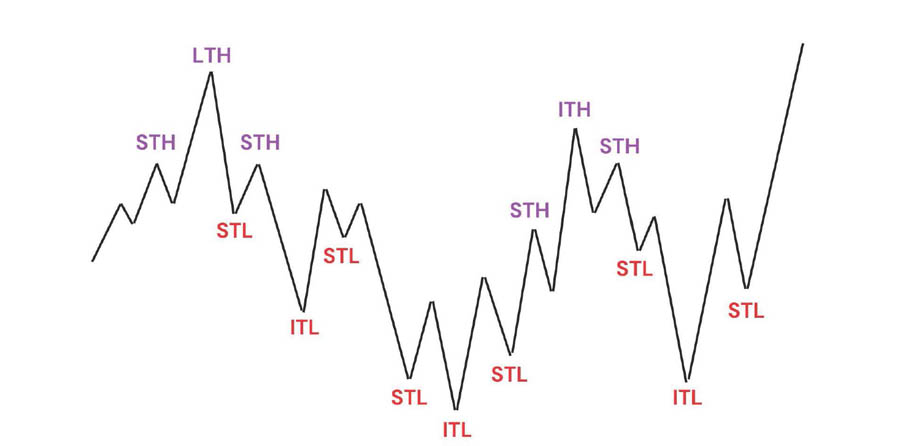
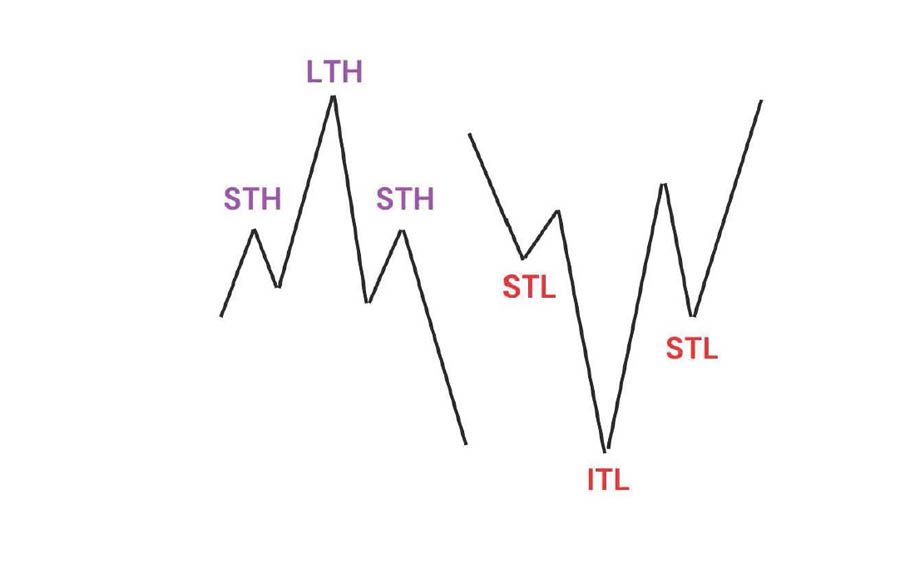
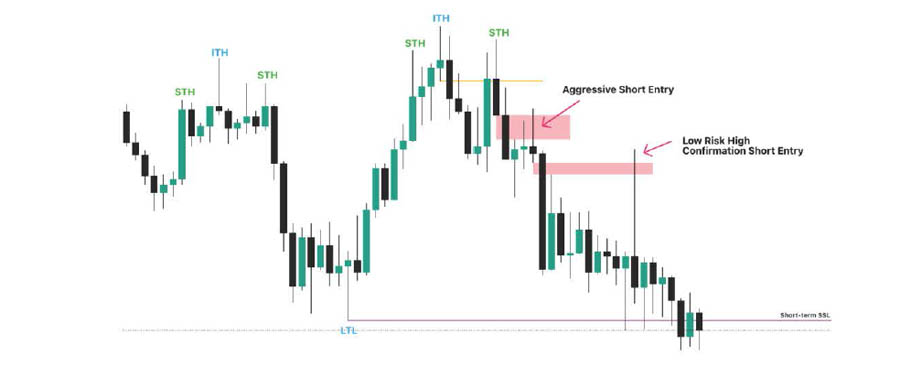
- Short-Term Highs and Lows (STH and STL): These are the fundamental building blocks of market structure. The market generally oscillates between these short-term highs and lows, creating a recognizable pattern that traders can use to gauge market direction.
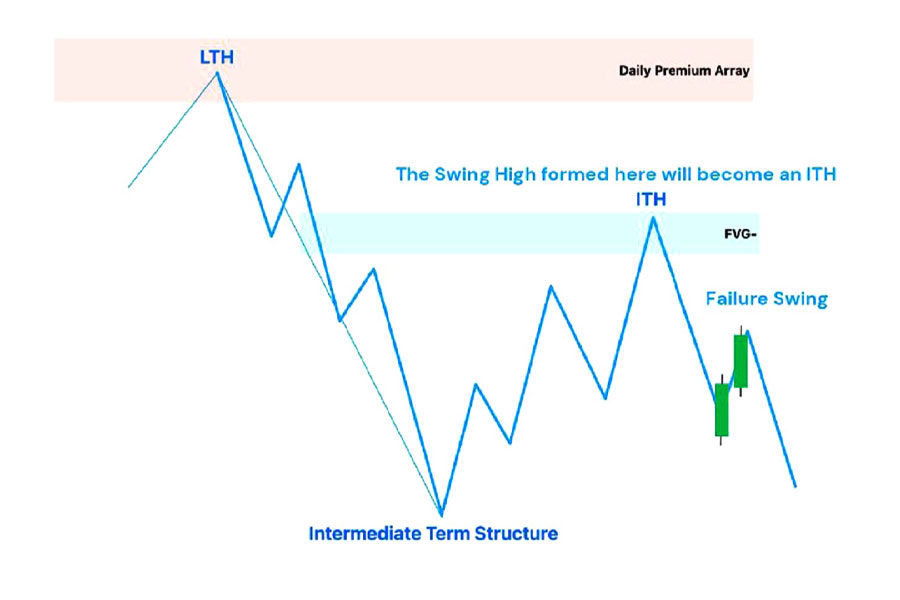
- Intermediate Term Highs and Lows (ITH and ITL): When a short-term low (STL) has higher STLs on both sides, it transitions into an Intermediate Term Low (ITL). Similarly, a short-term high (STH) surrounded by lower STHs becomes an Intermediate Term High (ITH). These intermediate levels provide further clarity on the market’s direction.
- Long-Term Highs and Lows (LTH and LTL): These are the most significant levels within the market structure. An ITL that has higher ITLs on both sides is classified as a Long-Term Low (LTL), while an ITH surrounded by lower ITHs is recognized as a Long-Term High (LTH). These long-term levels are critical for identifying major shifts in the market.
These classifications within the market structure are vital for traders looking to pinpoint key points of market activity where significant movements are likely to occur. By understanding these points, traders can make more informed and precise trading decisions.
2. The Interbank Perspective on Market Structure
Retail traders often have a limited perspective when it comes to market structure, typically focusing on basic price patterns. However, the ICT methodology encourages traders to adopt the perspective of Interbank Traders, who view price action through the lens of liquidity, imbalances, and institutional activity. This approach offers a more nuanced understanding of market movements, revealing opportunities that may not be apparent to those relying solely on traditional technical analysis.
- Higher Time Frame (HTF): This is the most crucial timeframe, providing a long-term perspective that reveals significant levels of support and resistance. These levels often serve as the foundation for trade setups, as they indicate where the institutional traders are likely to act.
- Intermediate-Term Perspective: This timeframe adds more definition to the market structure, offering traders a clearer view of the market’s directional bias and helping with the management of trades once they are in progress.
- Short-Term Perspective: The short-term timeframe provides the finest details within the market structure. It allows traders to time their entries and exits with precision, aligning their trades with the broader market direction.
By understanding these different perspectives, traders can align their strategies with the behavior of institutional players, which significantly increases the likelihood of executing successful trades.
Intermediate Term Highs (ITH) in ICT Market Structure
In the context of the ICT Market Structure, Intermediate Term Highs (ITH) are pivotal indicators that provide insights into the market’s strength or weakness. Recognizing these levels is essential for traders who wish to stay in sync with the market’s underlying momentum.
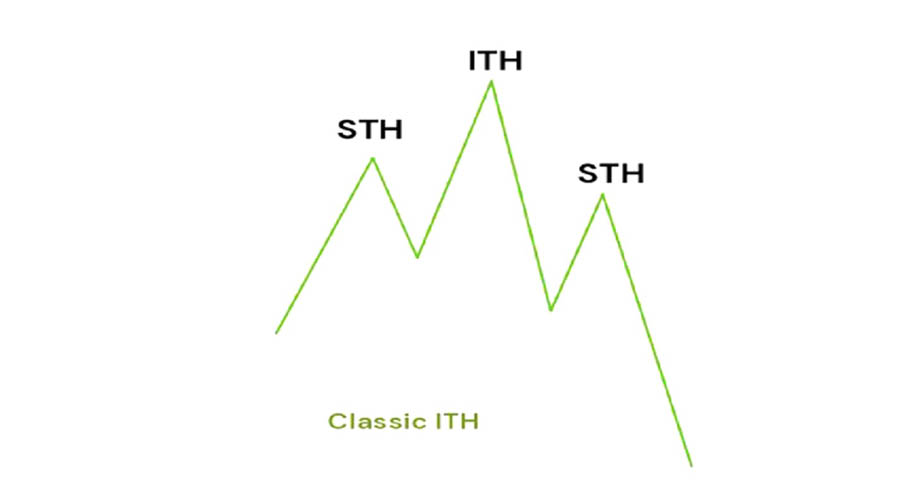
1. Classic ITH
- Formation: A Classic ITH is identified when a short-term high (STH) forms after an existing Intermediate Term High (ITH). Traders typically monitor these formations to determine potential short-selling opportunities, as they may signal the end of a bullish movement.
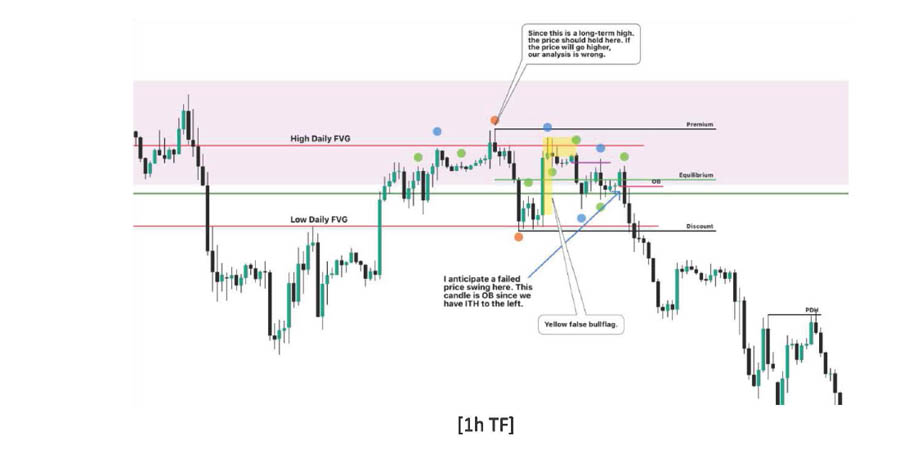
- Break of ITH: If the market breaks through an ITH, it may indicate that the initial analysis was incorrect. This breach suggests that the market is not as weak as anticipated, prompting traders to reconsider their positions and possibly wait for the market to realign before taking action.
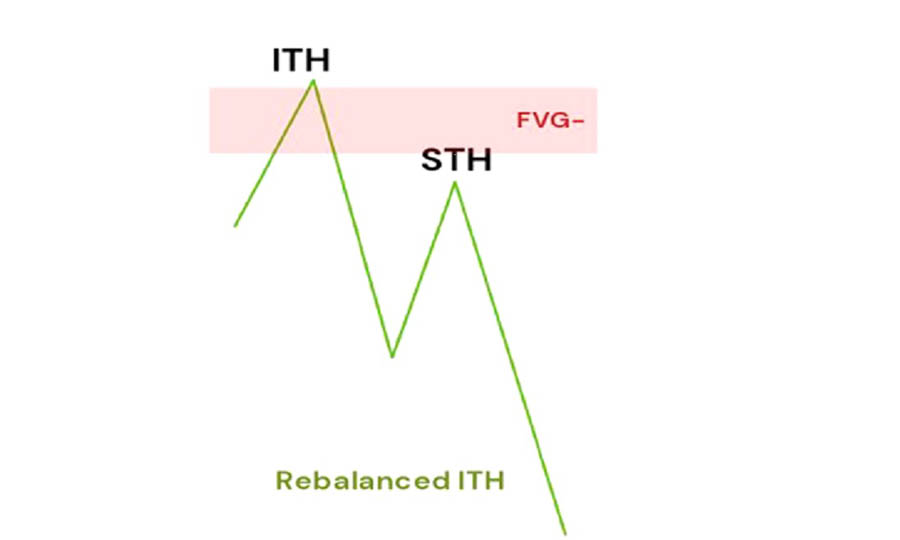
2. Rebalanced ITH
- Market Weakness: The Rebalanced ITH is a powerful indicator of market weakness. It occurs when the market attempts to retest a previous ITH but fails to break above it. This failure signals that the market may be losing momentum and could be preparing for a significant downturn.
The Importance of Market Narrative in ICT Market Structure
Successfully trading within the ICT Market Structure requires a deep understanding of the prevailing market narrative. The market narrative is essentially the story that the market is telling at any given time, shaped by liquidity conditions, institutional activity, and broader economic factors. This narrative helps traders determine the daily bias, which is the expected market direction for the day.
- Liquidity Draw: One of the core concepts in ICT is the liquidity draw, which refers to the market’s tendency to move towards areas of high liquidity, such as previous highs or lows. Understanding where the market is likely to seek liquidity is crucial for establishing the daily bias, which guides traders in making informed decisions about whether to buy or sell.
Read More: Mastering ICT Draw on Liquidity
Traders who fail to grasp the market narrative and the liquidity conditions are often susceptible to falling for false breaks in market structure. Therefore, it is imperative to thoroughly assess the market’s likely direction before entering a trade.
Key Phases in ICT Market Structure
The market operates within three key phases, each with its unique characteristics and implications for traders. Recognizing these phases is essential for understanding the market’s overall behavior and for identifying the best moments to enter or exit trades.
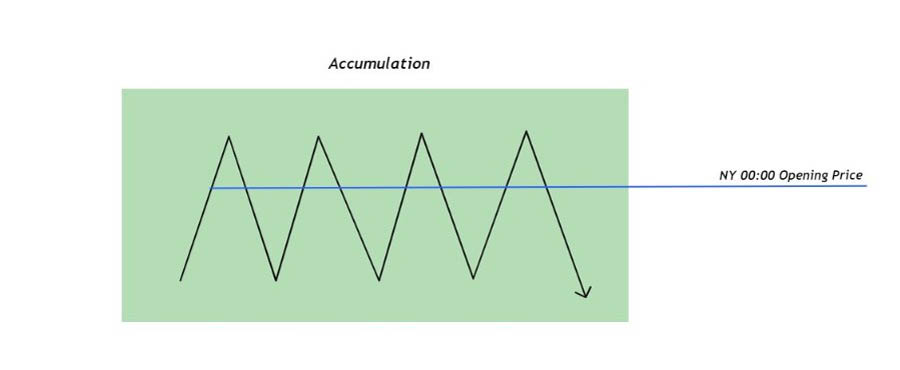
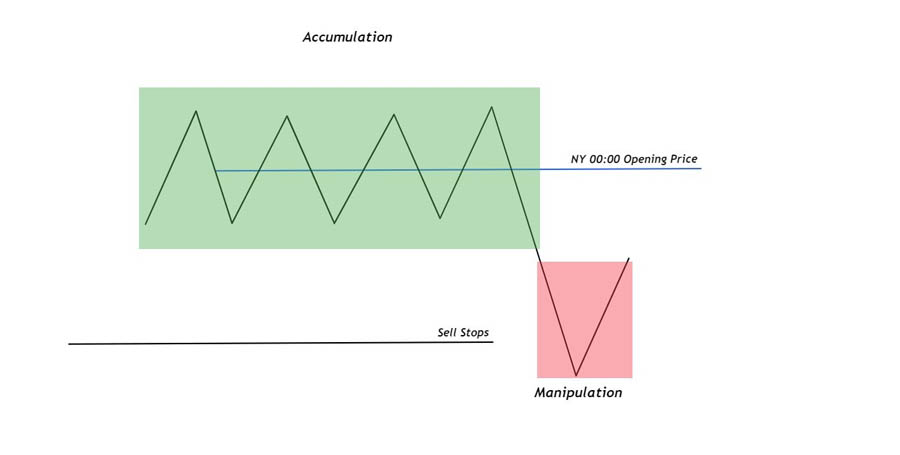
1. Accumulation Phase
The accumulation phase is the period where institutional traders, or market makers, begin building their positions. During this phase, there is usually minimal price movement as these large players accumulate assets without significantly affecting the market’s direction. Recognizing the accumulation phase allows traders to anticipate future price movements, positioning themselves to take advantage of the subsequent phases.
2. Manipulation Phase
The manipulation phase follows the accumulation phase and is often characterized by sudden, unexpected price movements. This phase is driven by factors such as market sentiment, news events, or economic data releases, which cause weaker market participants to react predictably, often in ways that benefit the market makers. Traders who can identify the manipulation phase are better equipped to avoid common traps and can potentially profit from the predictable behaviors of less informed participants.
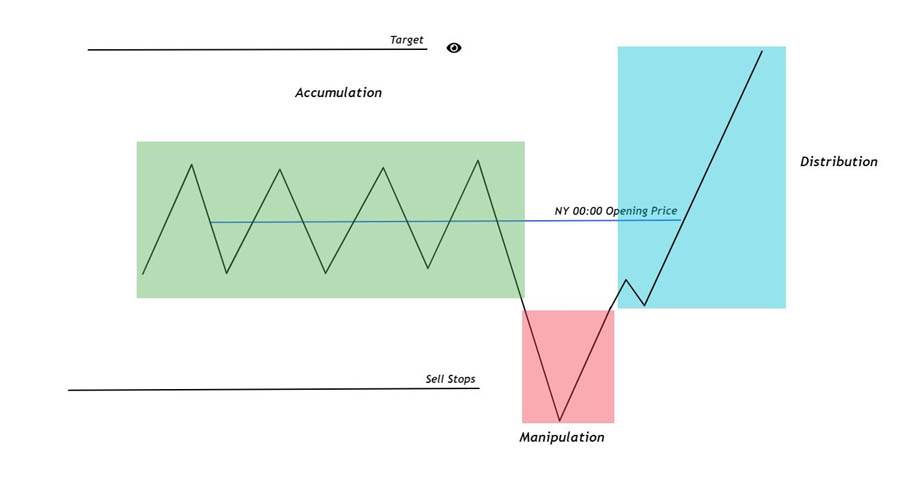
3. Distribution Phase
The distribution phase is the final stage, where the positions accumulated during the accumulation phase are gradually offloaded by the market makers. This phase often signals the end of a trend and the beginning of a reversal or a period of consolidation. For traders, the distribution phase is a critical point to consider exiting their positions or preparing for a shift in market direction.
Building the ICT Market Structure from Narrative
The process of building the ICT Market Structure begins with a thorough understanding of the market narrative. This narrative forms the foundation upon which traders analyze the market’s behavior and make their trading decisions. The narrative includes various elements, such as economic indicators, geopolitical events, and institutional activity, all of which contribute to shaping the market structure.

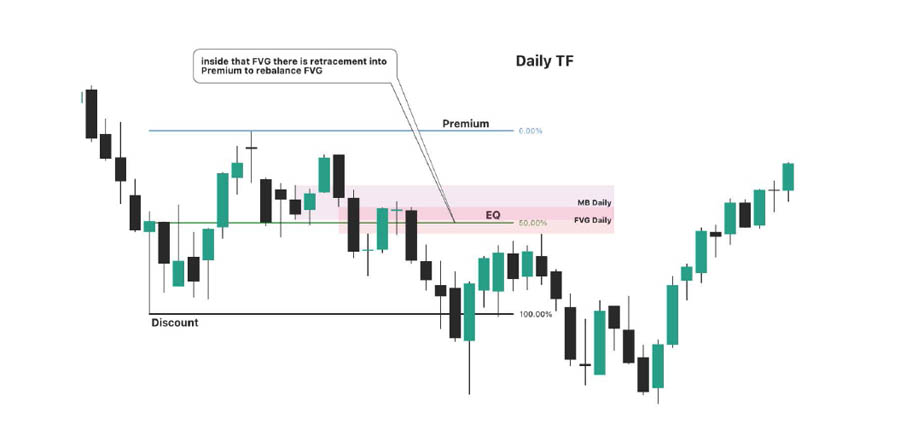
1. Identifying Key Support and Resistance Levels
One of the first steps in building the ICT Market Structure is identifying the key support and resistance levels, which are often referred to as “PD arrays” within the ICT framework. These levels are typically derived from the highest timeframe available and serve as crucial reference points for determining the market’s directional bias. Without these levels, it becomes challenging to establish a coherent narrative or to anticipate future price movements.
2. Smart Money Reversal (SMR)
A Smart Money Reversal (SMR) occurs at a key support or resistance level and signals a potential change in the market’s direction. This concept is central to the ICT methodology, as it reflects the actions of institutional players who have the power to influence market trends. Recognizing an SMR is essential for timing entries and exits, as it often precedes significant market movements.
3. Market Structure Break (MSB/BMS)
A break in market structure, often referred to as MSB (Market Structure Break) or BMS (Break in Market Structure), is a pivotal moment in the market where the previous trend is invalidated. However, a market structure break is not always a signal to enter a trade. It must be considered within the context of the overall market narrative and the alignment of the daily candle with the higher timeframe’s direction. Only when these factors are in sync does an MSB provide a reliable entry signal.
Read More: Master The ICT Market Structure Break (MSB)
Applying ICT Advanced Market Structure in Trading
The ICT Advanced Market Structure is a practical framework that can significantly enhance your trading strategy by providing insights into market behavior. Here’s how you can apply these principles effectively:
1. Aligning with the Higher Time Frame (HTF)
Aligning your trading strategy with the Higher Time Frame (HTF) is crucial as this is where institutional traders primarily operate. The HTF, such as daily, weekly, or monthly charts, helps you identify major support and resistance levels where significant market movements are likely to occur.
- Institutional Influence: Institutional traders, who trade large volumes, tend to drive long-term trends. By aligning with HTF trends, you increase the likelihood of trading in the direction of the market’s broader movement.
- Trend Identification and Noise Reduction: The HTF provides a clear view of the prevailing trend, whether bullish or bearish, and helps filter out the noise present in lower timeframes, allowing for more strategic and less reactive trading.
2. Utilizing Intermediate and Short-Term Perspectives
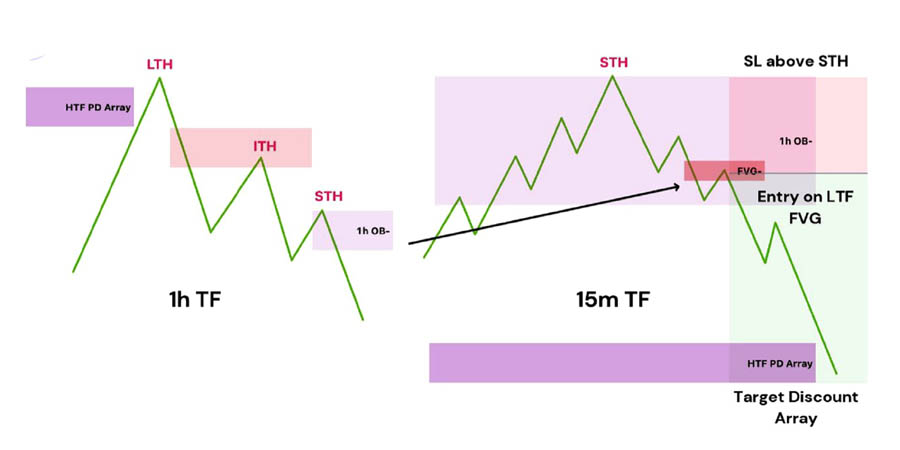
Once aligned with the HTF, use intermediate (4-hour or daily) and short-term (15-minute or 1-hour) timeframes to fine-tune your strategy.
- Intermediate Timeframe (ITF): The ITF acts as a bridge, helping you manage trades by monitoring intermediate trends and refining key HTF levels for more accurate entries and exits. It’s crucial for adjusting stop-losses and take-profit levels as the market evolves.
- Short-Term Timeframe (STF): The STF is used to pinpoint precise entry and exit points, allowing you to capitalize on short-term price movements that align with the overall market structure. This precision is vital for minimizing risk and enhancing trade efficiency.
3. Recognizing Market Weakness and Strength
Identifying the market’s strength or weakness through Classic and Rebalanced Intermediate Term Highs (ITHs) and Lows (ITLs) is essential for informed decision-making.
- Classic ITHs and ITLs: These levels represent key areas of resistance and support. Observing how the market behaves around these levels helps determine its strength (if it’s making higher highs) or weakness (if it’s failing to breach previous highs).
Recognizing these dynamics allows you to anticipate market moves more accurately and align your trading decisions with the prevailing market conditions.
4. Monitoring Market Phases
Understanding the market phases Accumulation, Manipulation, and Distribution—is vital for anticipating market behavior.
- Accumulation: A phase of low volatility where institutional traders accumulate positions. Recognizing this phase can help you position your trades ahead of major moves.
- Manipulation: A phase characterized by sharp movements designed to trigger stop-losses and generate liquidity. Being aware of this phase helps avoid false signals and better timing of trades.
- Distribution: The phase where institutions unload positions, often leading to increased volatility. Exiting trades during this phase can protect profits.
5. Using Market Structure Breaks Wisely
Market structure breaks can signal significant shifts in market direction. However, these breaks should be used judiciously, ensuring they align with the HTF direction for higher success probability.
- Alignment with HTF: Before acting on a market structure break, confirm that the daily candle aligns with the HTF trend. This alignment ensures that your trades are supported by the broader market momentum, reducing the risk of false signals and increasing the likelihood of a successful trade.
By applying these principles, traders can better navigate the complexities of the Forex market, improving their chances of success through a structured and informed approach.
Common Mistakes in Understanding ICT Market Structure
Even experienced traders can make mistakes when applying the ICT Market Structure. Here are some common pitfalls to avoid:
1. Ignoring the Higher Time Frame
One of the biggest mistakes is ignoring the higher timeframe. The HTF provides the most reliable signals, and trading against it often leads to losses.
2. Misinterpreting Market Phases
Misinterpreting the market phases can lead to premature entries or exits. Ensure you fully understand the accumulation, manipulation, and distribution phases before making a trade.
3. Overlooking Liquidity Conditions
Liquidity is a key factor in the ICT Market Structure. Failing to assess liquidity conditions properly can result in false signals and poor trading decisions.
Advanced Techniques in ICT Market Structure
For those looking to take their understanding of the ICT Advanced Market Structure to the next level, here are some advanced techniques to consider:
1. Killzone Trading
Killzone trading refers to the periods when major financial centers are opening or closing. These times often see significant market movements and can be prime opportunities for executing trades based on the ICT Market Structure.
2. Using Fibonacci Standard Deviations for Target Projections
Fibonacci standard deviations can be used to project potential targets in the market. By combining these projections with the ICT Market Structure, traders can set more accurate profit targets and stop losses.
3. Incorporating Multiple Time Frames
While the HTF is crucial, incorporating multiple time frames into your analysis provides a more comprehensive view of the market. This approach allows you to identify trends, retracements, and reversals with greater precision.
Read More: The ICT Market Structure Shift Is Transforming Trading Strategies
Why OpoFinance is the Right Choice for Forex Traders
OpoFinance is an ASIC-regulated broker that offers an ideal platform for Forex traders aiming to refine their strategies with advanced market analysis. Here’s why OpoFinance stands out:
- Cutting-Edge Tools: Access advanced charting tools and technical indicators to support detailed market analysis.
- Competitive Spreads: Enjoy tight spreads that help optimize trading efficiency and profitability.
- Fast Execution: Benefit from rapid order execution, crucial for taking advantage of market opportunities.
- Regulatory Compliance: Trade with confidence, knowing you’re with a broker committed to high standards of security and transparency.
- Robust Support: Gain access to excellent customer service and educational resources to enhance your trading experience.

For traders focusing on ICT market structure and sophisticated trading strategies, OpoFinance provides the reliability and precision needed to execute trades successfully in the fast-paced Forex market.
Conclusion
Mastering the ICT Market Structure is crucial for any serious Forex trader. Understanding market phases, liquidity conditions, and key levels is essential for crafting successful trading strategies. The ICT Advanced Market Structure provides a comprehensive framework that enhances your ability to analyze and trade the Forex market effectively.
By incorporating these principles into your trading routine, you can make more informed decisions, align your strategies with broader market trends, and manage risk more effectively. Whether you’re new to trading or an experienced professional, the ICT Advanced Market Structure can significantly improve your trading performance and profitability.
What is the ICT Market Structure?
The ICT Market Structure is a method of analyzing market behavior based on institutional order flow, liquidity, and key levels. It involves understanding the phases of accumulation, manipulation, and distribution to identify trading opportunities.
How can I use the ICT Market Structure in my trading?
You can apply the ICT Market Structure by aligning your strategy with the higher timeframe, monitoring market phases, and using key levels to identify entry and exit points. It’s essential to understand liquidity conditions and market narratives to make informed decisions.
What are the common mistakes in applying the ICT Market Structure?
Common mistakes include ignoring the higher timeframe, misinterpreting market phases, and overlooking liquidity conditions. It’s crucial to have a solid understanding of these concepts to avoid false signals and poor trading decisions.
In conclusion, mastering the ICT Advanced Market Structure is not just about understanding the concepts but applying them effectively in real-world trading scenarios. With practice and discipline, traders can use this advanced methodology to achieve consistent success in the Forex market.


