

What is ICT Top-Down Analysis, and how can it transform your trading strategy? ICT Top-Down Analysis is a systematic approach to market analysis that starts with a broad view and drills down to more detailed perspectives. This method is designed to help traders understand market trends from a macro level before focusing on specific trade opportunities. By analyzing monthly, weekly, and daily charts, followed by intermediate and lower timeframes, traders can gain a comprehensive view of market movements and make more informed trading decisions.

Incorporating ICT Top-Down Analysis into your trading strategy is essential for identifying high-probability trades and navigating the complexities of the forex market. Using a regulated forex broker ensures that you have access to the necessary tools and resources for implementing this analysis effectively. With the right approach, you can harness the full potential of top-down analysis to refine your trading strategy and achieve better outcomes.
The Foundation of ICT Top-Down Analysis
Understanding the ICT Method
The ICT method, developed by Michael J. Huddleston, is a comprehensive trading approach that emphasizes institutional order flow and market structure. At its core, ICT top-down analysis is about aligning your trading decisions with the actions of large institutional players who drive market movements.
The Power of Multiple Timeframe Analysis
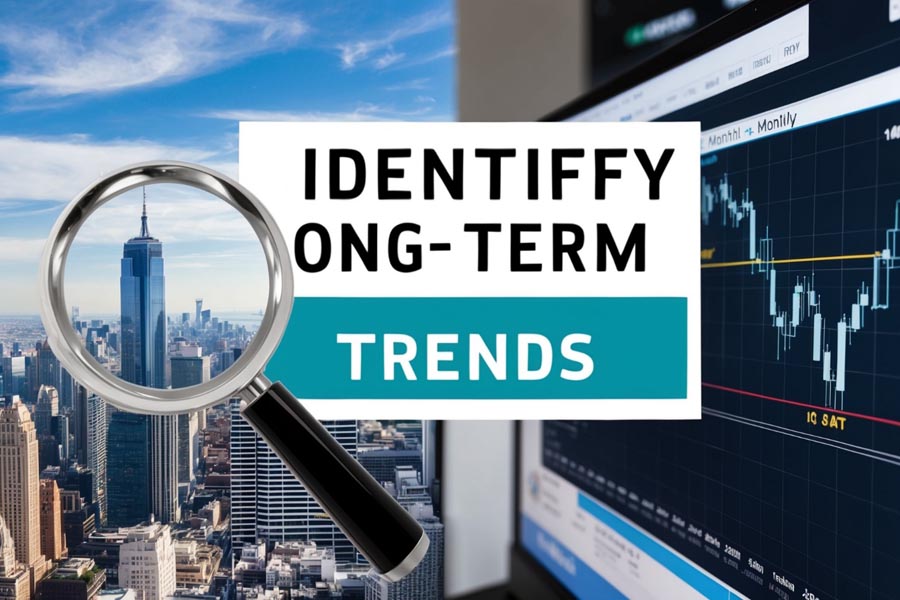
ICT top-down analysis harnesses the power of multiple timeframe analysis to provide a holistic view of the market. By starting with higher timeframes and working your way down, you can:
- Identify long-term trends
- Spot key support and resistance levels
- Recognize potential reversals
- Fine-tune your entry and exit points
7 Steps to Master ICT Top-Down Analysis
Step 1: Start with the Big Picture
The journey of effective trading begins with analyzing the monthly chart. This broader perspective helps traders to:
- Identify Long-term Trends: The monthly chart reveals the overarching market direction, providing insights into long-term trends. Recognizing these trends is vital as it helps in aligning your trades with the dominant market direction, increasing the likelihood of successful trades.
- Determine Major Support and Resistance Levels: By examining historical price data, you can pinpoint significant levels where the price has historically reversed or consolidated. These levels serve as critical points to watch for potential price reactions.
- Recognize Key Price Levels: Historical price levels often act as psychological barriers or targets for future price movements. Understanding these levels can give you a strategic advantage in predicting where the market may head next.
Pro Tip: Look for multi-year highs and lows on the monthly chart, as these are often significant liquidity pools targeted by institutional traders. These points can act as strong support or resistance levels.
Step 2: Zoom in to the Weekly Timeframe
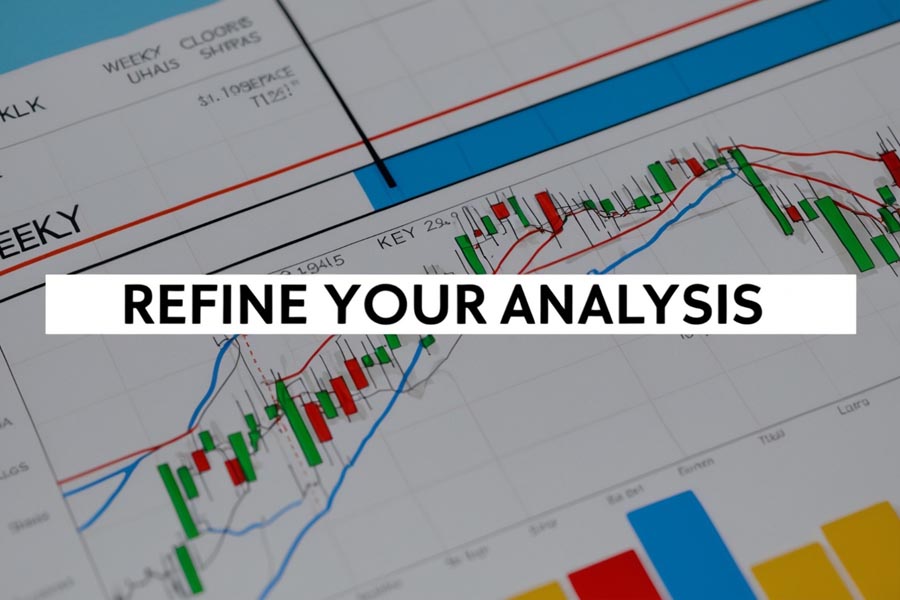
Transitioning to the weekly chart refines your analysis further. At this stage, you should:
- Confirm the Trend Identified on the Monthly Chart: Ensure that the trend you observed on the monthly chart is still valid. The weekly chart helps in verifying if the long-term trend continues or if any changes are taking place.
- Identify Potential Reversal Points: The weekly chart allows you to spot potential reversal points where the market might change direction. These points are crucial for planning your trades and setting stop-loss orders.
- Spot Key Market Structure Levels: Recognize significant market structure levels such as recent highs and lows. These levels can influence price movements and are important for setting trading parameters.
Key Concept: Focus on the previous week’s high and low, as these often act as liquidity pools where institutional traders place their orders. These levels can provide valuable clues for your trading decisions.
Read More: Unlock the Power of ICT Fibonacci Retracement
Step 3: Analyze the Daily Chart
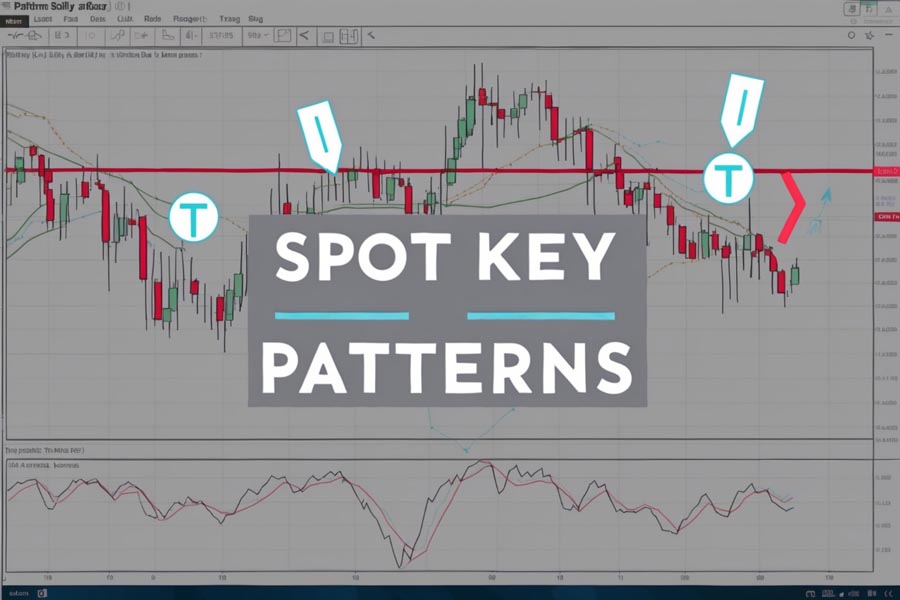
The daily chart offers a more detailed view of market price action. This step involves:
- Identifying Trend Continuation or Reversal Patterns: On the daily chart, look for patterns that indicate whether the current trend will continue or if a reversal is likely. These patterns are crucial for making informed trading decisions.
- Spotting Significant Swing Highs and Lows: These are critical price points where the market has previously reversed or consolidated. Recognizing these points helps in setting entry and exit levels for your trades.
- Identifying Order Blocks: Order blocks are areas where large institutional orders have been placed. These blocks can influence future price movements and are important for understanding market dynamics.
Important: The daily chart is essential for pinpointing potential entry and exit points. It provides the necessary detail to refine your trades based on the broader analysis from higher timeframes.
Step 4: Dive into the 4-Hour and 1-Hour Charts
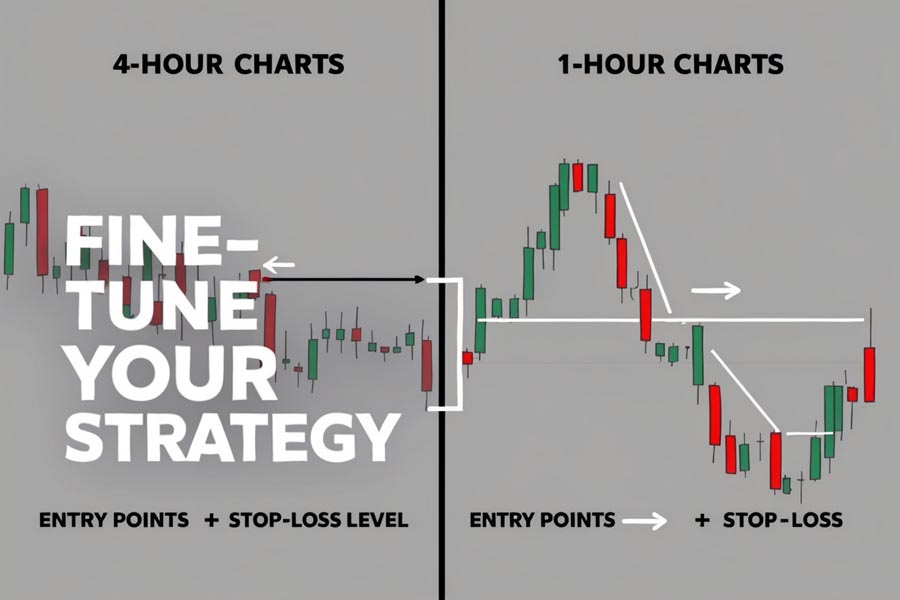
Intermediate timeframes, such as the 4-hour and 1-hour charts, help fine-tune your strategy. Focus on:
- Confirming the Bias from Higher Timeframes: Use these charts to validate the trend and analysis from the monthly, weekly, and daily charts. This step ensures that your intraday trades align with the broader market direction.
- Spotting Potential Entry Points: The 4-hour and 1-hour charts are ideal for identifying precise entry points for your trades. These timeframes offer a closer look at market movements, helping you time your entries more accurately.
- Identifying Stop Loss and Take Profit Levels: Determine appropriate levels for stop-loss and take-profit orders based on the analysis from these charts. This helps in managing risk and maximizing potential profits.
Strategy Tip: Utilize the 4-hour chart to gauge the overall intraday trend and the 1-hour chart for fine-tuning your entry points. This combination helps in making more precise trading decisions.
Step 5: Fine-Tune with Lower Timeframes

Lower timeframes, such as 15-minute, 5-minute, and 1-minute charts, provide precise trading signals. At this stage, focus on:
- Pinpointing Exact Entry and Exit Points: Lower timeframes allow you to identify the most precise moments to enter and exit trades. This precision is crucial for executing trades with minimal slippage.
- Managing Risk More Effectively: Setting accurate stop-loss and take-profit levels becomes more manageable with lower timeframes. This helps in protecting your capital and locking in profits.
- Identifying Short-Term Liquidity Pools: Recognize immediate market opportunities and liquidity pools that can influence short-term price movements. These pools can provide valuable insights for day trading.
Caution: While lower timeframes offer precision, they can also introduce market noise. Always refer back to higher timeframes for context to avoid false signals and make well-informed decisions.
Step 6: Identify Key Liquidity Levels
Throughout your analysis, pay attention to important liquidity levels:
- Previous Day’s High and Low: These levels are crucial as they represent recent market extremes and can act as support or resistance.
- Previous Week’s High and Low: Similar to daily levels, weekly highs and lows are important for understanding broader market dynamics.
- Monthly Open Prices: These prices often serve as reference points for market participants and can influence price movements.
- Significant Psychological Levels: Round numbers and other psychological levels often act as barriers or targets for the market.
Expert Insight: Institutional traders frequently target these liquidity levels to execute large orders. Understanding these dynamics can give you an edge in anticipating market movements and adjusting your trading strategy accordingly.
Step 7: Incorporate Fundamental Analysis
Integrate fundamental factors with your technical analysis to enhance your trading strategy:
- Monitor Economic Calendars: Stay updated on scheduled economic events that can impact market movements. Economic indicators such as GDP, employment figures, and inflation rates play a significant role in forex markets.
- Understand Major News Events: Be aware of news events that can cause market volatility. Events such as geopolitical developments, central bank announcements, and major economic reports can lead to significant price changes.
- Consider Central Bank Policies and Interest Rate Decisions: Central bank decisions on interest rates and monetary policies have a substantial impact on currency values. Understanding these policies helps in aligning your technical analysis with broader economic trends.
Balancing Act: Use fundamental analysis to confirm your technical analysis, ensuring that your trading decisions are well-supported by both technical and fundamental factors.
Read More: ICT Market Structure Shift
Integrating ICT Top-Down Analysis into Your Trading Plan
To maximize the effectiveness of ICT Top-Down Analysis, consider integrating the following practices into your trading plan:
- Develop a Systematic Approach: Create a structured method for performing your top-down analysis to ensure thorough and consistent evaluations. A systematic approach helps in maintaining discipline and reducing errors in your analysis.
- Create a Checklist: Develop a checklist to cover all key aspects of your analysis. This ensures that you don’t overlook important elements and helps in maintaining a comprehensive analysis.
- Keep a Trading Journal: Maintain a detailed trading journal to track your analysis, decisions, and results. This journal serves as a valuable tool for reviewing past trades and improving your strategy based on previous experiences.
- Regularly Review and Refine Your Process: Continuously evaluate and refine your analysis approach based on your trading experiences. Regular reviews help in identifying areas for improvement and adapting to changing market conditions.
- Practice, Practice, Practice: Utilize demo accounts to practice your ICT Top-Down Analysis skills without risking real money. Practicing in a simulated environment helps in honing your skills and building confidence before trading live.
Advanced ICT Top-Down Analysis Techniques

Mastering Order Flow
Order flow analysis is essential for a comprehensive ICT approach:
- Identify Institutional Order Blocks: Order blocks are areas where large institutional orders have been placed. Recognizing these blocks can provide insights into potential market movements and liquidity levels.
- Recognize Fair Value Gaps: Fair value gaps are price areas where there has been a significant move without sufficient trading activity. These gaps can indicate potential future price adjustments.
- Spot Liquidity Voids: Liquidity voids are areas with low trading volume. Understanding these voids helps in anticipating price movements and potential areas of market impact.
Understanding order flow is crucial for anticipating significant market moves and aligning your trading strategy with institutional activity.
Utilizing Smart Money Concepts (SMC)
Smart Money Concepts (SMC) offer advanced analytical tools:
- Look for Breaker Blocks: Breaker blocks are price areas where previous support or resistance levels have been breached. These blocks often indicate potential future price movements.
- Identify Mitigation Points: Mitigation points are levels where the market corrects after a significant move. Recognizing these points helps in understanding market corrections and adjustments.
- Recognize Inducement Scenarios: Inducement scenarios involve market manipulations designed to trigger certain reactions. Identifying these scenarios helps in anticipating market moves and making informed trading decisions.
SMC Mastery: Combining Smart Money Concepts with traditional technical analysis can significantly enhance your trading results by providing additional insights into market dynamics.
Implementing Market Structure Analysis
Market structure analysis is fundamental to understanding market behavior:
- Identify Higher Highs and Lower Lows: Recognize the pattern of higher highs and lower lows to understand the market’s directional bias. This analysis helps in determining the trend and making trading decisions.
- Recognize Change of Character (CHoCH) Points: CHoCH points indicate shifts in market trends. Identifying these points helps in understanding potential reversals and adjusting your trading strategy accordingly.
- Spot Potential Reversal Zones: Reversal zones are areas where the market may change direction. Recognizing these zones helps in identifying opportunities for entering or exiting trades.
A solid understanding of market structure provides the framework for analyzing market trends and making informed trading decisions.
Read More: Mastering ICT Market Structure
OpoFinance: Your Ideal Forex Trading Partner
To fully leverage ICT Top-Down Analysis, partnering with a regulated forex broker like OpoFinance offers significant advantages. OpoFinance provides a range of tools and resources that complement your analysis strategy, enhancing your trading experience.

Why Choose OpoFinance?
- Regulated and Secure
OpoFinance is regulated by ASIC, ensuring a high level of security and transparency. This regulation provides peace of mind and confidence in your trading activities.
- Advanced Trading Tools
Access to sophisticated trading tools and real-time data with OpoFinance supports your ICT Top-Down Analysis. These tools enhance your ability to analyze market trends and make informed trading decisions.
- Social Trading Services
OpoFinance’s social trading services allow you to follow and replicate the trades of experienced traders. This feature provides valuable insights and enhances your trading strategy by learning from successful traders.
Conclusion
ICT Top-Down Analysis offers a structured approach to forex trading by examining market trends from broad to specific perspectives. By following these 7 steps, you can enhance your trading strategy and make more informed decisions. Consistency in your analysis and leveraging reliable tools and resources, such as those offered by OpoFinance, can significantly enhance your trading success.
How can news and economic calendars influence my ICT Top-Down Analysis?
News and economic calendars provide essential context for market movements. Staying updated on high-impact news events and economic reports helps in anticipating price changes and adjusting your strategy accordingly.
What are Premium/Discount arrays, and how do they affect my trading?
Premium/Discount arrays represent price levels where the market is trading above or below historical norms. Recognizing these arrays aids in understanding market valuation and making informed trading decisions.
How can I use intermarket relationships in my top-down analysis?
Intermarket relationships, such as those between major indices and currencies, provide additional insights into market trends. Analyzing these relationships helps in gaining a broader understanding of market dynamics and improving your trading strategy.


