

In the world of technical analysis, particularly within Smart Money Concepts (SMC), you’ll constantly hear the terms “imbalance” and “fair value gap.” While many traders use them interchangeably, understanding the nuanced difference between imbalance vs fair value gap is crucial for refining your trading strategy. An imbalance is the broad market condition of one-sided pressure, whereas a Fair Value Gap (FVG) is a specific, visible three-candle pattern that illustrates this inefficiency. Throughout this guide, we will dive deep into the mechanics of imbalance and fvg, explore how to identify and trade them, and provide actionable insights that any trader, perhaps using an online forex broker, can apply.
Key Takeaways
- Core Relationship: A Fair Value Gap (FVG) is a specific, visual type of market imbalance. Therefore, all FVGs are imbalances, but not all imbalances present as clear FVGs.
- Cause: Both are created by aggressive, large-volume institutional orders that create a rapid price displacement, leaving behind an inefficiently priced area.
- The “Magnet” Effect: Price has a high probability of returning to these zones to “rebalance” or “mitigate” the inefficient price action before potentially continuing in its original direction.
- Trading Application: FVGs offer more precise entry points, stop-loss placements, and profit targets due to their clear three-candle structure.
- Context is Crucial: The reliability of both an imbalance and fair value gap heavily depends on the market context, such as the higher timeframe trend, liquidity, and proximity to other key price levels.
What Are Imbalances and FVGs?
Before we break down their differences, it’s essential to have a solid grasp of what each term represents individually. They are the cornerstones of understanding market inefficiencies and are often the footprints left behind by institutional market participants, or “Smart Money.”
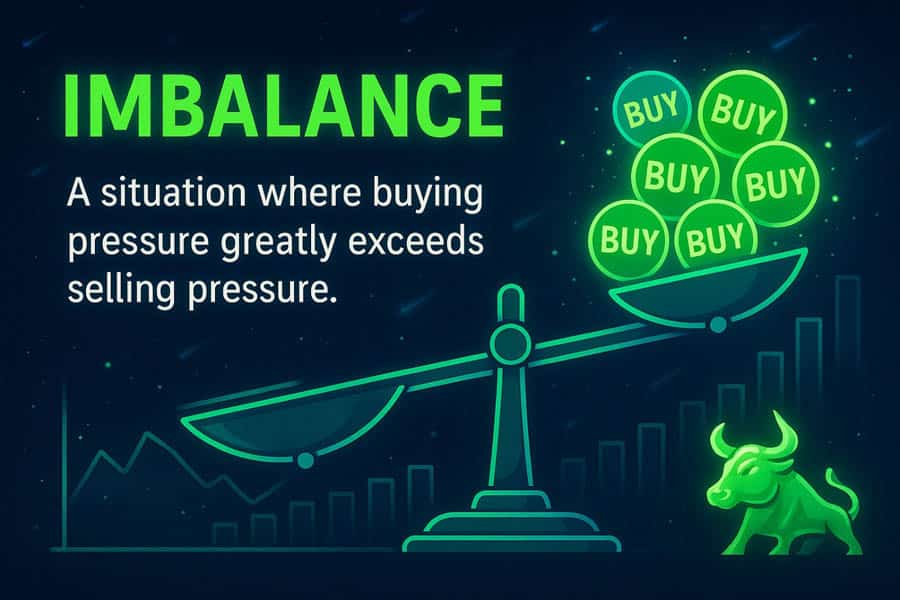
Defining Imbalance
An imbalance, in its purest form, is a market state where there is a significant disparity between buy orders and sell orders. Think of it as a one-sided conversation. When institutional players execute massive buy orders, they consume all available sell-side liquidity at current prices, forcing the price to shoot upwards rapidly to find the next seller. This rapid, aggressive move is the imbalance. It’s the underlying force. This concept is broader than a specific pattern and represents the reason for the sharp price leg. An imbalance signifies that price was delivered inefficiently, leaving a void that the market will often seek to correct later.
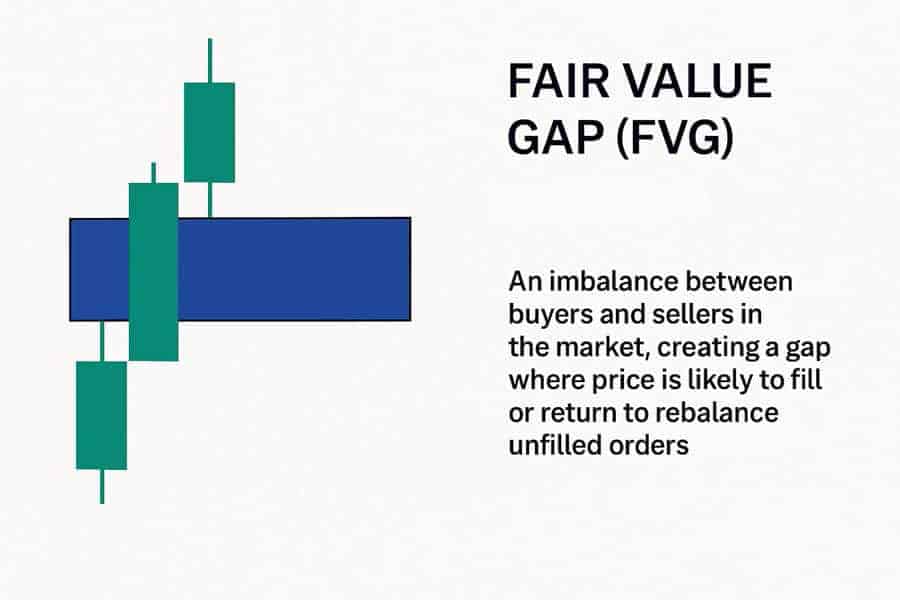
Defining Fair Value Gap (FVG)
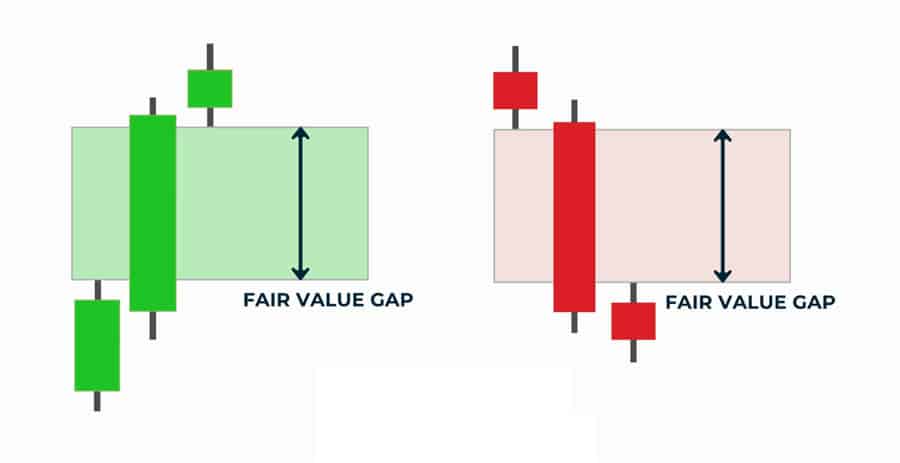
A Fair Value Gap, often abbreviated as FVG, is the specific, visual representation of that imbalance on a price chart. It is a distinct three-candlestick pattern that makes the imbalance easy to spot and trade. For a bullish FVG, you have a sequence of three candles where the high of the first candle and the low of the third candle do not overlap. The empty space between these two wicks, seen on the second candle, is the Fair Value Gap.
Conversely, a bearish FVG occurs when the low of the first candle and the high of the third candle do not meet. This gap is a clear signal of an aggressive move that left price inefficiently priced, making the fair value gap vs imbalance debate one of specific pattern versus general condition.
Read More: Fair value gap
Key Differences: Imbalance vs FVG
While an FVG is a type of imbalance, distinguishing between the general concept and the specific pattern helps traders achieve greater precision. Their core difference lies in their definition and application in a live trading environment. Let’s explore this with more detail.
| Feature | Imbalance | Fair Value Gap (FVG) |
|---|---|---|
| Structure | A broader concept of one-sided price delivery. Can appear as a series of strong candles (a liquidity void) without a specific pattern. | A specific, measurable three-candle pattern where the wicks of the 1st and 3rd candles do not overlap. |
| Cause | Caused by overwhelming institutional buy or sell pressure that exhausts immediate liquidity. | A direct result of the same institutional pressure, but displayed in a very specific candlestick formation. |
| Trading Approach | Zone is less defined. Traders often look for more refined points of interest (like an order block) within the larger imbalanced area. | Offers a clearly defined zone for entry, stop loss, and targets. Entry can be at the top, 50% (Consequent Encroachment), or bottom of the gap. |
| Reliability | Conceptually strong, but harder to trade directly due to its lack of precise boundaries. | Generally more reliable for execution as it provides clear parameters, reducing ambiguity in trade planning. |
When is Each Term Used?
In professional discourse, “imbalance” is often used to describe the overall market narrative. For instance, a market analyst might say, “There’s a significant buy-side imbalance on the daily chart after the positive economic data.” This points to the general market condition. Conversely, a trader planning a trade would say, “I’m waiting for price to retrace to the H1 Fair Value Gap for a potential long entry.” Here, the FVG is the specific, actionable tool. The discussion of imbalance and fvg is therefore one of strategy versus analysis.
Are All FVGs Imbalances?
Yes, absolutely. A Fair Value Gap is, by its very definition, a pictorial representation of an imbalance in price. It is a clear, textbook example of inefficient price action where one side of the market (buyers or sellers) completely overwhelmed the other, leaving a “gap” in value.
Are All Imbalances FVGs?
No. This is the crucial distinction. An imbalance can occur without forming a perfect three-candle FVG. Imagine a scenario with five consecutive, large bullish candles all closing near their highs with very small wicks. This entire price leg is an imbalance—it’s called a “liquidity void”—but it may not contain a single, clean FVG pattern. The underlying condition (imbalance) is present, but the specific, tidy pattern (FVG) is not. Understanding this helps you recognize inefficiency even when it isn’t perfectly packaged.
How Imbalances and FVGs Form
To truly trust and trade these concepts, you must understand the market mechanics behind their formation. They are not random patterns; they are the direct result of supply and demand dynamics at an institutional level. From my own experience, grasping the ‘why’ behind a pattern transformed my trading from simply identifying shapes to understanding market behavior.
The Market Mechanics
At any given moment, the market has a certain amount of buy orders and sell orders waiting at various price levels. This is known as liquidity. When a large financial institution decides to enter the market with a massive order—say, a billion-dollar buy order on EUR/USD—they absorb all the available sell orders instantly. The market’s algorithm then has to rapidly move the price up to find new sellers at higher prices. This sudden, forceful jump in price is what creates the imbalance. The price movement is so fast that a “fair” two-sided trade cannot occur, leaving behind an inefficient price leg and often, a clear Fair Value Gap.
The Candlestick Signature
The formation of an FVG is a direct consequence of this aggressive price action. Let’s break down a bullish FVG:
- Candle 1: A bearish or bullish candle that represents the market state before the aggressive move.
- Candle 2: A very strong, long bullish candle with high volume. This is the “imbalance candle” where institutions injected their large orders.
- Candle 3: Another bullish candle that continues the move.
The Fair Value Gap is the space between the high of Candle 1 and the low of Candle 3. This space exists because the price moved so quickly during Candle 2 that it gapped over a range of prices, never allowing for a proper two-sided auction in that zone.
I encourage you to open your own charts right now. Go to a 1-hour or 4-hour chart of a major pair like GBP/USD and look for the sharpest recent price moves. You will almost certainly find a clean imbalance and fair value gap left behind.
Read More: Fair value gap and order block strategy
Why They Matter in Trading
Recognizing an imbalance vs fair value gap is one thing; understanding why they are critically important is what gives you a trading edge. These concepts are fundamental pillars of the Smart Money Concepts (SMC) methodology because they reveal the intentions of the market’s biggest players.
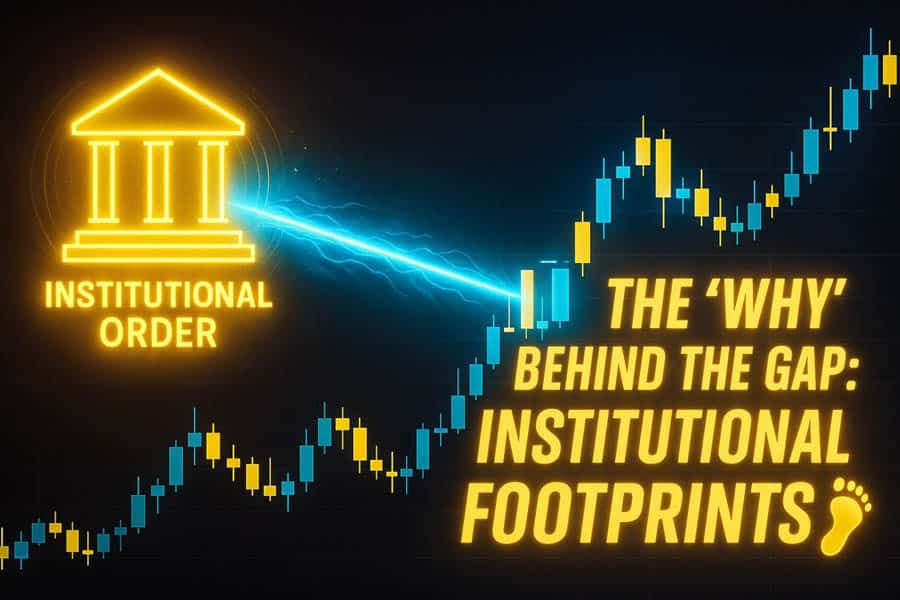
Role in Smart Money Concepts
In SMC, the entire premise is to trade in harmony with institutional order flow, not against it. FVGs and imbalances are seen as the “footprints” of Smart Money. When you spot one, you are seeing a location where institutions have shown their hand. This allows retail traders to frame high-probability trades by aligning with the powerful momentum initiated by these institutions.

How Institutions Exploit These Zones
A common misconception is that institutions leave these gaps by mistake. In reality, they are often created intentionally. After creating the initial imbalance to move the market, institutions may need to “mitigate” their position. This means they will often guide the price back towards the FVG to close out portions of their initial trade at a more favorable price or to accumulate more positions before launching the next wave in the intended direction. This is why price so often acts like a magnet to these zones.
Why Price Returns to Fill Gaps
The market is a perpetual auction that constantly seeks efficiency. An imbalance or FVG is, by definition, an inefficiently priced area. The market algorithm, in its quest for equilibrium, will naturally drive price back to these zones to “rebalance” the order book. This rebalancing act allows for trades to occur at the prices that were skipped during the initial aggressive move, thereby “filling the gap” and restoring efficiency before a new trend can sustainably continue.
How to Spot Imbalance and FVG
Learning to correctly identify these zones is a skill that requires practice, but it’s a straightforward process once you know what to look for. A clean identification process removes ambiguity and builds confidence in your analysis. The debate of fair value gap vs imbalance becomes clearer when you can pinpoint each on a chart.
How to Spot Imbalance and FVG
Here’s a simple, step-by-step guide to finding a Fair Value Gap, which is the most actionable form of an imbalance:
- Look for a Strong Price Move: Scan your chart for a recent, impulsive leg up or down. This move should stand out from the surrounding price action.
- Isolate the Three-Candle Sequence: Focus on the candle that made the most aggressive move and the candles immediately before and after it.
- Check for the “Gap”:
- For a Bullish FVG: Look at the high of the first candle and the low of the third candle. If they do not overlap, the space between them on the second candle is your FVG.
- For a Bearish FVG: Look at the low of the first candle and the high of the third candle. If they do not overlap, that space is your FVG.
- Draw the Zone: Mark this area on your chart using a rectangle tool. This is now a point of interest for a potential future trade.
Tools and Indicators
While identifying FVGs manually is the best way to train your eye, several tools can speed up the process. On platforms like TradingView, you can find numerous community-built indicators by simply searching for “FVG” or “Imbalance.” Popular toolkits like LuxAlgo also have features that automatically detect and highlight these zones on your chart. These tools are excellent for confirmation but should not replace the skill of manual identification, as they can sometimes highlight insignificant gaps.
Read More: Identify Imbalance in Forex
Common Identification Mistakes
As a developing trader, I made these mistakes frequently. Avoiding them will save you a lot of frustration.
- Ignoring Context: Identifying an FVG in a choppy, sideways market is a low-probability endeavor. The most powerful FVGs are those that break market structure and occur in a clear, trending environment.
- Focusing on Tiny Gaps: Not all FVGs are created equal. A tiny gap on a 1-minute chart is far less significant than a large, obvious FVG on a 4-hour or daily chart. The size of the gap relative to the surrounding candles matters.
- Misidentifying the 3-Candle Structure: Ensure you are correctly identifying the first and third candles. A common error is to use candles that are part of the same extended wick, which negates the pattern.
Trading Strategies: Imbalance vs FVG
Once you can confidently identify an imbalance and fair value gap, the next step is to build trading strategies around them. FVGs, due to their defined nature, offer a more direct approach to trading.
How to Trade Fair Value Gaps
The classic FVG trading strategy is a retracement entry. The idea is to wait for price to return to the inefficiently priced zone before joining the institutional momentum.
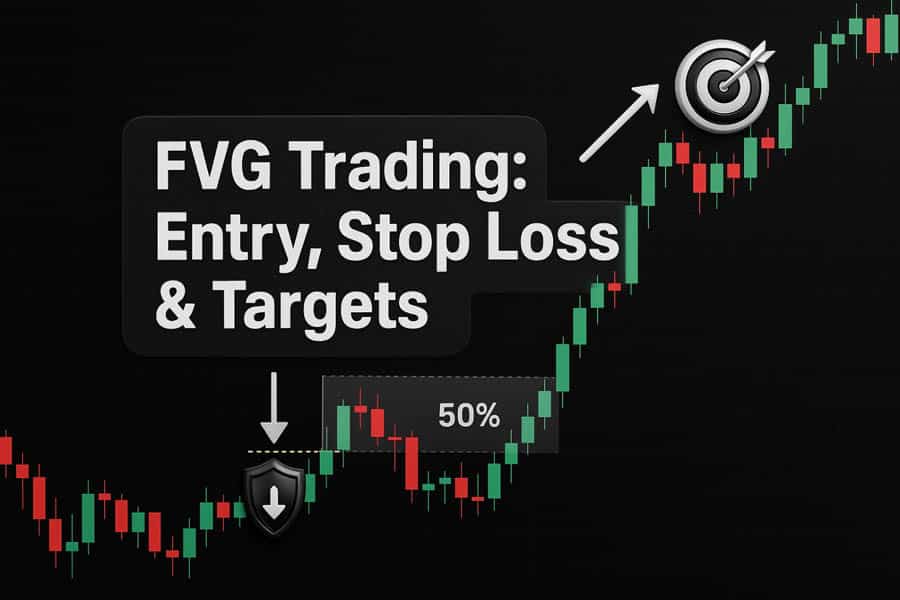
- Entry: Once price retraces back into the FVG zone, you have a few entry options. An aggressive entry is at the very start of the gap. A more common entry is at the 50% level of the gap, known as the “Consequent Encroachment,” which often offers a better risk-to-reward ratio. A conservative entry waits for price to react at the FVG and show a lower timeframe confirmation signal.
- Stop Loss: Your stop loss should be placed logically just outside the FVG. For a bullish FVG, the stop loss goes just below the low of the impulsive second candle. For a bearish FVG, it goes just above its high. This contains your risk clearly.
- Targets: Your profit targets should be set at logical liquidity levels. This could be a recent high or low, another opposing FVG, or a significant supply or demand zone.
How to Trade Broader Imbalances
Trading a broader imbalance, like a liquidity void, is less precise. Since the zone is large and undefined, you can’t simply enter when price touches it. Instead, you use the broad imbalance as a higher timeframe point of interest. You would wait for price to enter this large imbalanced zone and then look for a more specific entry pattern on a lower timeframe, such as an FVG or a break of structure, to fine-tune your entry.
Risk/Reward Considerations
The beauty of trading the imbalance vs fair value gap distinction is that FVGs naturally create high-probability risk-to-reward setups. Because the entry zone is precise and the stop loss is logically placed, you can often risk a small amount for a potentially large gain, easily achieving R:R ratios of 1:3 or higher.
Advanced Techniques & Pro Tips
To elevate your trading beyond the basics, you must learn to apply these concepts within a broader analytical framework. This is where you combine patterns with context to build a truly robust strategy. It took me years of practice to appreciate that a single pattern is never enough.
Multi-Timeframe Analysis
This is arguably the most important advanced technique. An FVG on the daily chart is a magnetic zone that can control price for days. A 5-minute FVG might only be relevant for a few minutes. The professional approach is to identify a high-timeframe (e.g., Daily, H4) FVG and wait for price to enter that zone. Then, you drop down to a lower timeframe (e.g., M15, M5) and look for a smaller FVG or other entry pattern in the same direction. This is called a “top-down analysis,” and it dramatically increases the probability of your trades.
Combining with Supply and Demand
An FVG becomes a supercharged signal when it is formed in confluence with other key concepts. For example, if a significant demand zone is broken by an aggressive move that leaves behind a bearish FVG, the probability of price returning to that FVG before heading lower is extremely high. Look for setups where an imbalance and fvg work together with breaks of structure and supply/demand flips.
Using Volume and Volatility
A true, institutionally-driven imbalance will always be accompanied by a spike in volume. Use a volume indicator to confirm that the candle creating the FVG has significantly more volume than the preceding candles. A gap formed on low volume is often just noise and is unreliable. High volatility confirms the aggressive nature of the move.
Mitigation and Retest Strategies
It’s important to understand that price does not always need to fill the entire FVG. Sometimes, a simple touch (or “mitigation”) of the top of the zone is enough for institutions to do what they need to do before price reverses. Don’t get fixated on a full gap fill. Be flexible with your entry and recognize that a strong reaction from the edge of the gap is often a valid signal in itself.
Real Trader Experiences
Theory is one thing, but practical application is another. Over years of trading, every chartist develops a personal feel for these concepts. Here are some experience-based insights that you won’t find in a textbook.
What Works, What Doesn’t
What works is patience. The biggest mistake traders make is chasing every single fair value gap vs imbalance they see. What truly works is waiting for the “A+” setup: an FVG that aligns with the higher-timeframe trend, breaks market structure, has high volume, and targets a clear pool of liquidity. What doesn’t work is trading them in isolation, against the trend, or in messy, consolidating markets.
Common Pitfalls and How to Avoid Them
A major pitfall is “confirmation bias.” You want to find a trade, so you convince yourself a messy pattern is a clean FVG. To avoid this, be brutally honest in your analysis. If it’s not a clean, obvious gap, just skip it. Another pitfall is placing your stop loss too tight, right at the edge of the FVG. Price will often spike slightly past the edge to grab liquidity before reversing. Give your stop loss a little breathing room.
When to Ignore a Gap or Imbalance
You should learn to ignore an FVG in several scenarios. Ignore them when they are formed right before a major, high-impact news release, as the resulting volatility is unpredictable. Ignore them if they are very small relative to the overall price structure. And crucially, if you have a bullish FVG but the daily and weekly charts are in a strong downtrend, it’s often wise to ignore the smaller timeframe signal and respect the dominant market flow.
Glossary of Key Terms
- Imbalance: A market condition where buy-side or sell-side pressure is dominant, causing inefficient price delivery.
- Fair Value Gap (FVG): A specific three-candle pattern that visually represents an imbalance.
- Mitigation: The act of price returning to a point of interest (like an FVG or order block) to rebalance orders before continuing a move.
- Consequent Encroachment (CE): The 50% midpoint of a Fair Value Gap or a candlestick’s body/wick, often acting as a strong level of support or resistance.
- Supply/Demand Zone: A price area where a significant amount of buying (demand) or selling (supply) previously occurred, often acting as a future turning point.
- Liquidity Void: A large price range consisting of only one-sided candles (e.g., several large bullish candles in a row), representing a significant imbalance without a specific FVG pattern.
- Smart Money Concepts (SMC): A trading methodology focused on identifying and trading in line with the actions of institutional investors.
- Order Block: The last up or down candle before an explosive move in the opposite direction, often serving as a key point of interest for institutional mitigation.
Opofinance Services
To effectively trade concepts like the imbalance vs fair value gap, you need a broker that provides the right tools and a secure environment. Opofinance, an ASIC-regulated broker, stands out as an excellent choice for both novice and experienced traders looking to apply advanced strategies.
- Advanced Trading Platforms: Gain an edge with access to a full suite of platforms, including the industry-standard MT4 and MT5, the advanced cTrader, and the user-friendly OpoTrade app.
- Innovative AI Tools: Leverage cutting-edge technology with an AI Market Analyzer to spot opportunities, an AI Coach to refine your strategy, and AI-powered support for instant assistance.
- Social & Prop Trading: Join a community of traders with social trading features, or test your skills and get funded through their prop trading program.
- Secure & Flexible Transactions: Enjoy peace of mind with safe and convenient deposit and withdrawal methods, including crypto payments, all with zero transaction fees from Opofinance.
Ready to apply these powerful concepts with a top-tier broker? Explore what Opofinance has to offer and elevate your trading journey today.
Final Thoughts
The imbalance vs fair value gap distinction is subtle yet powerful. Think of imbalance as the disease and the FVG as a clear symptom. By learning to spot the symptom, you can diagnose the market’s condition and anticipate its next move. Mastering these concepts requires screen time, practice, and disciplined execution. Start by identifying them on your charts without taking trades, then move to backtesting, and finally, apply them with real capital. Your understanding of price action will never be the same.
What’s the difference between an FVG and a Liquidity Void?
An FVG is a specific three-candle pattern creating a small, defined gap. A Liquidity Void is a much larger area on the chart characterized by a series of aggressive, one-sided candles with little to no pullback, representing a broader and more extended imbalance.
Do FVGs work in all markets like stocks and crypto?
Yes, the principles behind FVGs and imbalances are universal. Because they are based on the fundamental dynamics of supply, demand, and liquidity, they can be effectively applied to any market that has sufficient volume and liquidity, including forex, stocks, indices, and cryptocurrencies.
How does major news impact FVG reliability?
High-impact news events can have two effects. First, they can create very large and powerful FVGs due to the sudden influx of volume. Second, the extreme volatility can cause the price to completely ignore pre-existing FVGs. It’s often wise to be cautious and avoid trading around major news unless you have a specific strategy for it.
Can a Fair Value Gap be invalidated?
Yes, an FVG is considered invalidated or “disrespected” if the price trades completely through it and closes on the other side without showing any significant reaction. This signals that the institutional interest that created the gap is no longer in control, and the original thesis is likely wrong.
Is it better to enter at the start of an FVG or the 50% level?
This depends on your trading style and risk tolerance. Entering at the start of the gap ensures you don’t miss the move but comes with a wider stop and lower risk-to-reward ratio. Waiting for the 50% level (Consequent Encroachment) offers a much better risk-to-reward but carries the risk that price may reverse before reaching it, causing you to miss the trade entirely.


