

Deciding between the Keltner Channel vs Donchian Channel is a common challenge for traders aiming to define market trends and volatility. While both are excellent channel indicators, they answer different questions. Keltner Channels, based on volatility (ATR), excel at identifying trend continuation and pullbacks within a trend. Donchian Channels, based on price action (highs/lows), are superior for spotting pure breakouts. This article will dissect the core keltner channel vs donchian difference, explore strategies for each, and help you find the ideal tool for your approach with your preferred online forex broker.
Key Takeaways
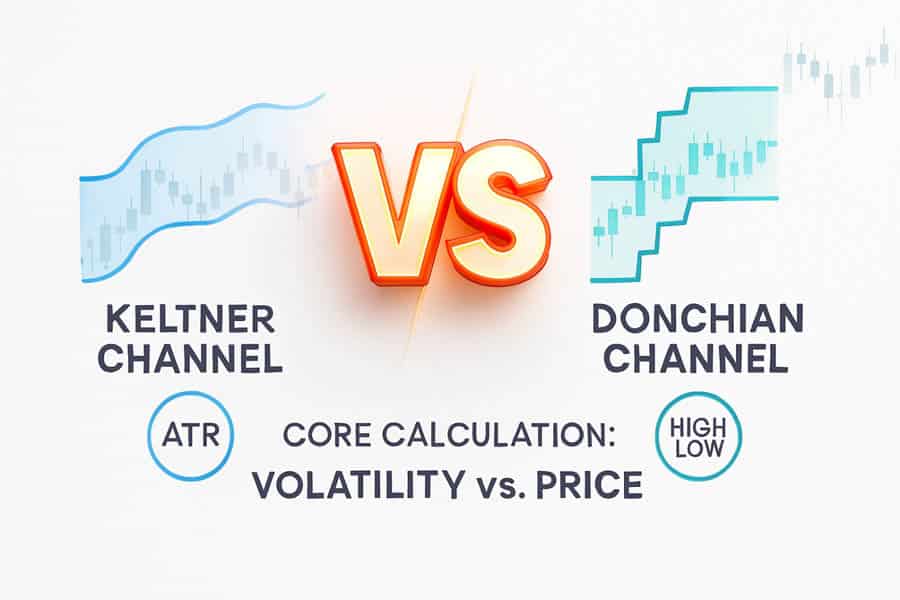
- Core Calculation: The primary keltner channel vs donchian difference lies in their formula. Keltner Channels use an Exponential Moving Average (EMA) and the Average True Range (ATR), making them volatility-based. Donchian Channels use the highest high and lowest low over a set period, making them purely price-based.
- Visual Appearance: Keltner Channels appear smoother and expand or contract based on market volatility. Donchian Channels have a more rigid, step-like appearance that only changes when a new high or low is made.
- Primary Use Case: The best donchian channel vs keltner channel for breakout trading is typically the Donchian Channel, as it is built to signal new price extremes. Keltner Channels are better suited for confirming trends and identifying dynamic support and resistance for pullback entries.
- Trader Suitability: Beginners may find Keltner Channels more intuitive for trend-following, while breakout traders often gravitate toward the clear-cut signals of Donchian Channels.
- Signal Generation: Keltner Channels signal potential overbought/oversold conditions and trend strength. Donchian Channels provide unambiguous breakout signals when the price touches or crosses their upper or lower bands.
Quick Comparison: Keltner Channel vs Donchian Channel
For traders who need a quick answer, this table summarizes the essential distinctions in the keltner channel vs donchian debate. It offers a high-level view to guide your initial choice before we dive deeper into strategy and application.
| Feature | Keltner Channel | Donchian Channel |
| Core Calculation | EMA (center) + ATR (bands) | Highest High & Lowest Low |
| Indicator Type | Volatility-based | Price-based |
| Appearance on Chart | Smooth, adaptive bands | Step-like, rectangular bands |
| Primary Use-Case | Trend confirmation, pullbacks | Breakout identification |
| Best Market Condition | Trending markets | Strongly trending or breakout markets |
| Pros | Good for dynamic S/R, fewer false signals in ranges | Excellent for catching new trends early, clear signals |
| Cons | Can be too slow for aggressive breakout traders | Can generate many false signals in choppy/ranging markets |
What Are Channel Indicators?
Before dissecting the keltner channel vs donchian matchup, it’s crucial to understand what channel indicators do. At their core, these tools create bands above and below a central measure of price, forming a “channel” that the price action moves within. Their primary purpose is to frame volatility and identify potential trading opportunities based on how the price interacts with the channel’s boundaries. Traders use them to gauge trend strength, spot breakouts, and identify overbought or oversold conditions. In practical trading, channels provide a visual map of the market’s current volatility and directional bias, making them a cornerstone of many technical strategies.
Read More: Donchian Channel
Keltner Channel vs Donchian: Key Differences
The debate over keltner channel vs donchian is not about which is universally “better,” but which is better for a specific purpose. Their fundamental construction dictates their behavior and, consequently, their ideal application in trading. Understanding this core keltner channel vs donchian difference is the first step toward mastering either tool.
Core Calculation Method
The most significant distinction comes from their DNA. Keltner Channels are built using an Exponential Moving Average (EMA) as the centerline, representing the trend’s core. The upper and lower bands are then calculated by adding and subtracting a multiple of the Average True Range (ATR)—a pure measure of volatility. This makes the Keltner Channel a volatility-adaptive tool; its bands widen in choppy markets and tighten in quiet ones. Conversely, Donchian Channels are purely price-driven. The upper band is simply the highest high over a lookback period (e.g., 20 days), and the lower band is the lowest low. This creates a stark, reactive channel that only moves when a new extreme is printed.
Behavior and Appearance on a Chart
This difference in calculation leads to vastly different visual outputs. A Keltner Channel moves smoothly with the price, its bands gracefully expanding and contracting like a breathing organism. This provides a dynamic view of support and resistance. A Donchian Channel, however, creates a series of horizontal steps. The bands remain flat until the price makes a new high or low over the specified period, at which point the band jumps to that new level. This step-like movement provides clear, objective breakout levels but can be less informative during range-bound price action.
Best Use Cases
Their construction dictates their best use. The smooth, trend-following nature of Keltner Channels makes them ideal for traders looking to enter on pullbacks. When price dips to the middle or lower band in an uptrend, it’s often seen as a buying opportunity. In the context of a keltner channel vs donchian channel strategy, the Keltner is for confirming an existing trend. The Donchian Channel, on the other hand, is the quintessential breakout tool. A price touch of the upper band is an unambiguous signal of a new high, making it the preferred choice when deciding on a donchian channel vs keltner channel for breakout trading.
Suitability for Different Traders
For beginner traders, the Keltner Channel can be more forgiving. Its smoothness helps filter out minor market noise and provides a clearer picture of the prevailing trend. It encourages a more patient, trend-following mindset. Advanced breakout traders, particularly system traders, often prefer the Donchian Channel. Its binary, objective signals (a new high has been made, yes or no?) are perfect for building automated strategies where clear, non-subjective rules are paramount.
Keltner Channel: Deep Dive with Practical Use
The Keltner Channel, developed by Chester Keltner and later refined by Linda Raschke, is a favorite among trend-following traders for its elegant simplicity and effectiveness. It doesn’t just show you the trend; it tells you about its health and rhythm. By understanding its construction, you can unlock its full potential in your trading.
How Keltner Channels Are Built
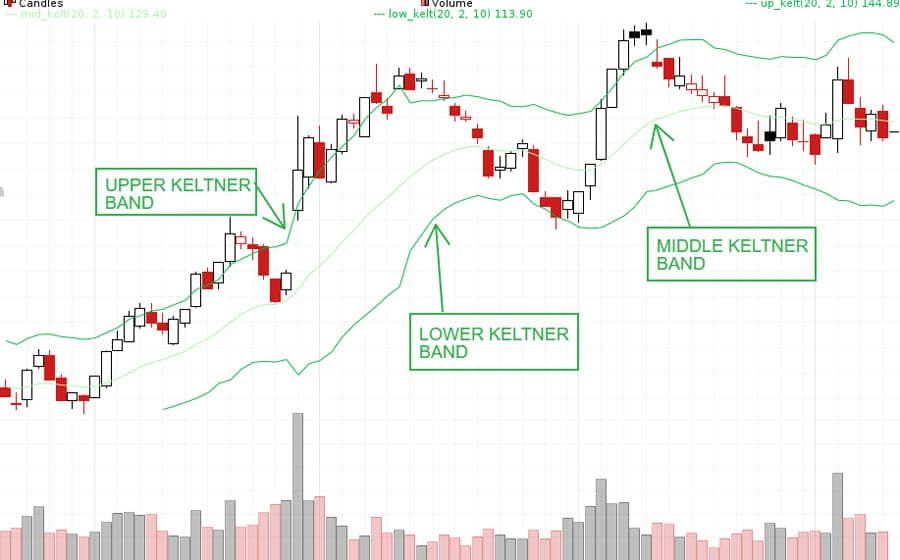
The indicator is comprised of three lines:
- Middle Line: An Exponential Moving Average (EMA) of the price. A 20-period EMA is a common standard. This line defines the medium-term trend direction.
- Upper Band: The Middle Line + (a multiple of ATR). For example, (2 x 20-period ATR).
- Lower Band: The Middle Line – (a multiple of ATR).
The key variables you can adjust are the EMA period, the ATR period, and the ATR multiplier. Increasing the multiplier widens the channel, requiring a more significant price move to reach the bands, thus filtering out weaker signals.
When and Why to Use Keltner Channels
The primary strength of the Keltner Channel lies in identifying dynamic support and resistance within a trend. Here’s how experienced traders use it:
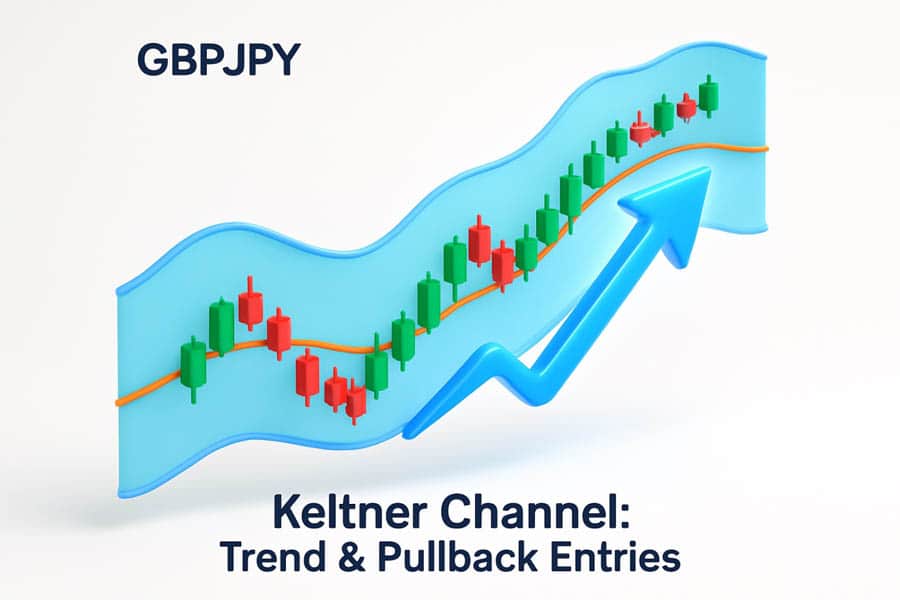
- Trend Confirmation: As long as the price stays between the middle and upper bands in an uptrend (or middle and lower bands in a downtrend), the trend is considered healthy. The angle of the channel itself indicates the trend’s momentum.
- Pullback Entries: The most popular keltner channel vs donchian channel strategy for Keltner users is buying on pullbacks. In a strong uptrend, a dip to the 20-period EMA (the middle line) is often a high-probability entry point. More conservative entries can be found near the lower band, though this may signal a weakening trend.
- Trailing Stops: The lower band (in an uptrend) or upper band (in a downtrend) can serve as an effective trailing stop-loss. It adapts to volatility, giving the trade room to breathe while still protecting profits if the trend reverses decisively.
Example Setup and Common Pitfalls
A classic setup on a daily chart for a forex pair like EUR/USD might be an EMA of 20, an ATR period of 10, and a multiplier of 2. A trader would look for the price to close above the upper band to signal strong momentum, then wait for a pullback to the middle EMA line to enter a long position. A common pitfall is using it in a ranging market. In choppy conditions, price will frequently bounce between the upper and lower bands, leading to confusion and false trend signals. This is why it’s crucial to use a trend-filtering tool like the ADX alongside it.
Read More: Keltner Channels
Donchian Channel: Deep Dive with Practical Use
The Donchian Channel, created by futures trader Richard Donchian, is a simpler yet powerful tool. It is the foundation of the legendary Turtle Trading system and remains a staple for breakout traders worldwide. Its strength lies in its objectivity; it removes all guesswork about when a new high or low has been established.
How Donchian Channels Are Built
The construction is straightforward and has no volatility input, which is a key keltner channel vs donchian difference:
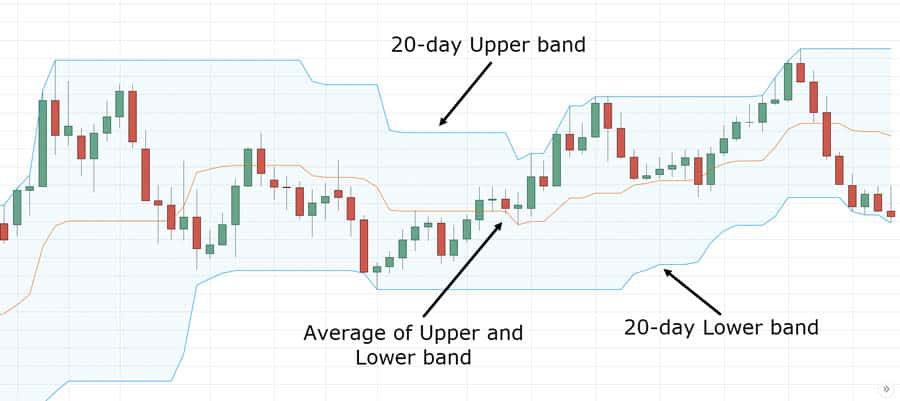
- Upper Band: The highest high over the past ‘n’ periods (e.g., 20 periods).
- Lower Band: The lowest low over the past ‘n’ periods.
- Middle Line: (Upper Band + Lower Band) / 2. This is often used for re-entry or as a mean-reversion signal.
The only parameter to set is the lookback period (‘n’). A shorter period (like 20) is sensitive and good for short-term breakouts, while a longer period (like 50 or 100) captures more significant, long-term trends.
Core Scenario: Breakouts and Reversals
The Donchian Channel is built for one primary purpose: identifying breakouts.
- Breakout Entries: The classic strategy is to buy when the price touches or closes above the upper band and sell or go short when it touches or closes below the lower band. This is the ultimate donchian channel vs keltner channel for breakout strategy. It guarantees you are in the market as soon as a new high or low is made.
- Trailing Stops: The opposing band is a popular trailing stop method. If you are in a long position, the 20-period low (the lower band) acts as your stop-loss. This allows the trend to develop while systematically locking in gains.
- Reversal Signals: While primarily a trend-following tool, some traders use failures at the bands to signal reversals. If the price hits the upper band but fails to follow through and quickly drops back to the middle line, it could indicate exhaustion.
Example Settings and Experience-Based Advice
For swing trading stocks on a daily chart, a 20-day Donchian Channel is standard. For longer-term position trading, a 50-day or even 100-day channel might be more appropriate. A critical piece of experiential advice is to be prepared for false breakouts (whipsaws). The Donchian Channel will get you into a move at the earliest possible moment, but many of these moves will fail. This is why strict risk management (e.g., risking no more than 1-2% per trade) and pairing the channel with a volume or momentum indicator is essential for long-term success. The challenge is not in finding the signal, but in managing the trades that don’t work out.
Trading Strategies Compared Side-by-Side
The true test in the keltner channel vs donchian evaluation comes from comparing their practical trading strategies. While both can be used for trend-following, their methods for entry and trade management are distinct, reflecting their underlying calculations. A trader’s personality—whether patient or aggressive—will often determine which approach feels more natural.
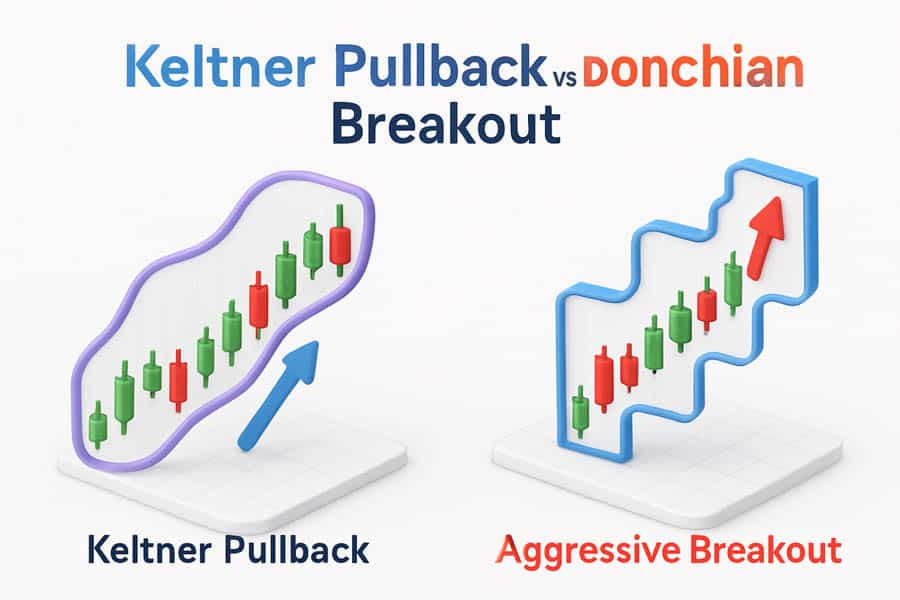
Keltner Pullback vs. Donchian Breakout
Let’s imagine a strong uptrend in a stock.
- The Keltner Channel Strategy: A trader using a Keltner Channel waits for the trend to be established (price consistently above the EMA). They ignore the initial surge that breaks the upper band, viewing it as potentially overextended. Instead, they patiently wait for the price to pull back to the middle EMA line. This is their entry trigger. It’s a “buy the dip” strategy within an uptrend, aiming for a better risk/reward ratio by not chasing the peak.
- The Donchian Channel Strategy: A trader using a Donchian Channel does the exact opposite. The moment the price hits the 20-day high (the upper band), they enter a buy order. They are not waiting for confirmation or a better price. Their goal is to capture the momentum of the breakout from the very start. This is a “buy high, sell higher” strategy, predicated on the idea that new highs lead to further highs. This highlights the core of the keltner channel vs donchian channel strategy debate.
Best for Trend, Range, and Volatility
When markets are clearly trending, both indicators are effective. However, the Donchian Channel will often get you into the trend earlier, while the Keltner Channel offers what many feel are safer entry points. In choppy, range-bound markets, the Keltner Channel’s volatility-based bands provide a better guide, as they contract and show the lack of directional energy.
The Donchian Channel struggles here, as minor pushes up and down can create flat upper and lower bands far from the current price, offering little useful information and potentially triggering many false breakouts. In highly volatile markets, the Keltner Channel’s ATR-based bands will expand significantly to account for the wild swings, helping to prevent premature stop-outs. The Donchian will simply reflect the new, wider highs and lows.
Advanced Tactics and Hybrid Models
Truly experienced traders rarely use an indicator in isolation. The real art of technical analysis lies in combining tools to filter each other’s weaknesses and confirm their strengths. The keltner channel vs donchian matchup is a perfect example of how two similar tools can be layered to create a robust trading system.
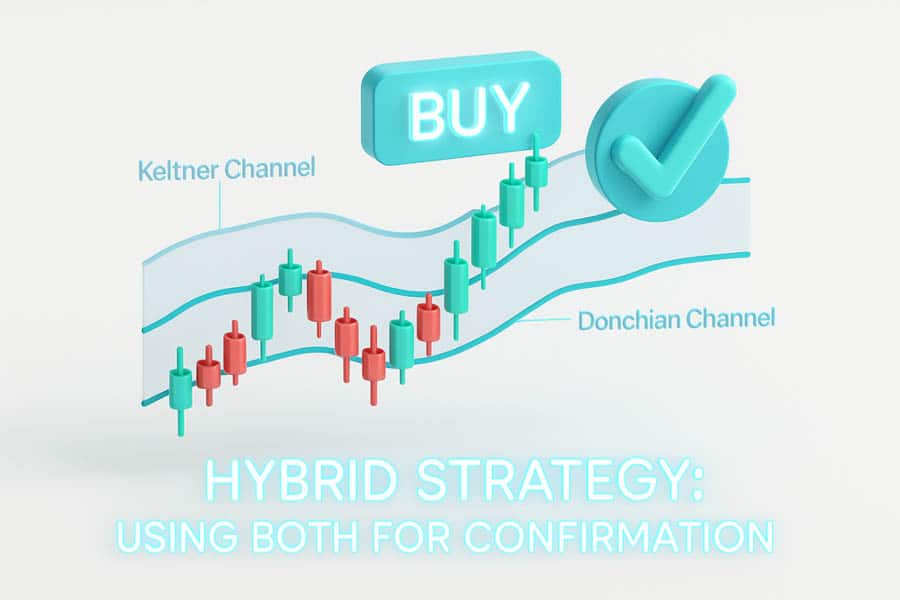
Using Both Together for Confirmation
A powerful hybrid strategy involves using the Donchian Channel for entries and the Keltner Channel for context and confirmation. Here’s how it works:
- Trend Filter: Use a 20-period Keltner Channel to define the primary trend. A long trade is only considered if the price is trading above the middle EMA line.
- Entry Trigger: Use a 20-period Donchian Channel for the entry signal. The buy order is placed only when the price breaks the upper Donchian band *and* the Keltner trend filter is bullish.
This method uses the Keltner Channel to ensure you are only taking breakouts in the direction of the underlying trend, effectively filtering out many of the false signals that plague a pure donchian channel vs keltner channel for breakout system.
Layering with RSI, Volume, and ADX
To further refine signals, other indicators can be added:
- Relative Strength Index (RSI): When entering a Keltner Channel pullback, check that the RSI has not fallen below 40, which would suggest the momentum has weakened too much. For Donchian breakouts, a rising RSI above 50 confirms the bullish momentum.
- Volume: A Donchian breakout is far more reliable if it occurs on a significant spike in volume. This indicates strong conviction behind the move. A pullback to a Keltner EMA on low volume shows a lack of selling pressure, making the subsequent bounce more likely.
- Average Directional Index (ADX): The ADX is the ultimate context filter. An ADX reading above 25 suggests the market is trending, validating signals from both Keltner and Donchian Channels. If the ADX is below 20, it signals a ranging market, and you should be highly skeptical of any breakout signals.
Adapting for Crypto, Forex, and Stocks
The beauty of these channel indicators is their versatility. However, parameters may need tweaking.
- Crypto: Due to its high volatility, you might use a wider ATR multiplier (2.5x or 3x) on Keltner Channels to avoid being stopped out prematurely. Longer Donchian periods (e.g., 30 or 50) can help filter the noise.
- Forex: Standard settings (20-period) work well in the forex market, especially on daily and 4-hour charts. The keltner channel vs donchian debate is very active here, with pullback strategies often favored.
- Stocks: For stocks, a 50-day Donchian Channel is a classic setting for identifying intermediate-term breakouts, while a 20-day Keltner Channel is excellent for swing trading pullbacks.
Read More: Keltner Channels vs Bollinger Bands
Mistakes to Avoid (From Experience)
From years of watching traders, myself included, use these tools, a few common and costly mistakes emerge. Avoiding these pitfalls is just as important as knowing the right strategies.
Overfitting Parameters
This is the most common error. A trader has a losing streak and assumes the indicator settings are wrong. They tweak the periods and multipliers until the indicator looks perfect on past data. This “over-optimization” creates a system that is perfectly tailored to the past but fails in live market conditions. Stick to standard settings (like 20 periods) and learn their behavior rather than endlessly curve-fitting.
Ignoring the Market Regime
Trying to trade Donchian breakouts in a tight, choppy range is a recipe for disaster. Likewise, looking for Keltner Channel pullbacks when there is no clear trend will lead to frustration. Before even looking at your channel, ask: “Is this market trending or ranging?” Use tools like the ADX or simply zoom out and look at the higher timeframe price structure to answer this. The core of the keltner channel vs donchian decision depends on the market context.
Using Too Many Conflicting Signals
While layering indicators is smart, creating a “Frankenstein’s monster” on your chart is not. If you have a Keltner Channel, a Donchian Channel, three moving averages, RSI, and MACD all on one chart, you will suffer from analysis paralysis. Choose one or two complementary tools to support your primary channel indicator and stick with them. A clean chart leads to clear decisions.
Trade with a Top-Tier Forex Broker
Enhance your trading strategies with Opofinance, an ASIC-regulated broker dedicated to empowering traders. Benefit from a suite of advanced tools and features designed for the modern market.
- Advanced Trading Platforms: Choose from MT4, MT5, cTrader, and the proprietary OpoTrade platform.
- Innovative AI Tools: Gain an edge with our AI Market Analyzer, AI Coach, and 24/7 AI Support.
- Flexible Trading Options: Explore opportunities in Social & Prop Trading.
- Secure & Convenient Transactions: Enjoy safe deposits and withdrawals, including crypto payments with zero fees.
Take your trading to the next level. Discover the Opofinance advantage today!
Conclusion: Matching the Channel to Your Strategy
Ultimately, the keltner channel vs donchian choice comes down to your trading personality and strategy. If you are a patient trend-follower who prefers to buy on dips and seeks confirmation, the Keltner Channel is your ideal companion. If you are an aggressive breakout trader who wants to be in on a move the moment it happens and can handle the higher rate of false signals, the Donchian Channel is the superior tool. Neither is inherently better, but one will undoubtedly be a better fit for you.
References: +
Is one better for scalping?
For scalping, Keltner Channels are often preferred. Their responsiveness to short-term volatility (ATR) can provide more nuanced signals on lower timeframes than the rigid price levels of Donchian Channels.
Which channel is better for identifying trend strength?
Keltner Channels are generally better for gauging trend strength. The slope of the entire channel and the price consistently “riding” the upper or lower band provide a clear visual cue of momentum.
Can I use a Donchian Channel for mean reversion?
While it’s not its primary use, some traders use the middle line of the Donchian Channel as a target for mean-reversion trades, especially in non-trending markets.
Why do Keltner Channels use an EMA instead of an SMA?
Keltner Channels use an Exponential Moving Average (EMA) because it gives more weight to recent price data, making the channel more responsive to changes in the trend compared to a Simple Moving Average (SMA).
What is the biggest weakness of the Donchian Channel?
Its biggest weakness is its performance in ranging or choppy markets. It can produce numerous false breakout signals, leading to whipsaws and small losses that can accumulate if not managed properly.


