

In the world of technical analysis, the Keltner Channels vs Bollinger Bands debate is a cornerstone for traders aiming to master market volatility. Both are powerful envelope-based indicators that help visualize price volatility and potential trend reversals, but they differ fundamentally in their calculation and trading application. The core distinction lies in their methodology: Keltner Channels use the Average True Range (ATR) to create smoother bands, making them ideal for trend confirmation, whereas Bollinger Bands utilize standard deviation, resulting in bands that react more dynamically to sharp volatility spikes, often signaling overbought or oversold conditions.
This article will dissect the difference between Keltner Channel and Bollinger Bands, explore their unique strengths, and provide actionable strategies to help you decide which tool, or combination of tools, best fits your approach, especially when trading with a top-tier online forex broker. We will cover everything from their mathematical foundations to advanced trading setups like the “squeeze.”
Key Takeaways:
- Core Calculation Difference: Keltner Channels use the Average True Range (ATR) for band width, resulting in smoother channels. Bollinger Bands use standard deviation, making them more responsive to immediate volatility changes.
- Moving Average Type: Keltner Channels are typically based on an Exponential Moving Average (EMA), giving more weight to recent prices. Bollinger Bands use a Simple Moving Average (SMA), which treats all prices in the period equally.
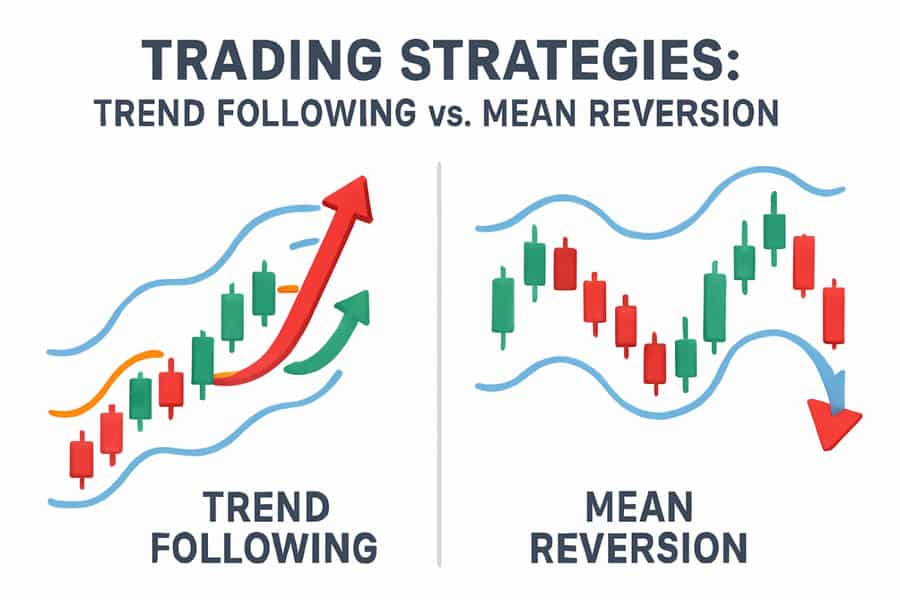
- Best Use Cases: Keltner Channels are often preferred for identifying and following trends due to their smoothness. Bollinger Bands excel in mean-reversion strategies and spotting potential price reversals in ranging markets.
- Sensitivity: Bollinger Bands are more sensitive and expand and contract more dramatically with volatility spikes. Keltner Channels offer a more stable, averaged view of volatility.
- Combining for Power: Traders can use both indicators together. A “squeeze” where Bollinger Bands move inside Keltner Channels can signal an impending high-volatility breakout, offering a powerful confirmation signal.
Keltner Channels vs Bollinger Bands
At a glance, the choice between Keltner Channels and Bollinger Bands hinges on your trading philosophy. If you are a trend-following trader who values smooth, clear signals over market noise, Keltner Channels are likely your superior tool. They provide a stable framework for identifying the strength and direction of a sustained move. Conversely, if your strategy thrives on volatility and identifying potential turning points—buying at bottoms and selling at tops in a ranging market—Bollinger Bands offer more sensitive, immediate feedback. The core of the keltner channel vs bollinger bands comparison is ATR vs. Standard Deviation; one measures the average trading range, while the other measures price dispersion, leading to fundamentally different interpretations of market behavior.
Decision Table: Which to Use When?
| Scenario | Recommended Indicator | Reasoning |
| Identifying and riding a strong, stable trend | Keltner Channels | The ATR-based calculation creates smoother bands that filter out minor price fluctuations, making the primary trend clearer. |
| Trading in a sideways or ranging market | Bollinger Bands | Their standard deviation basis excels at identifying overbought/oversold levels relative to the central moving average, ideal for mean-reversion trades. |
| Spotting potential price reversals quickly | Bollinger Bands | The bands expand and contract dynamically with volatility, so a price touching or exceeding a band is a more immediate reversal signal. |
| Confirming the strength of a breakout | Keltner Channels | A decisive close outside a Keltner Channel is often a stronger signal of a sustained breakout due to the indicator’s lower sensitivity to momentary spikes. |
| Anticipating a volatility explosion (a “squeeze”) | Both (Used Together) | The classic “squeeze” setup involves Bollinger Bands tightening inside the Keltner Channels, providing a powerful, combined signal of imminent volatility. |
What Are Keltner Channels?
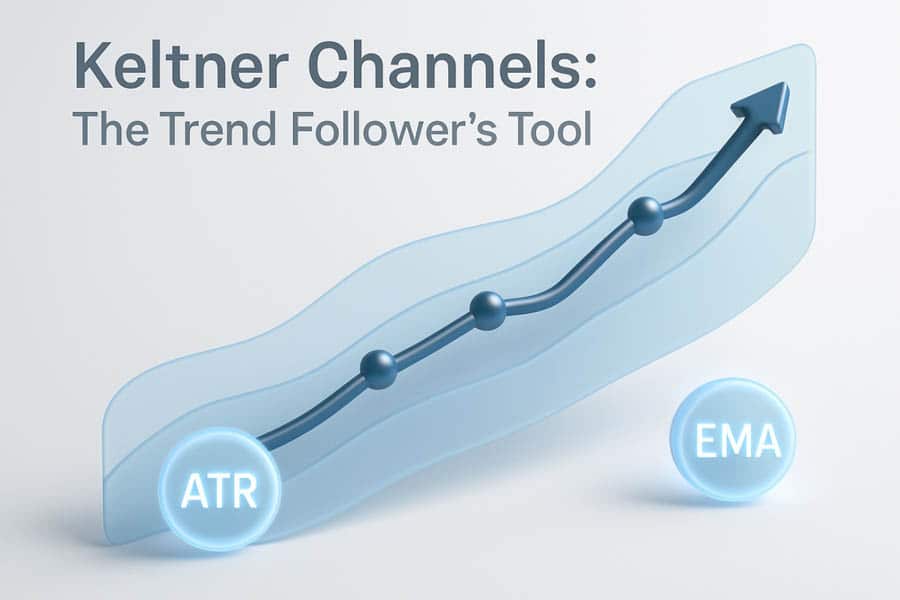
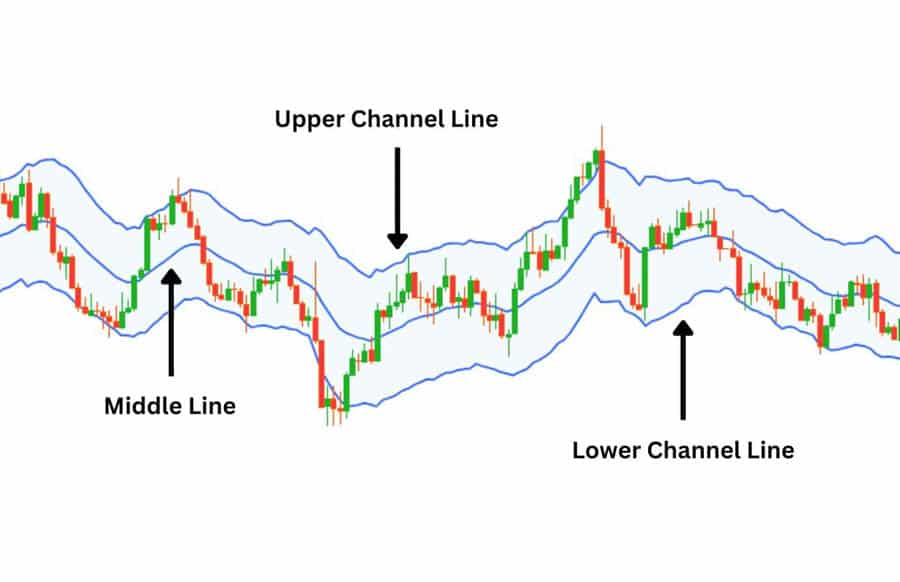
Keltner Channels are a volatility-based technical indicator developed by Chester W. Keltner in his 1960 book, “How to Make Money in Commodities.” The modern version, refined by Linda Bradford Raschke, consists of three lines: a central Exponential Moving Average (EMA) and two outer channel lines plotted above and below it. These outer bands are derived from the Average True Range (ATR), a pure measure of volatility. This construction makes Keltner Channels an excellent tool for identifying trends and gauging their strength in a smoother, more deliberate manner than their counterparts.
How Keltner Channels Are Calculated
The calculation is straightforward and highlights the indicator’s reliance on average price and volatility:
- Middle Line: 20-period Exponential Moving Average (EMA)
- Upper Channel Line: 20-period EMA + (2 x 10-period ATR)
- Lower Channel Line: 20-period EMA – (2 x 10-period ATR)
The use of an EMA for the centerline means more weight is given to recent price data, making it quicker to react to trend changes than a Simple Moving Average. The ATR provides a normalized measure of volatility, ensuring the channel width adapts to the market’s true trading range, not just closing price dispersion.
Key Strengths of Keltner Channels
The primary advantage of Keltner Channels is their smoothness. Because the ATR is itself an average, it doesn’t overreact to sudden, isolated price spikes. This leads to channel bands that are more stable and less prone to generating false signals in choppy markets. This characteristic is why many traders favor Keltner Channels vs Bollinger Bands for trading strong trends. When price consistently “walks the band” (i.e., trades near the upper or lower channel line without breaking back to the middle), it’s a strong confirmation of trend momentum.
Read More: Keltner Channels
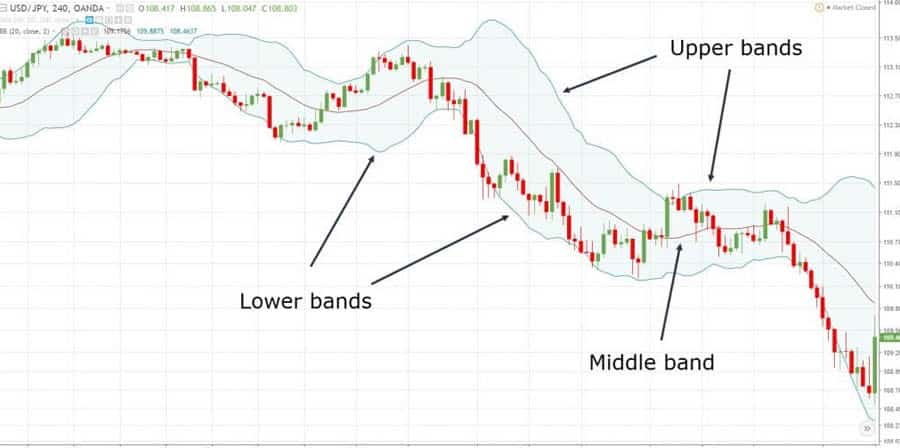
What Are Bollinger Bands?
Developed by John Bollinger in the 1980s, Bollinger Bands are another powerful volatility indicator. They also consist of three lines, but their construction is mathematically distinct from Keltner Channels. Bollinger Bands use a Simple Moving Average (SMA) for the centerline and standard deviation to calculate the distance of the upper and lower bands from the center. Standard deviation is a statistical measure of price dispersion, meaning the bands will widen dramatically when volatility increases and contract when the market becomes quiet. This dynamic nature is their defining feature.
How Bollinger Bands Are Calculated
The formula for Bollinger Bands is as follows:
- Middle Band: 20-period Simple Moving Average (SMA)
- Upper Band: 20-period SMA + (2 x 20-period Standard Deviation)
- Lower Band: 20-period SMA – (2 x 20-period Standard Deviation)
The use of an SMA provides a simple average of price over the lookback period. The key component is the standard deviation, which makes the bands highly responsive. A significant price move will increase the standard deviation, causing the bands to expand rapidly, while a quiet market will cause them to tighten, often signaling a period of consolidation.
Key Strengths of Bollinger Bands
The main strength of Bollinger Bands is their exceptional responsiveness to volatility. This makes them highly effective for identifying periods of extreme price movement and potential reversals. The basic premise is that price tends to return to the mean. Therefore, a touch of the upper band might suggest an overbought condition (a potential sell signal), and a touch of the lower band might indicate an oversold condition (a potential buy signal). This makes them a favorite tool for mean-reversion traders operating in ranging markets. The famous “Bollinger Band Squeeze,” where the bands narrow significantly, is one of the most reliable indicators of impending volatility.
Difference Between Keltner Channel and Bollinger Bands
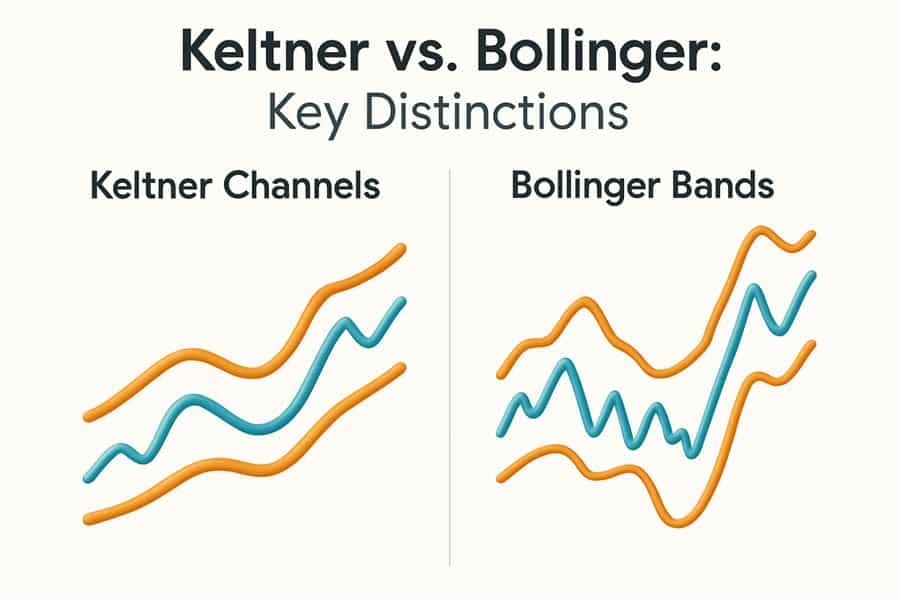
Understanding the difference between Keltner Channel and Bollinger Bands is crucial for applying them correctly. While they appear similar on a chart, their underlying mechanics create different signals and suit different trading styles. The distinctions are rooted in their calculation methods, choice of moving average, and subsequent reaction to market volatility. As a trader, I’ve found that appreciating these nuances has been key to my strategy development, especially when deciding between trend-following and mean-reversion setups.
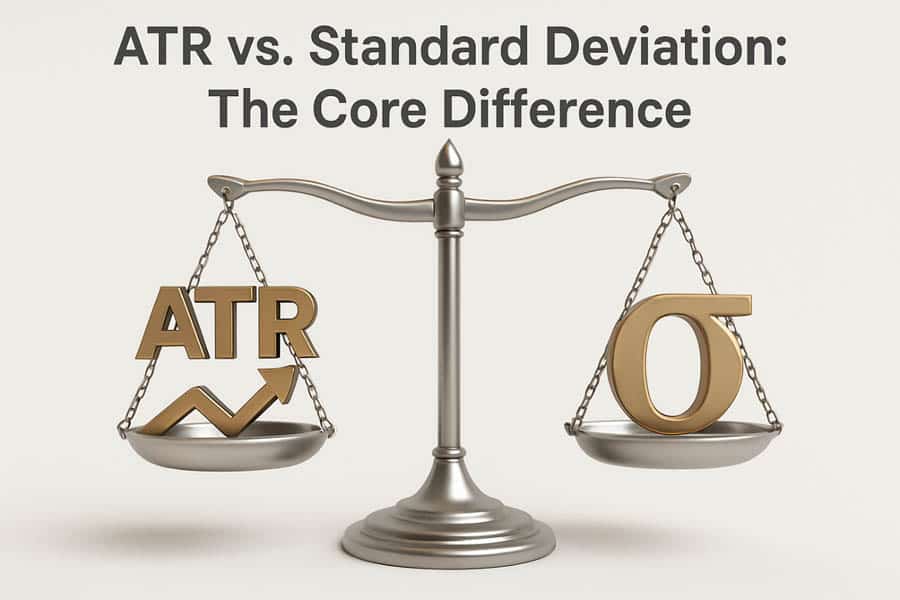
Calculation Method: ATR vs. Standard Deviation
This is the most significant difference. Keltner Channels use the Average True Range (ATR), which measures the average size of price swings over a period. It provides a smooth, consistent measure of volatility. Bollinger Bands use standard deviation, which measures how spread out prices are from the average. This makes standard deviation much more sensitive to outliers. A single large price candle can dramatically widen Bollinger Bands, while its effect on Keltner Channels would be averaged out and more subdued.
Type of Moving Average: EMA vs. SMA
Keltner Channels use an Exponential Moving Average (EMA) as their centerline. An EMA gives more weight to recent prices, allowing it to react more quickly to new trend information. Bollinger Bands use a Simple Moving Average (SMA), which gives equal weight to all data points in the period. This makes the SMA smoother and slower to react than the EMA. The choice between EMA and SMA influences the responsiveness of the entire channel system.
Read More: Bollinger Bands swing trading strategy
Reaction to Volatility (Sensitivity)
The result of these differences is that Bollinger Bands are far more sensitive to volatility. They expand and contract dynamically and significantly. Keltner Channels are much smoother and more stable. In a strong trend, price can “ride” the outer Bollinger Band, which will continuously expand to contain the move. In contrast, a close outside a Keltner Channel is a rarer and often more significant event, signaling exceptional strength or a potential exhaustion point.
Best Use Cases
This is where the keltner channels vs bollinger bands for trading debate gets practical.
- Keltner Channels: Best for trend identification and confirmation. Their smoothness helps traders stay in a trend without being shaken out by minor volatility. A steady uptrend will often see prices bouncing off the middle EMA and staying within the upper half of the channel.
- Bollinger Bands: Best for mean reversion and identifying relative price extremes. In a ranging market, prices hitting the outer bands are often interpreted as signals to trade back toward the middle SMA. They are also superior at signaling the start of a new move after a period of low volatility (the squeeze).
Quick Comparison Table
| Feature | Keltner Channels | Bollinger Bands |
| Centerline | Exponential Moving Average (EMA) | Simple Moving Average (SMA) |
| Band Calculation | Average True Range (ATR) | Standard Deviation (StdDev) |
| Sensitivity | Lower (Smoother) | Higher (More Dynamic) |
| Primary Use | Trend Following & Confirmation | Mean Reversion & Volatility Breakouts |
| Signal Generation | Sustained moves outside the channel signal trend strength. | Touches of outer bands signal potential overbought/oversold levels. |
Pros and Cons: Keltner vs Bollinger
Every tool has its strengths and weaknesses, and the choice often comes down to personal preference and trading style. Weighing the pros and cons in the context of your own strategy is essential. From my experience, what one trader sees as a flaw (e.g., Bollinger Bands’ high sensitivity), another might see as a critical feature.
Keltner Channels: Pros and Cons
- Pros:
- Smoother Signals: Filters out market noise, making it easier to identify the underlying trend.
- Fewer False Breakouts: Because the bands are less reactive, a price close outside the channel is a more reliable signal of trend strength.
- Excellent for Trend Confirmation: The angle and direction of the channel provide a clear visual guide to the market’s trajectory.
- Cons:
- Slower to React: The use of ATR and EMA can cause a lag in signaling trend changes or volatility spikes.
- Less Effective in Ranging Markets: The bands may not provide clear overbought or oversold levels in a sideways market.
Bollinger Bands: Pros and Cons
- Pros:
- Highly Responsive to Volatility: Instantly shows changes in market conditions, making them great for volatility traders.
- Excellent for Mean Reversion: Provide clear, statistically-based levels of potential overbought and oversold conditions.
- The “Squeeze” Signal: The contraction of the bands is a renowned and reliable signal of an impending breakout.
- Cons:
- Prone to False Signals: High sensitivity can lead to “head fakes,” where price touches a band but continues in the same direction.
- Can Be Deceptive in Strong Trends: In a powerful trend, price can “walk the band” for an extended period, making it appear overbought or oversold when it is simply a sign of strength. This can trap mean-reversion traders.
How to Use Them: Strategies & Tips
Theory is one thing, but practical application is what matters. Both indicators offer a range of powerful trading strategies. The key is to align the strategy with the indicator’s strengths and the prevailing market conditions. I’ve found that combining them often yields the most robust signals, leveraging the strengths of both while mitigating their weaknesses.
Popular Trading Strategies
- Keltner Channel Trend Following: Enter a long position when price closes above the upper channel line in a confirmed uptrend (channel is angled up). Use the middle EMA line as a dynamic support level for placing stops or adding to the position on pullbacks. Reverse for downtrends.
- Bollinger Band Mean Reversion: In a ranging (sideways) market, sell when price touches the upper band and buy when it touches the lower band. The middle SMA serves as a natural profit target.
- The Bollinger Band Squeeze Breakout: Identify a period where the Bollinger Bands contract to a narrow range. Place buy and sell stop orders on either side of the range to catch the inevitable volatility breakout when it occurs.
Combining Both for Confirmation Signals
A powerful technique involves overlaying both indicators on a single chart. The most famous combined strategy is the TTM Squeeze (or a simplified version of it), which looks for periods when the Bollinger Bands move inside the Keltner Channels. This indicates extremely low volatility and signals that a powerful move is building up. The strategy is to wait for the Bollinger Bands to expand back outside the Keltner Channels and then trade in the direction of the breakout.
Common Beginner Mistakes to Avoid
- Using the Wrong Indicator for the Market: Trying to trade mean-reversion with Bollinger Bands in a strong, trending market is a recipe for disaster. Likewise, expecting Keltner Channels to give precise reversal points in a choppy market will lead to frustration.
- Trading Signals in Isolation: Never use a channel break or touch as a standalone signal. Always confirm with other factors like price action (e.g., candlestick patterns), volume, or a momentum oscillator like the RSI or MACD.
- Ignoring the Centerline: The middle moving average in both indicators is a crucial piece of information. It acts as a dynamic support/resistance level and represents the market’s short-term equilibrium.
Advanced: The “Squeeze” Setup
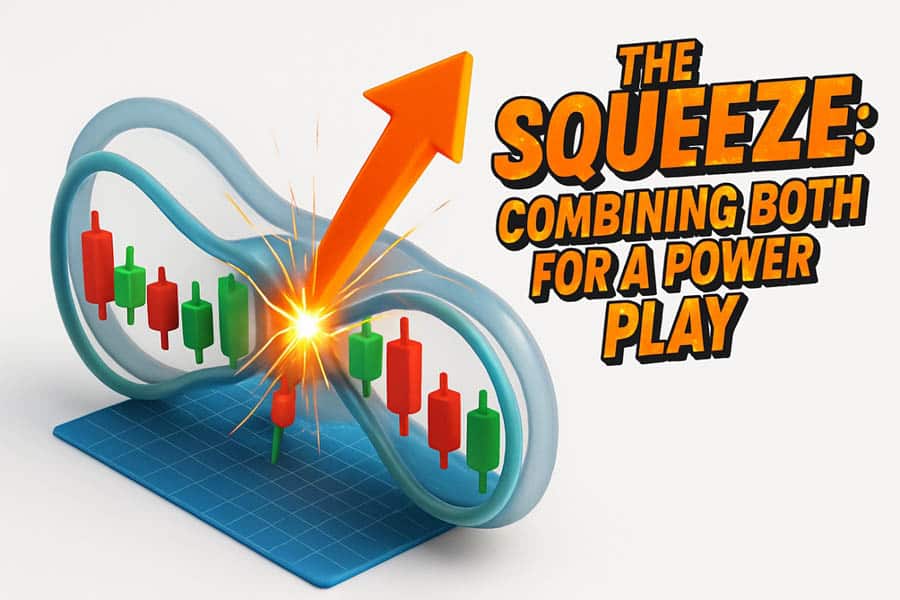
The “squeeze” is one of the most powerful concepts in volatility trading and a prime example where the Keltner Channels vs Bollinger Bands discussion leads to synergy rather than conflict. A squeeze occurs when volatility drops to an unsustainably low level, indicating that the market is coiling up for a significant price move. Both indicators can signal a squeeze, but combining them provides a more robust and visually clear setup.
Read More: how to use bollinger bands in forex trading
How the Squeeze Works
The logic is simple: markets constantly cycle between periods of low volatility (consolidation) and high volatility (trending or breakouts). The squeeze identifies the end of a low-volatility period, positioning a trader to capitalize on the ensuing expansion. John Bollinger himself noted that periods of low volatility are often followed by periods of high volatility.
The Bollinger Band and Keltner Channel Squeeze
The classic squeeze setup, popularized by traders like John Carter, is defined by one condition: the Bollinger Bands move inside the Keltner Channels.
- Setup: Plot both Bollinger Bands (e.g., 20,2) and Keltner Channels (e.g., 20,2,10) on your chart.
- Squeeze Identification: When you see both the upper and lower Bollinger Bands fall inside the boundaries of the Keltner Channels, the squeeze is on. This visually confirms that standard deviation volatility has become lower than the average trading range volatility—a very quiet market.
- Entry: The squeeze itself is not a directional signal. It simply says, “get ready.” The entry signal comes when the Bollinger Bands expand and price breaks out of the Keltner Channel. A close above the upper Keltner Channel signals a long entry; a close below the lower Keltner Channel signals a short entry.
- Exit: Stops are typically placed just on the other side of the recent consolidation range or at the middle moving average.
This combined setup is powerful because it uses the Keltner Channel as a stable volatility benchmark and the Bollinger Band as the sensitive trigger. When the trigger (Bollinger Bands) becomes quieter than the benchmark (Keltner Channels), it’s a high-probability sign that energy is being stored for a big move.
Trade with an Edge at Opofinance
Enhance your trading strategies, whether using Keltner Channels, Bollinger Bands, or a combination of both, with a broker built for modern traders. Opofinance, an ASIC-regulated broker, provides the tools and security you need to succeed.
- Advanced Trading Platforms: Choose from MT4, MT5, cTrader, and the proprietary OpoTrade platform.
- Innovative AI Tools: Leverage the AI Market Analyzer, AI Coach, and 24/7 AI Support to gain unique insights.
- Flexible Trading Options: Explore opportunities in Social Trading and Prop Trading.
- Secure & Convenient Transactions: Enjoy safe deposits and withdrawals, including crypto payments with zero fees.
Start trading with Opofinance today!
Conclusion: Choosing the Best Indicator for You
Ultimately, the Keltner Channels vs Bollinger Bands debate has no single winner. The “best” indicator is the one that aligns with your trading personality, strategy, and the current market environment. Keltner Channels offer a smoother, trend-oriented view, making them a reliable companion for position and swing traders. Bollinger Bands provide a dynamic, moment-to-moment picture of volatility, perfect for mean-reversion traders and those looking to time entries with surgical precision. The most advanced traders often learn to use both, leveraging their combined power to confirm signals and identify high-probability setups like the squeeze.
Can you use Keltner Channels and Bollinger Bands at the same time?
Absolutely. Using them together is a popular advanced strategy. The most common use is to identify a “squeeze,” where Bollinger Bands move inside the Keltner Channels, signaling an imminent volatility breakout and providing a powerful, confirmed trading setup.
Is one indicator better for crypto and another for forex?
Not necessarily. Both indicators work across all markets. However, due to the high volatility of cryptocurrencies, the smoother signals from Keltner Channels might be preferable for identifying the underlying trend amidst the noise. In forex, where pairs often enter ranging periods, Bollinger Bands can be highly effective for identifying overbought/oversold levels.
Do professional traders actually use these indicators?
Yes, many professional traders use Keltner Channels and Bollinger Bands, but rarely in isolation. They are used as part of a comprehensive trading plan that includes price action analysis, risk management, and often other confirming indicators. Their primary value lies in visualizing volatility, which is a key component of any market analysis.
What are the standard settings for each indicator?
The standard settings are a good starting point. For Bollinger Bands, it’s a 20-period simple moving average with the bands set at 2 standard deviations. For Keltner Channels, it’s typically a 20-period exponential moving average with the bands set at 2 times the 10-period Average True Range.
Which indicator is better for beginners?
Many find Keltner Channels slightly easier to interpret initially due to their smoother nature, which provides clearer trend signals. Bollinger Bands’ high sensitivity can be confusing for new traders who might misinterpret every touch of a band as a reversal signal. However, both require practice to master.


