

In the fast-paced world of forex trading, identifying liquidity zones is crucial for maximizing profits and minimizing risks. Liquidity zones are areas in the market where significant buying or selling activity occurs, often leading to sharp price movements. To identify liquidity zones in forex, traders must analyze price action, understand market structure, and utilize key technical indicators. Partnering with a reliable broker for forex trading can also play a pivotal role in implementing these strategies effectively. This article will explore five effective strategies to help you pinpoint these vital areas and enhance your trading performance.

Factors Influencing Liquidity Zones
Several key factors contribute to the formation and significance of liquidity zones in the forex market:

1. Market Structure
The overall structure of the market, including trends, ranges, and key support and resistance levels, plays a crucial role in determining where liquidity zones may form.
2. Economic Events
Major economic releases, central bank announcements, and geopolitical events can create significant liquidity zones as market participants react to new information.
3. Institutional Order Flow
Large financial institutions often place substantial orders at specific price levels, creating liquidity zones that can influence market movements.
4. Technical Levels
Key technical levels, such as round numbers, Fibonacci retracements, and pivot points, often attract liquidity and can form important zones.
How to Identify Liquidity Zones in Forex: 5 Powerful Techniques
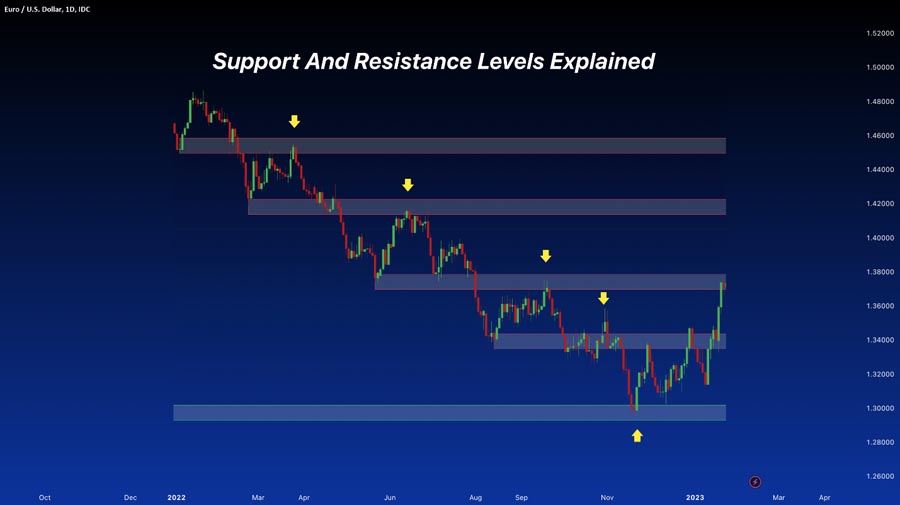
1. Analyze Support and Resistance Levels
One of the most reliable ways to identify liquidity zones is by examining support and resistance levels. These levels often attract large volumes of orders, creating potential liquidity hotspots. To find these zones:
- Use horizontal line tools to mark previous highs and lows on your chart
- Pay attention to round numbers, as they often act as psychological barriers
- Look for areas where price has repeatedly bounced or reversed
By focusing on these key levels, you’ll be better equipped to spot potential liquidity zones and make informed trading decisions.
Read More: Identifying Support and Resistance in Forex
Advanced Support and Resistance Techniques
To further refine your analysis of support and resistance levels, consider incorporating these advanced techniques:
- Dynamic Support and Resistance: Use moving averages, such as the 50-day and 200-day EMAs, to identify dynamic support and resistance levels. These levels often act as liquidity zones, especially when price approaches them from a distance.
- Trendlines: Draw trendlines connecting higher lows in an uptrend or lower highs in a downtrend. The intersection of these trendlines with horizontal support and resistance levels can create powerful liquidity zones.
- Pivot Points: Calculate daily, weekly, or monthly pivot points to identify potential support and resistance levels. These mathematically derived levels often attract significant trading activity and can serve as liquidity zones.
- Multi-Timeframe Analysis: Analyze support and resistance levels across multiple timeframes to identify confluent zones. Areas where support or resistance align on different timeframes are more likely to be significant liquidity zones.
2. Utilize Order Flow Analysis
Order flow analysis is a powerful technique for identifying liquidity zones in forex. This method involves:
- Studying the depth of market (DOM) to gauge buying and selling pressure
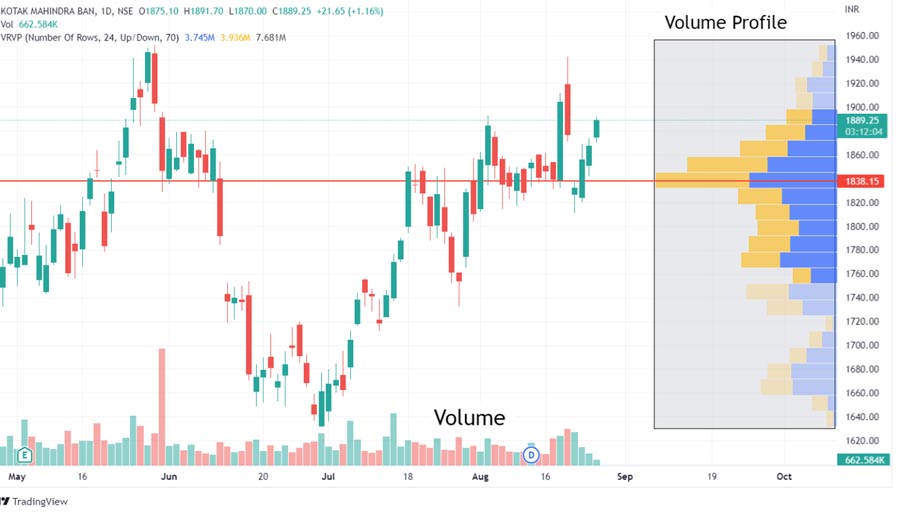
- Analyzing volume profiles to identify areas of high trading activity
- Observing price action around key levels to detect institutional order placement
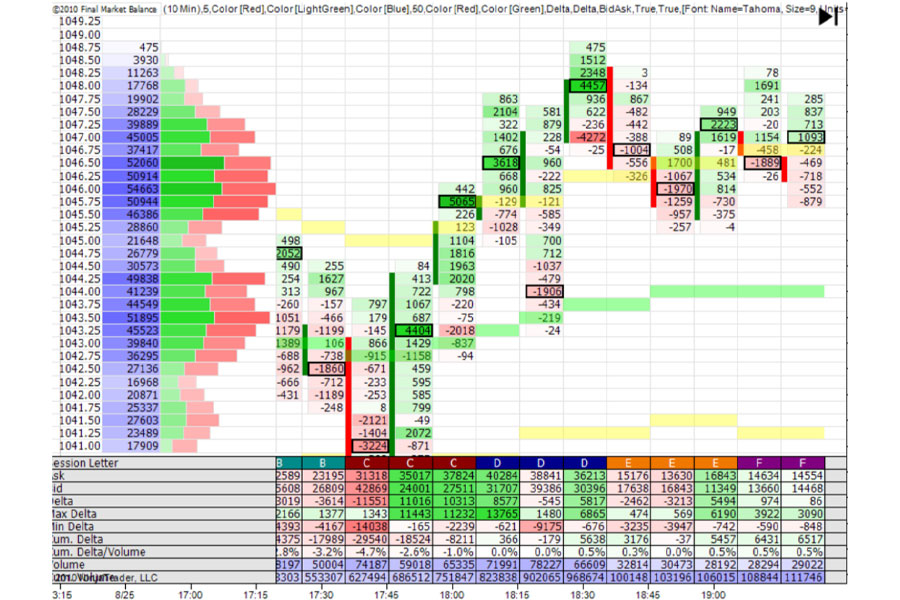
By incorporating order flow analysis into your trading strategy, you’ll gain valuable insights into where liquidity is concentrated and how it may impact price movements.
Advanced Order Flow Techniques
To take your order flow analysis to the next level, consider these advanced approaches:
- Footprint Charts: Use footprint charts to visualize the buying and selling pressure at each price level. These charts can help you identify areas where large orders are being filled, potentially indicating liquidity zones.
- Market Delta: Analyze the difference between buying and selling volume at each price level to identify areas of accumulation or distribution. Significant imbalances can point to potential liquidity zones.
- Time and Sales: Monitor the time and sales data to detect large trades or unusual trading patterns. Clusters of large trades at specific price levels may indicate the presence of liquidity zones.
- Order Flow Divergences: Look for divergences between price action and order flow. For example, if price is making new highs but buying volume is decreasing, it may indicate a potential reversal and the formation of a liquidity zone.
3. Implement the Market Structure Approach
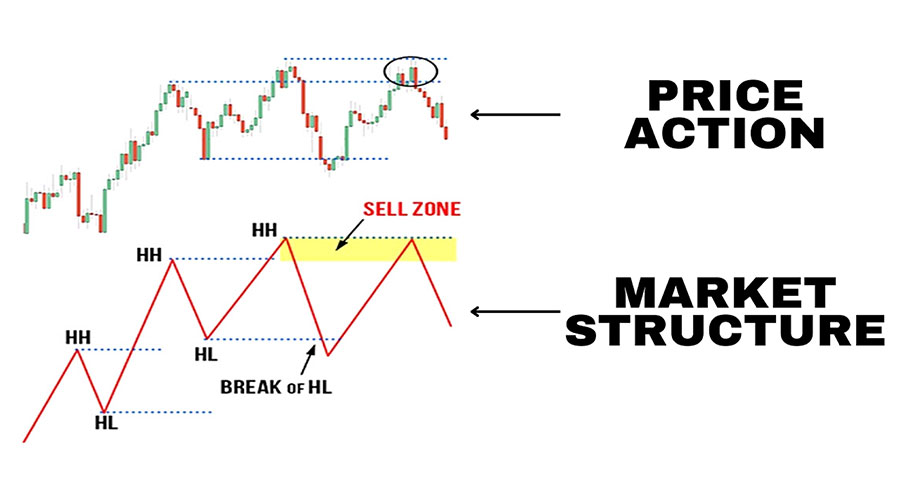
Understanding market structure is essential for identifying liquidity zones. This approach involves:
- Recognizing higher highs and lower lows to determine trend direction
- Identifying swing highs and lows as potential liquidity areas
- Looking for breaks of structure that may indicate a shift in market sentiment
By mastering market structure analysis, you’ll be better equipped to anticipate where liquidity zones may form and how they might influence price action.
Advanced Market Structure Techniques
To enhance your market structure analysis, consider these advanced strategies:
- Order Blocks: Identify order blocks, which are areas where significant buying or selling pressure has occurred in the past. These blocks often act as liquidity zones when price revisits them.
- Liquidity Pools: Look for areas where multiple stop-loss orders might be clustered, such as just below swing lows or above swing highs. These liquidity pools can attract price action and create trading opportunities.
- Fair Value Gaps: Identify fair value gaps, which are areas where price has moved rapidly, leaving an imbalance in the market. These gaps often act as magnets for price, creating potential liquidity zones.
- Market Structure Fractals: Analyze market structure across multiple timeframes to identify fractal patterns. Areas where structure aligns on different timeframes can be powerful liquidity zones.
4. Leverage Advanced Indicators
While price action is crucial, certain indicators can provide additional insights into liquidity zones. Consider using:
- Volume-weighted average price (VWAP) to identify areas of high trading activity
- Market profile charts to visualize price distribution and potential liquidity pockets
- Fibonacci retracement levels to pinpoint potential reversal zones
Incorporating these advanced indicators into your analysis can help you identify liquidity zones with greater accuracy and confidence.
Innovative Indicator Combinations
To maximize the effectiveness of your indicator-based analysis, try these innovative combinations:
- VWAP + Bollinger Bands: Combine VWAP with Bollinger Bands to identify areas where price is likely to revert to the mean. Deviations from VWAP, especially near Bollinger Band extremes, can indicate potential liquidity zones.
- Market Profile + Volume Profile: Overlay market profile with volume profile to identify high-volume nodes and areas of value. These confluent zones often attract liquidity and can be prime trading areas.
- Fibonacci + Pivot Points: Combine Fibonacci retracement levels with pivot points to identify areas of confluence. When these levels align, they can create strong liquidity zones that attract significant trading activity.
- Ichimoku Cloud + RSI: Use the Ichimoku Cloud to identify key support and resistance levels, and combine it with RSI to gauge momentum. Areas where price interacts with the cloud and RSI reaches overbought or oversold levels can indicate potential liquidity zones.
Read More: Identifying Support and Resistance in Forex
5. Monitor News and Economic Events
Fundamental factors play a significant role in creating liquidity zones. Stay informed by:
- Keeping track of major economic releases and their potential impact on currency pairs
- Monitoring central bank announcements and policy changes
- Analyzing geopolitical events that may influence market sentiment

By staying attuned to these fundamental drivers, you’ll be better prepared to anticipate where liquidity zones may form and how they might affect your trading decisions.
Advanced Fundamental Analysis Techniques
To refine your fundamental analysis and its impact on liquidity zones, consider these advanced approaches:
- Economic Surprise Index: Track economic surprise indices to gauge how actual economic data compares to expectations. Significant deviations can lead to the formation of new liquidity zones as market participants adjust their positions.
- Correlation Analysis: Study correlations between different currency pairs and other financial instruments. Understanding these relationships can help you identify potential liquidity zones across multiple markets.
- Sentiment Indicators: Utilize sentiment indicators such as the Commitment of Traders (COT) report or social media sentiment analysis to gauge market positioning. Extreme sentiment readings can indicate potential liquidity zones where reversals may occur.
- Central Bank Watch: Develop a comprehensive understanding of central bank policies and communication strategies. Pay close attention to forward guidance and policy shifts, as these can create significant liquidity zones around key interest rate levels or policy thresholds.
Read More: Identify Liquidity Zones in Forex
Practical Tips for Applying Liquidity Zone Strategies
To effectively implement these liquidity zone identification strategies in your trading, consider the following practical tips:
- Develop a Systematic Approach: Create a checklist or trading plan that incorporates multiple liquidity zone identification techniques. This systematic approach will help you maintain consistency in your analysis and decision-making process.
- Use Multiple Timeframes: Always analyze liquidity zones across different timeframes to gain a comprehensive view of the market. Start with higher timeframes to identify major zones, then drill down to lower timeframes for precise entry and exit points.
- Practice Risk Management: While liquidity zones can provide excellent trading opportunities, always adhere to strict risk management principles. Use appropriate position sizing and place stop-loss orders at logical levels to protect your capital.
- Keep a Trading Journal: Maintain a detailed trading journal that records your identified liquidity zones, the strategies used to detect them, and the outcomes of your trades. This practice will help you refine your skills and identify areas for improvement over time.
- Continuously Educate Yourself: Stay up-to-date with the latest developments in forex trading and liquidity analysis. Attend webinars, read books, and participate in trading communities to expand your knowledge and learn from experienced traders.
- Backtest and Forward Test: Before implementing new liquidity zone strategies in live trading, thoroughly backtest them using historical data. Once you’ve achieved satisfactory results, forward test the strategies in a demo account to ensure their effectiveness in current market conditions.
- Adapt to Market Conditions: Remember that the effectiveness of liquidity zone strategies may vary depending on market conditions. Be prepared to adjust your approach during different market phases, such as trending, ranging, or highly volatile periods.
- Combine Multiple Strategies: Don’t rely on a single method to identify liquidity zones. Instead, look for confluence between different strategies to increase the probability of success. Areas where multiple techniques point to the same liquidity zone are often the most reliable.
- Be Patient and Disciplined: Identifying and trading liquidity zones requires patience and discipline. Avoid the temptation to force trades when clear liquidity zones are not present. Sometimes, the best trade is no trade at all.
- Review and Refine: Regularly review your trading performance and the effectiveness of your liquidity zone strategies. Be willing to refine your approach based on your results and changing market conditions.
Conclusion
Mastering the art of identifying liquidity zones in forex is a game-changer for traders seeking to elevate their performance. By implementing the five strategies outlined in this article – analyzing support and resistance, utilizing order flow analysis, understanding market structure, leveraging advanced indicators, and monitoring fundamental factors – you’ll be well-equipped to spot these crucial areas of market activity.

Remember, successful trading is not just about identifying liquidity zones but also about developing a comprehensive strategy that incorporates risk management and continuous learning. As you refine your skills in spotting these vital market areas, you’ll gain a significant edge in your forex trading journey.
Stay disciplined, remain patient, and always be willing to adapt your approach as market conditions evolve. With practice and persistence, you’ll soon find yourself navigating the forex markets with increased confidence and precision, all thanks to your ability to identify and capitalize on key liquidity zones.
How often should I reassess liquidity zones in my trading strategy?
Reassess liquidity zones daily for short-term trades and weekly for longer-term positions. Always review after significant market events or unexpected price movements.
Can liquidity zones be used effectively in all timeframes?
Yes, liquidity zones can be applied across various timeframes, but their significance may vary. Higher timeframes generally provide more robust and influential zones.
How can I differentiate between true liquidity zones and false breakouts?
Look for confluence of multiple factors, observe price action characteristics, use volume confirmation, and consider the overall market context to distinguish genuine liquidity zones from false breakouts.


