

Are you tired of jumping into trades only to see them reverse immediately? The solution is the MACD and ADX strategy, a powerful technique that confirms a trend’s momentum and its underlying strength before you risk a single dollar. This method combines the MACD’s ability to spot momentum shifts with the ADX’s power to measure trend intensity. In this comprehensive guide, we’ll dive deep into a step-by-step process for using these indicators together, a method that is essential whether you’re a seasoned pro or just starting with a regulated forex broker. We will explore exactly how to use MACD and ADX together for maximum effect.

Quick-Glance Key Insights
Before we dive deep, here’s a cheat sheet for this powerful strategy. Think of these as the core principles that will keep you on the right side of the market:
- Trend is King, But Strength is the Ace: Never enter a trade unless the ADX is above 25. This is your non-negotiable filter to avoid choppy, trendless markets where most accounts bleed out.
- Wait for Full Alignment: A trade signal is only valid when three things agree: Trend Strength (ADX > 25), Trend Direction (+DI vs. -DI), and Momentum (MACD Crossover). No exceptions.
- Entry is on the Close: Don’t anticipate a signal. A lot can change in the final moments of a candle. Discipline dictates you wait for the candle to close to confirm the signal is locked in.
- Risk Isn’t a Dirty Word: Every single trade must have a pre-defined stop-loss based on a logical market structure (like a swing high/low). This strategy is about probabilities, not certainties.
- Profitability is in the Ratio: This strategy often has a win rate around 45-55%. Your profitability will come from ensuring your winners (with a 1:2 or higher risk/reward) are significantly larger than your losers.
Deconstructing the Power Duo: MACD and ADX

To truly master the MACD ADX combination strategy, you can’t just see the indicators as lines on a screen. You have to understand what they represent in terms of market dynamics and trader psychology. Think of them as your two most trusted advisors. MACD tells you what’s happening right now with buying and selling pressure, while ADX gives you the crucial context of whether that pressure is part of a sustainable move or just short-term noise.
The MACD: Your Momentum Gauge
The Moving Average Convergence Divergence (MACD) is a classic for a reason. At its core, it measures the relationship between a fast-moving average and a slow-moving average. When I first started trading, I was obsessed with finding the perfect entry. The MACD helped me shift my focus from price alone to the momentum behind the price. This change in perspective was a game-changer.
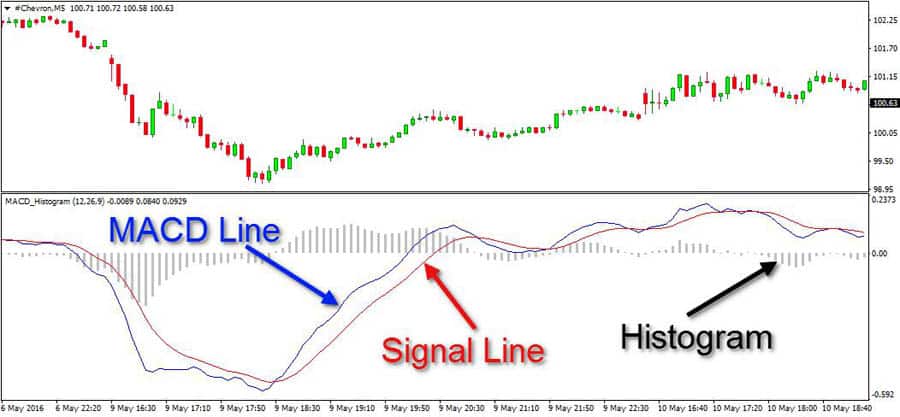
- MACD Line (12-period EMA minus 26-period EMA): This is the engine of the indicator. When it’s moving away from the zero line, momentum is building. When it moves back toward the zero line, momentum is waning.
- Signal Line (9-period EMA of the MACD Line): Think of this as the MACD’s own moving average. It’s slower and smoother. The crossovers between the MACD line and this signal line are our primary momentum triggers.
- Histogram (MACD Line minus Signal Line): This is arguably the most useful component for a quick visual read. Large bars indicate strong momentum, while shrinking bars signal that the current move is running out of steam, often before the price itself shows weakness.
A crucial, more advanced technique with the MACD is spotting divergence. This occurs when the price makes a new high, but the MACD makes a lower high (bearish divergence), or when the price makes a new low, but the MACD makes a higher low (bullish divergence). This is often a powerful early warning that the current trend is exhausted and a reversal may be imminent.
Read More: Trading with adx and rsi
The ADX: Your Trend Strength Filter
The Average Directional Index (ADX) is the component that makes this whole system work. Its job is simple but vital: to quantify how strong a trend is, irrespective of its direction. This is the single biggest point of confusion for new traders. A high ADX reading does not mean the market is bullish; it means the market is trending strongly (which could be up or down). A low ADX means the market is directionless and choppy. Learning how to use MACD and ADX together properly starts with mastering the ADX.
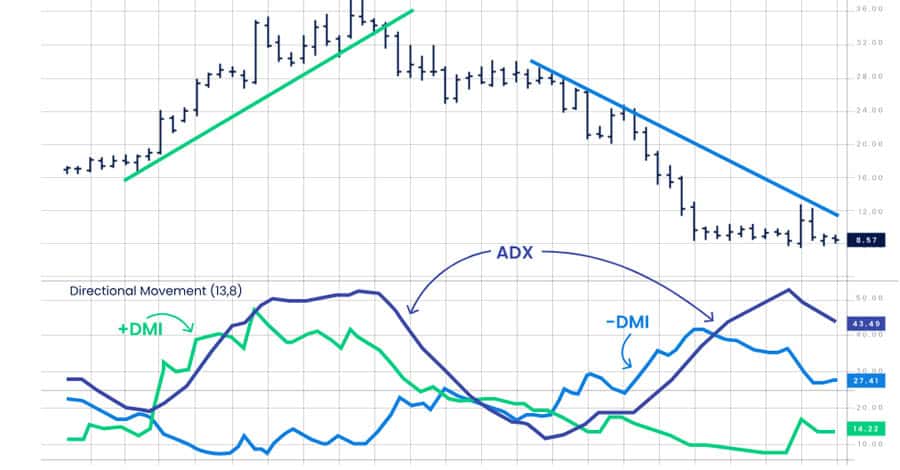
- ADX Line: This line gives us a number from 0-100. My personal rule, and one I highly recommend, is to treat any reading below 25 as a “no-fly zone.” If the ADX is below 25, I am simply not interested in trend trading, period. An ADX rising from below 25 and moving towards 30 and beyond is a sign that a new, powerful trend is emerging.
- Positive Directional Indicator (+DI): Measures the strength of the bulls.
- Negative Directional Indicator (-DI): Measures the strength of the bears.
The trend’s direction is determined by which DI line is on top. If +DI is above -DI, bulls are in control. If -DI is above +DI, bears are in control. The ADX line then tells you how significant that control is. This is the foundation of a successful adx and macd trading strategy.
Read More: MACD Indicator in Forex Trading
Setting Up Your Charts for Success
A cluttered chart leads to a cluttered mind and poor trading decisions. Your setup for the macd and adx strategy should be clean, simple, and functional. You want the price action to be the hero of the story, with your indicators providing the crucial supporting narrative in windows below.
Indicator Settings and Timeframes
Stick with the defaults. The standard settings are used by millions of traders, which creates a self-fulfilling prophecy. When many people see the same signal based on the same settings, their collective action can help propel the move.
- MACD: 12, 26, 9 (Fast EMA, Slow EMA, Signal Line EMA)
- ADX: 14 (Periods)
Regarding timeframes, this strategy is incredibly robust. I’ve used it on everything from a 15-minute chart for intraday moves to a weekly chart for long-term position trades. However, if you are new to the macd adx combination strategy, I strongly suggest starting on the 4-hour (H4) or Daily (D1) chart. The signals are less frequent but generally more reliable, and it gives you ample time to analyze the setup without feeling pressure.
Avoiding Common Setup Mistakes
A common pitfall is applying the indicators and not paying attention to their scale. Ensure you can clearly see the ADX 25 level and the MACD zero line. These are your key reference points. Another mistake is tweaking the settings without extensive testing. Changing the ADX to 7, for example, will make it much more sensitive and generate more signals, but many of them will be false. Stick to the standards until you have a deep, experience-based reason to change them.
The 5-Step Blueprint for the MACD and ADX Strategy
This is the core of the system. We will now lay out the precise, mechanical rules for entry. The beauty of this adx and macd trading strategy is that it’s not subjective. The conditions are either met, or they are not. This removes emotion and guesswork from your trading.
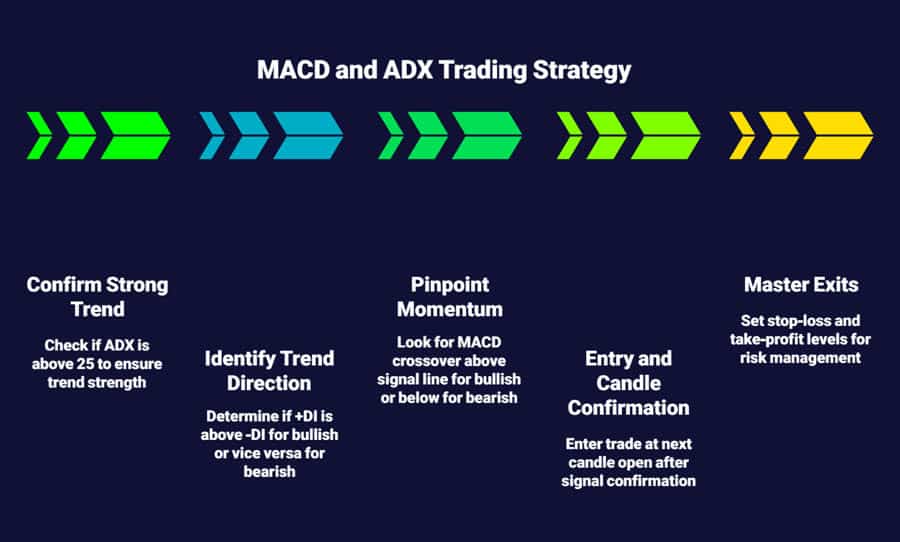
Step 1: Confirm a Strong Trend (ADX > 25)
This is always your first checkpoint. Before you even look at the MACD, glance at the ADX. Is it above 25? If the answer is no, close the chart and look for another opportunity. There is no trade. If it’s above 25 and, even better, rising, you have a green light to proceed to the next step. This single rule will save you from countless frustrating losses in choppy markets.
Step 2: Identify the Trend Direction (+DI vs. -DI)
Once you’ve confirmed the trend has strength, you need to know its direction. This is simple:
- For a Bullish (Buy) Setup: The +DI line must be above the -DI line.
- For a Bearish (Sell) Setup: The -DI line must be above the +DI line.
The crossover of the DI lines is often the first sign that a directional shift is happening, but we don’t act on it alone. We wait for confirmation.
Step 3: Pinpoint Momentum with the MACD Crossover
With trend strength and direction confirmed, we now turn to the MACD for our entry trigger. This is the final piece of the puzzle.
- For a Bullish (Buy) Setup: The MACD line must cross above the signal line. For a higher-probability signal, I personally look for this crossover to happen when the MACD is already above its zero line, or the crossover itself is what pushes it above zero.
- For a Bearish (Sell) Setup: The MACD line must cross below the signal line. Similarly, the strongest signals occur when this happens below the MACD zero line.
Step 4: The Entry and The Candle Confirmation
A signal is not valid until the candle that generates it has officially closed. The entry point for the macd and adx strategy is at the open of the next candle after all three conditions have been met. Look at the entry candle itself—a strong, decisive candle (e.g., a large bullish marubozu for a long trade) adds further conviction to the setup.
Step 5: Master Your Exits with Smart Risk Management
Entering a trade is only half the battle. How you manage it determines your profitability. This is where many traders fail.
- Setting the Stop-Loss: This is your invalidation point. For a long trade, place it logically below the most recent swing low. For a short trade, place it above the most recent swing high. Don’t use an arbitrary pip value; use the market’s own structure.
- Setting the Take-Profit: A fixed risk-to-reward ratio of 1:2 is an excellent starting point. If you risk 50 pips, your target is 100 pips. A more advanced method I often use is a multi-stage exit. I might close half my position at a 1:1 ratio to lock in some profit and move my stop-loss to breakeven. Then, I let the second half of the position run, trailing my stop-loss behind the trend until the ADX drops back below 25 or an opposing MACD crossover occurs. This lets you capture those massive, unexpected trend moves.
Read More: ADX Indicator in Forex
Common Pitfalls and How to Avoid Them

I’ve taught the macd and adx strategy to many traders, and I’ve seen the same mistakes made over and over. Avoiding these common traps is just as important as following the entry rules.
Pitfall 1: Ignoring Major Market Structure
A perfect signal can still fail if it occurs right into a major, long-term support or resistance level. Always zoom out. If you get a beautiful buy signal on the H4 chart, but the price is just below a major weekly resistance level, the trade has a very low probability of success. Context is everything. Always overlay your analysis with key horizontal support and resistance zones.
Pitfall 2: Chasing Signals in “The Chop Zone”
This is the cardinal sin. The ADX is hovering at 18, the market is moving sideways, but you see a MACD crossover and think, “Maybe this is the one.” It’s not. Trading in a low-ADX environment is a recipe for being slowly bled by commissions and small losses. I learned this the hard way early in my career. Have the discipline to simply do nothing when the ADX tells you to.
Pitfall 3: Misinterpreting a Falling ADX
If you are in a profitable long trade and the ADX starts to fall from a high level (e.g., from 50 down to 40), this does not mean you should immediately close the trade and look to go short. It simply means the trend is losing some of its intensity. It’s maturing. It’s a signal to be more defensive—perhaps tighten your trailing stop-loss—but it’s not a reversal signal on its own. The reversal signal comes from the MACD or a break of market structure.
Enhance Your Strategy with a Top-Tier Broker
Executing the macd adx combination strategy flawlessly requires a broker that provides the right tools and a secure environment. A premium, ASIC-regulated broker like Opofinance is built to support serious traders.
- Advanced Trading Platforms: Whether you prefer the universal power of MT4 and MT5, the depth of cTrader, or the simplicity of the proprietary OpoTrade app, you have access to elite platforms.
- Innovative AI Tools: Leverage technology to your advantage. The AI Market Analyzer, AI Coach, and AI Support systems are designed to give you a data-driven edge in the market.
- Social & Prop Trading: Learn from the community with Social Trading or prove your skills and trade firm capital through their Prop Trading program.
- Secure & Flexible Transactions: Enjoy peace of mind with safe and convenient deposit and withdrawal methods, including modern solutions like crypto payments, all with zero fees charged by Opofinance.
To leverage these powerful features and take your trading to the next level, explore what Opofinance has to offer.
Conclusion: Discipline and Probability
The MACD and ADX strategy is a robust and logical system for trend trading. Its true power lies not in predicting the future, but in putting the probabilities firmly in your favor. It achieves this by forcing you to trade only when momentum and trend strength are aligned, a core tenet of professional trading. Mastering this method requires practice and, above all, discipline. You must have the patience to wait for the A+ setups and the fortitude to ignore everything else. Backtest the rules, understand the “why” behind them, and apply them consistently. This is how you move from being a reactive gambler to a proactive, process-driven trader.
How does volatility affect the MACD and ADX strategy?
High volatility can be a double-edged sword. It can lead to faster-rising ADX values and stronger trends, which is ideal. However, it can also cause wider price swings, requiring larger stop-losses to avoid being stopped out prematurely. It’s crucial to adjust your position size accordingly to maintain consistent risk management.
Can I use this strategy during major news releases?
It’s generally advisable for most traders, especially those less experienced, to stay out of the market immediately before and after major, market-moving news releases (like NFP or central bank announcements). The extreme, unpredictable volatility can invalidate technical signals. It’s better to wait for the dust to settle and for a clear technical trend to re-establish itself.
What if the MACD and ADX give signals on different candles?
For the purest application of the strategy, all conditions should align on the same closing candle. If a MACD crossover happens one candle, and the ADX only crosses 25 on the next candle, the signal is less reliable. It indicates a lack of decisive conviction. The best trades explode out of the gate with all signals firing at once.
Is one indicator more important than the other in this strategy?
They are equally important because they perform different, essential jobs. Think of the ADX as the gatekeeper—if it doesn’t give you permission (ADX > 25), nothing else matters. The MACD is the trigger—it tells you the precise moment to act once the gatekeeper has let you through. They are partners, and the strategy fails if one is ignored.
How long should I backtest the strategy before trading it live?
There’s no magic number, but a sample size of at least 100 trades is statistically significant. This will give you a reliable feel for the strategy’s win rate, average risk-to-reward, and drawdown characteristics. More importantly, it will build the mental discipline and confidence needed to execute the strategy flawlessly with real money on the line.


