

The core difference between Market Profile vs Volume Profile is what they measure: Market Profile charts how much time the price spends at each level, while Volume Profile charts how much volume was traded at each level. Understanding this distinction is crucial for traders looking to gain a market edge. Whether you use an online forex broker or trade futures, knowing which tool to apply can fundamentally change how you interpret market structure. This article will dissect the Market Profile vs Volume Profile difference, explain their core components, and show you how to build a powerful trading strategy around them.
Key Takeaways:
- Primary Focus: Market Profile is based on Time (Time Price Opportunity or TPO), showing where the market spent the most time. Volume Profile is based on actual traded volume, showing where the most shares or contracts were exchanged.
- Chart Visualization: Market Profile uses letters or blocks (TPOs) to build a distribution curve. Volume Profile uses a horizontal histogram to display volume at specific price levels.
- Core Components: Both tools identify a Point of Control (POC) and a Value Area (VA), but their calculations differ. MP’s POC is the price level with the most time spent, while VP’s POC is the price with the highest traded volume.
- Strategic Application: Market Profile excels at identifying market balance/imbalance and rotational days. Volume Profile is superior for spotting liquidity, support/resistance, and absorption.
- Combining Tools: The most robust Market Profile vs Volume Profile trading strategy involves using them together to confirm signals. A discrepancy between Time POC and Volume POC can often signal an impending market reversal.
Market Profile Basics: Time Price Opportunity Explained
Before we dive deep into the Market Profile vs Volume Profile debate, it’s essential to understand each tool on its own. Market Profile is not an indicator in the traditional sense; it’s an analytical framework developed by legendary CBOT trader J. Peter Steidman in the 1980s. Its purpose is to show who is in control of the market—buyers or sellers—and to provide a clear picture of the market’s structure and development over a session.
What is Market Profile?
Market Profile organizes trading data in a way that reveals the relationship between price, time, and value. Its unique visualization method helps traders see beyond simple candlestick charts. Instead of focusing on every single tick, it emphasizes the price levels where the market spent the most time, considering these areas to be ‘fair value’ accepted by both buyers and sellers. This concept is revolutionary because it shifts the focus from price movement alone to the market’s organizational structure.
Core Concept: Time Price Opportunity (TPO)
The fundamental building block of Market Profile is the Time Price Opportunity, or TPO. A TPO represents a single time bracket (typically 30 minutes) during the trading session. Each TPO is assigned a letter, starting with ‘A’ for the first time bracket, ‘B’ for the second, and so on. When price trades at a certain level during a specific time bracket, that letter is printed on the chart at that price. The resulting bell-shaped curve shows which prices were visited most frequently. This direct look into Time Price Opportunity vs Volume Profile reveals the first major divergence: Market Profile is all about time, not volume.
Market Profile Chart Anatomy
A Market Profile chart can look intimidating at first, but it breaks down into a few key components that tell a compelling story about the trading day.
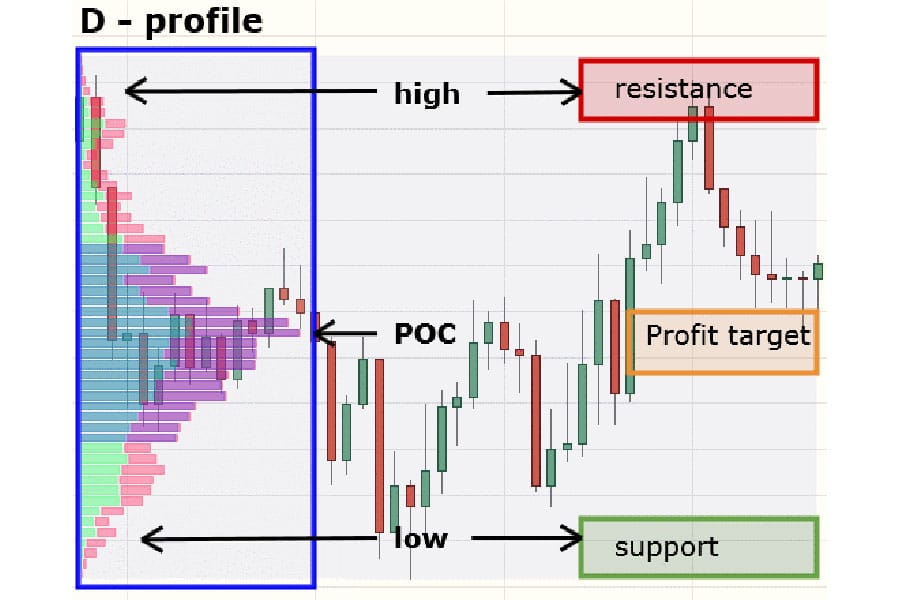
- TPO Blocks: These are the letters (A, B, C…) that form the profile. The longest row of TPOs indicates the Point of Control.
- Point of Control (POC): This is the price level with the highest number of TPOs, meaning the market spent the most time there. It acts as a major magnet for price and a key reference point for the session.
- Value Area (VA): This is the price range where approximately 70% of the session’s trading activity occurred (based on TPOs). Prices inside the Value Area are considered ‘fair,’ while prices outside are ‘unfair.’ The top of the VA is the Value Area High (VAH) and the bottom is the Value Area Low (VAL).
- Initial Balance (IB): This is the price range established during the first two TPO periods (typically the first hour of the regular session). The IB provides a critical early look at the day’s potential strength or weakness. A wide IB suggests strong conviction, while a narrow IB suggests uncertainty.
Key Advantages of Market Profile
From my experience, the primary advantage of Market Profile is its ability to contextualize the market’s narrative. It helps you understand why the market is moving, not just that it is moving. It’s exceptional at identifying different “day types” (e.g., Normal Day, Trend Day, Neutral Day), which can frame your strategy for the rest of the session. By seeing where time-based value is being established, you can more effectively anticipate areas of support and resistance and avoid getting trapped in choppy, low-conviction zones.
Read More: The volume indicator in Forex tr
Volume Profile Explained: Volume by Price
Now let’s turn to the other side of the Market Profile vs Volume Profile comparison. While Market Profile tracks time, Volume Profile tracks the real engine of the market: volume. It visualizes the total traded volume at each specific price level over a chosen period. This provides an incredibly clear view of where the actual business was done, highlighting zones of high and low liquidity that are often invisible on a standard chart.
How It Visualizes Volume Distribution
Volume Profile is displayed as a horizontal histogram on the vertical axis of a chart. Longer bars indicate that more volume was traded at that price level, signifying high interest and strong acceptance. Shorter bars indicate less volume was traded, signifying rejection or a lack of interest. This visualization immediately draws your eye to the most significant price levels, which often act as powerful magnets or barriers for future price action. A seasoned forex trading broker would confirm that understanding these liquidity zones is paramount.
Volume Profile Chart Anatomy
The components of a Volume Profile are similar in name to Market Profile, but their calculation and interpretation are rooted in volume, leading to crucial differences in the Market Profile vs Volume Profile difference.
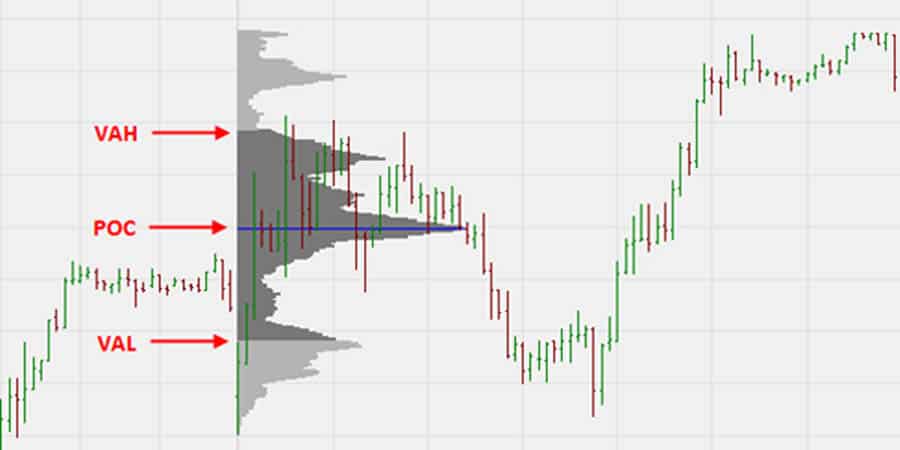
- High Volume Nodes (HVNs): These are the long bars on the histogram, representing price levels with high traded volume. HVNs indicate areas of market agreement and consolidation. Price tends to get ‘stuck’ in these zones as it moves through them.
- Low Volume Nodes (LVNs): These are the short bars, representing price levels with low traded volume. LVNs are areas of rejection or swift price movement. The market moved through these levels quickly because there was little interest in transacting there. They often act as vacuums, pulling price through them.
- Point of Control (VPOC): This is the single price level with the highest traded volume in the selected period—the longest bar on the histogram. The VPOC is the most significant level of the session, representing the ‘fairest’ price to do business. It’s a critical level for support and resistance.
- Value Area (VA): Similar to Market Profile, this is the range where approximately 70% of the session’s volume was traded. The Value Area High (VAH) and Value Area Low (VAL) derived from volume are extremely powerful support and resistance levels because they are based on actual executed transactions.
Key Advantages of Volume Profile
The unmatched advantage of Volume Profile is its direct link to liquidity. It shows you exactly where the “big money” is active. From a practical standpoint, this helps in identifying high-probability support and resistance zones with much greater accuracy than traditional methods. It’s also incredibly effective for risk management; placing a stop-loss on the other side of a High Volume Node, for example, gives your trade a structural buffer against random noise.
Key Differences: Market Profile vs Volume Profile
Understanding the foundational concepts is the first step. Now, let’s directly address the central question: what is the Market Profile vs Volume Profile difference? While they both aim to find value and key reference points, their methods and the data they prioritize are fundamentally different, leading to distinct interpretations and trading signals. A successful trading strategy often hinges on appreciating these nuances.
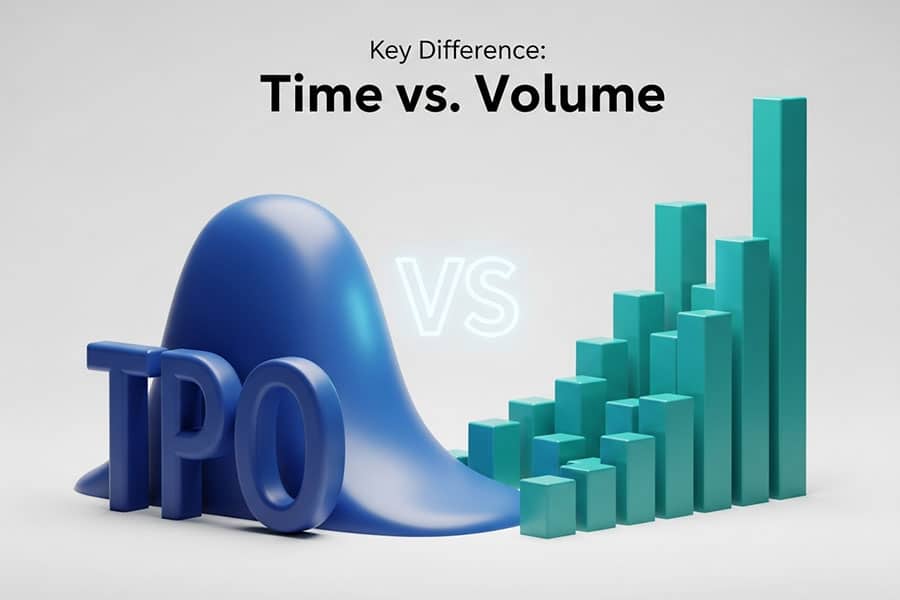
Analytical Focus: Time vs. Volume
This is the most critical distinction. Market Profile is built on the foundation of Time Price Opportunity (TPO). Its entire structure, from the POC to the Value Area, is derived from how long the price stayed at a level. Volume Profile, conversely, is built on actual traded volume. It doesn’t care how long the price was at a level; it only cares how many contracts or shares were traded there. This Time Price Opportunity vs Volume Profile distinction means MP shows where the market perceived value, while VP shows where it committed capital.
Chart Construction and Visualization
The visual output of each tool is another clear differentiator. Market Profile uses letters or blocks arranged in a bell-shaped distribution. Each letter represents a unit of time. Volume Profile uses a horizontal histogram where the length of each bar is proportional to the volume traded. This makes VP arguably more intuitive for quickly spotting high-interest areas (the longest bars), whereas MP requires a bit more interpretation to understand the day’s development through the sequence of letters.
Data Used and Calculation Differences
The difference in underlying data leads to different calculations for key levels.
- POC Calculation: MP’s POC is the price with the most TPOs (longest row of letters). VP’s POC is the price with the most volume. These two levels can, and often do, occur at different prices. When they diverge, it provides a powerful clue about market dynamics.
- Value Area Calculation: The 70% Value Area is also calculated differently. In MP, it’s 70% of the TPO count. In VP, it’s 70% of the total volume. This can result in VAs of different sizes and at different locations on the chart, highlighting the core Market Profile vs Volume Profile difference.
Trading Session Relevance
Historically, Market Profile was designed for pit trading during Regular Trading Hours (RTH). Its TPO structure is best suited for defined open/close sessions. Volume Profile, however, is more versatile. Because it’s based on volume, it can be applied seamlessly to 24-hour markets like forex and crypto, where defining a session ‘open’ can be arbitrary. You can build a Volume Profile for any period—a day, a week, a month, or even a specific range—making it more adaptable for the modern, continuous market environment.
Read More: Volume Spread Analysis
When To Use Each Profile
The choice between using Market Profile or Volume Profile often comes down to the market environment and your personal trading style. There’s no single “better” tool; the power lies in knowing when to deploy each one. The ongoing debate over Market Profile vs Volume Profile is less about a winner and more about context.
Strengths for Different Trading Styles
- Scalping: Volume Profile is often preferred by scalpers. The precise levels of HVNs and LVNs provide clear, actionable entry and exit points for very short-term trades. A scalper might fade the edge of an HVN or trade the breakout of a VPOC.
- Day Trading: Day traders can benefit immensely from both. A common Market Profile vs Volume Profile trading strategy for day traders is to use the Market Profile to understand the ‘story’ of the day (e.g., are we in a trend day or a balance day?) and then use Volume Profile to pinpoint exact entry and exit levels with high liquidity.
- Swing Trading: Swing traders tend to favor Volume Profile built over longer periods (weekly or monthly). These “composite” profiles highlight major long-term support and resistance zones. A swing trader might look for price to pull back to a large weekly VPOC before entering a long position.
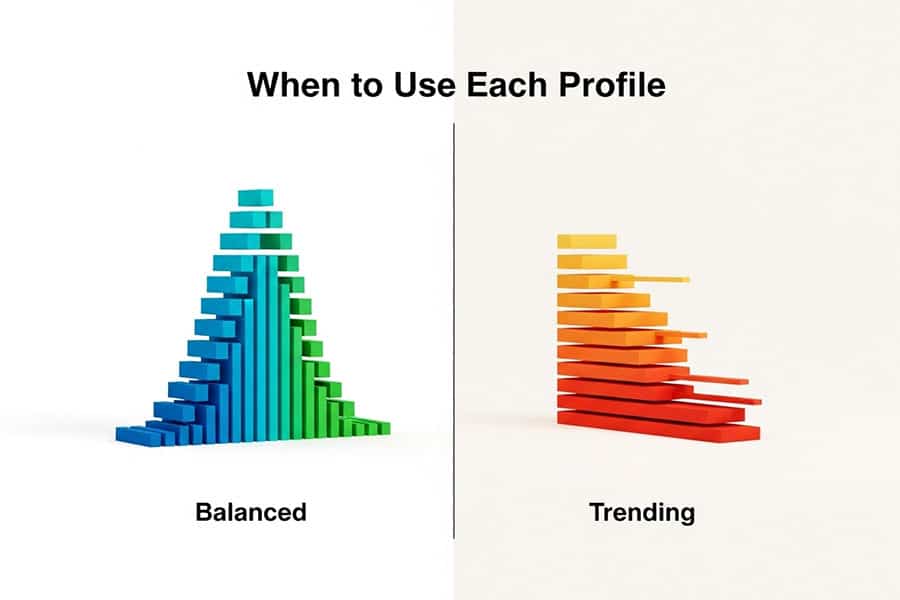
Market Profile in Balanced vs. Trending Markets
Market Profile truly shines in identifying balanced (or rotational) markets. When the profile is symmetrical and bell-shaped, it signals that buyers and sellers are in equilibrium. In these conditions, a good strategy is to fade the extremes of the Value Area, selling at the VAH and buying at the VAL. Conversely, in a trending market, the profile will be elongated and thin, showing clear directional conviction. MP helps you identify a trend day early, so you can switch to a breakout or pullback strategy instead of fighting the momentum.
Volume Profile in Liquidity-Driven Markets
Volume Profile is king in markets driven by liquidity, which includes most modern markets like futures, forex, and crypto. It excels at showing you where institutions are placing their bets. When you see price approach a massive HVN, you know a battle is about to take place. If price is accepted into the HVN, it will likely move towards the VPOC. If it’s rejected, a sharp reversal is probable. This makes VP an indispensable tool for navigating today’s algorithm-heavy markets.
Practical Use Cases & Pro Trader Tips
Theory is one thing, but a successful Market Profile vs Volume Profile trading strategy comes from practical application. From my experience trading and speaking with other professional traders, the real edge comes from combining these tools and knowing how to interpret their signals in real-time. Here are some actionable tips to move from theory to practice.
Interpreting Profiles for Trades
A simple step-by-step process can help you get started:
- Identify the Macro Structure: Start with a longer-term Volume Profile (weekly or monthly) to identify the major HVNs and LVNs. These are your key “arenas” of interest.
- Analyze the Current Session: Use a session-based Market Profile and Volume Profile to see how the current day’s action fits into the larger structure. Is today’s Value Area forming above, below, or inside yesterday’s?
- Spot Key Levels: Mark the POC and VA (both time and volume) for the current and prior day. These are your primary reference points for entries and targets.
- Look for Confluence: The strongest trade setups occur where multiple signals align. For example, a prior day’s VPOC lining up with the current day’s Value Area Low is a very high-probability support zone.
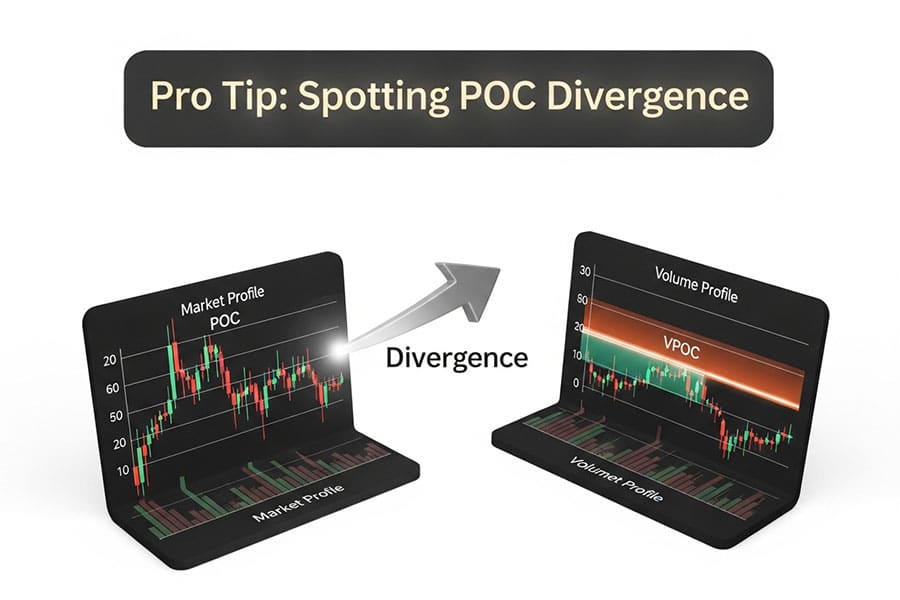
How Pros Combine Both Tools
The real magic happens when you compare the signals from both profiles. A classic pro-level technique is to watch for divergences between the Time POC (from MP) and the Volume POC (from VP).
- Confirmation: If the Time POC and Volume POC are at the same price, it signals strong, healthy acceptance of that level. It’s a true point of control.
- Divergence as a Warning: If the Time POC is significantly higher than the Volume POC, it can be a bearish signal. It means the market spent a lot of time at higher prices but the heavy volume came in lower. This suggests that the “smart money” was selling to the “late money” at the top. The reverse is true for a bullish signal (Time POC below Volume POC). This is a nuanced but powerful insight into the Market Profile vs Volume Profile dynamic.
Risk Management with Profiles
Profiles are not just for finding entries; they are exceptional for risk management. High Volume Nodes and Value Area boundaries provide logical places for stop-losses. Placing your stop on the other side of a significant HVN means the market would have to chew through a huge amount of liquidity to stop you out, increasing the odds that your trade thesis is truly wrong. Similarly, LVNs can be used as profit targets, as price tends to accelerate through these low-volume zones.
Best Platforms for Profile Analysis
Applying these concepts requires the right tools. While many platforms offer basic volume-by-price, serious profile traders often gravitate towards more specialized software.
- TradingView: Excellent for its user-friendly interface and powerful built-in Volume Profile tools (Session Volume Profile, Visible Range). While it lacks a native TPO chart, there are many community-built scripts that replicate Market Profile functionality effectively.
- NinjaTrader: A favorite among futures traders, NinjaTrader offers robust, native Market Profile (TPO) and Volume Profile indicators, often through third-party add-ons like those from vendors like OrderFlowLabs or Gomi.
- Sierra Chart / Jigsaw Daytradr: These are considered the gold standard by many professional traders. They offer highly customizable, tick-by-tick data rendering for extremely precise Profile and Order Flow analysis.
Read More: 7 Steps to a Winning Volume Profile Strategy
Advanced Strategies and Modern Enhancements
Once you’ve mastered the basics of Market Profile vs Volume Profile, you can begin to integrate more advanced concepts to refine your edge. The markets in 2025 are faster and more complex than ever, and modern tools allow for a deeper level of analysis that was once unavailable to retail traders.
Profiles in Crypto, Forex & Futures
While profiles originated in the futures market, their application is universal.
- Crypto: Volume Profile is particularly powerful in cryptocurrency markets, which are open 24/7 and highly liquidity-driven. Identifying the VPOC on a Bitcoin chart can give you the single most important level for the day or week.
- Forex: For forex traders, using a regulated forex broker with access to good volume data (like futures volume for major pairs) is key. Volume Profile can help identify where central banks or large institutions may be defending a price level.
- Futures: This remains the home turf for profile trading. The combination of central limit order book data and precise volume makes futures (like the E-mini S&P 500) the perfect canvas for applying a deep Market Profile vs Volume Profile trading strategy.
Combining Order Flow, Delta, and Footprint Charts
For the ultimate level of detail, many pros add order flow analysis to their profiles.
- Footprint Charts: These are like a magnifying glass for the Volume Profile. They show the actual volume of buy and sell orders executed at each specific price, inside each candlestick.
- Delta: This is the difference between aggressive buyers and aggressive sellers at a price (Market Buys – Market Sells). Seeing positive delta at a key support level identified by Volume Profile is a strong confirmation signal to go long.
Combining profiles with order flow allows you to see not just where value is, but how the battle between buyers and sellers is playing out in real-time. It’s the final layer in understanding the complete Market Profile vs Volume Profile picture.
Automation and Hybrid Approaches (2025)
Looking ahead, the trend is towards hybrid analysis and automation. New indicators and algorithms are emerging that can automatically detect classic profile patterns, such as “P-shaped” or “b-shaped” profiles, and alert traders to potential setups. Platforms are also making it easier to build automated strategies around profile levels, like automatically scaling out of a position as price approaches a major HVN. This blend of discretionary analysis and automated execution is the future of profile trading.
Unlock Your Trading Potential with Opofinance
Ready to apply these advanced charting techniques? As an ASIC-regulated broker, Opofinance provides the tools and security you need to trade with confidence. Elevate your Market Profile vs Volume Profile analysis with our cutting-edge platforms and support.
- Advanced Trading Platforms: Choose from MT4, MT5, cTrader, and the exclusive OpoTrade platform.
- Innovative AI Tools: Gain an edge with our AI Market Analyzer, AI Coach, and 24/7 AI Support.
- Flexible Trading Options: Explore Social Trading and Prop Trading opportunities to diversify your approach.
- Secure & Convenient Transactions: Enjoy seamless deposits and withdrawals, including crypto payments with zero fees.
Start Trading with Opofinance Today
Conclusion: Market Profile, Volume Profile, or Both?
In the end, the Market Profile vs Volume Profile debate doesn’t have a single winner. The best approach is not to choose one over the other, but to understand their unique strengths and use them together. Market Profile tells you the market’s story and structure through the lens of time, while Volume Profile provides a precise, undeniable map of liquidity. By combining the narrative of time with the hard data of volume, you create a comprehensive analytical framework that gives you a significant edge over those using simpler methods.
Which profile is better for beginners?
Volume Profile is often considered more beginner-friendly. Its visual histogram is intuitive—longer bars mean more activity. This makes it easier to quickly identify key support and resistance levels without the steeper learning curve of interpreting TPO letter sequences in Market Profile.
Can a Value Area shift significantly during a session?
Yes, absolutely. A shifting Value Area is a key piece of information. If the VA is migrating higher throughout the day, it’s a strong sign of bullish control. If it’s migrating lower, it indicates bearish control. This is a core concept in gauging real-time market sentiment.
Is one profile better for spotting market exhaustion?
Both can signal exhaustion, but in different ways. Market Profile signals it with a long, thin “tail” at the top or bottom of the profile, showing price was quickly rejected. Volume Profile signals it with tapering volume on new highs or lows, indicating a lack of participation in the new price territory.
How do I handle conflicting signals from the two profiles?
Conflicting signals are often valuable information. For example, if Market Profile shows a new high but Volume Profile shows very low volume on that move, it’s a red flag that the breakout may be fake. The volume (or lack thereof) provides the crucial context to the time-based price move.
Are these profiles predictive or reactive?
They are primarily reactive tools that organize past data. However, by revealing where value and liquidity have been established, they provide a powerful framework for predicting where future support, resistance, and price action are likely to occur. They map the battlefield for future trades.


