The momentum indicator is an essential tool in forex trading that allows traders to measure the speed and strength of price movements, helping them to make better-informed decisions about when to enter and exit trades. Whether you’re a beginner or an advanced trader, using momentum indicators effectively can significantly enhance your trading strategy. By understanding how to adjust the settings and interpret the signals, you can optimize your trades and increase your chances of success in the fast-paced world of forex.
In this guide, we’ll explore how to use the momentum indicator in forex, covering key settings, popular indicators like the RSI, MACD, and CCI, and practical trading strategies. Whether you trade with a regulated forex broker or through an online forex broker, mastering momentum indicators can give you an edge in your forex trading journey.
Introduction to Momentum Indicators in Forex Trading
Momentum indicators are a crucial part of technical analysis used in forex trading. Their main function is to measure the rate of change in a currency pair’s price over a specific period, giving traders insight into the strength of the price movement. This information is invaluable for making well-timed entry and exit decisions. Whether you’re working with a forex trading broker or a broker for forex trading, understanding the speed at which prices move helps you anticipate market behavior more effectively.
The primary benefit of using momentum indicators is that they provide an objective way to measure the market’s enthusiasm for a particular currency pair. A sharp increase in price momentum might suggest a strong uptrend, while a decrease could indicate that the trend is losing strength, signaling a potential reversal.
To succeed in forex trading, it’s important to not only follow price movements but also understand the strength behind those movements. Momentum indicators help you do just that by measuring how quickly the price of a currency is changing.
How Momentum Indicators Work
Momentum indicators compare current prices to prices from previous periods, allowing traders to determine if a currency pair is gaining or losing momentum. The basic principle behind momentum indicators is that strong trends tend to accelerate before reaching their peak, while weakening trends decelerate before reversing.
Key Elements of Momentum Indicators:
- Period Length: The most common setting for momentum indicators is the length of the period used in the calculation. For example, a 14-period setting for the RSI compares the current price with prices from the last 14 periods. Adjusting the period length can make the indicator more sensitive (shorter periods) or less sensitive (longer periods) to price movements.
- Momentum Calculation: While the specific formula differs between indicators, most momentum indicators are based on the concept of comparing the current price to a previous price over a set number of periods. The result is plotted as an oscillator, which traders can interpret to assess whether a currency pair is trending or reversing.
Key Momentum Indicators Used in Forex Trading
Several momentum indicators are commonly used in forex trading. Each has its strengths and is suited for different types of analysis. Understanding the most widely used indicators will allow you to apply them to your trading strategies more effectively.

1. Relative Strength Index (RSI)
The Relative Strength Index (RSI) is a widely-used momentum indicator in forex trading that measures the speed and change of price movements. The RSI is often used to identify overbought or oversold conditions in a currency pair.
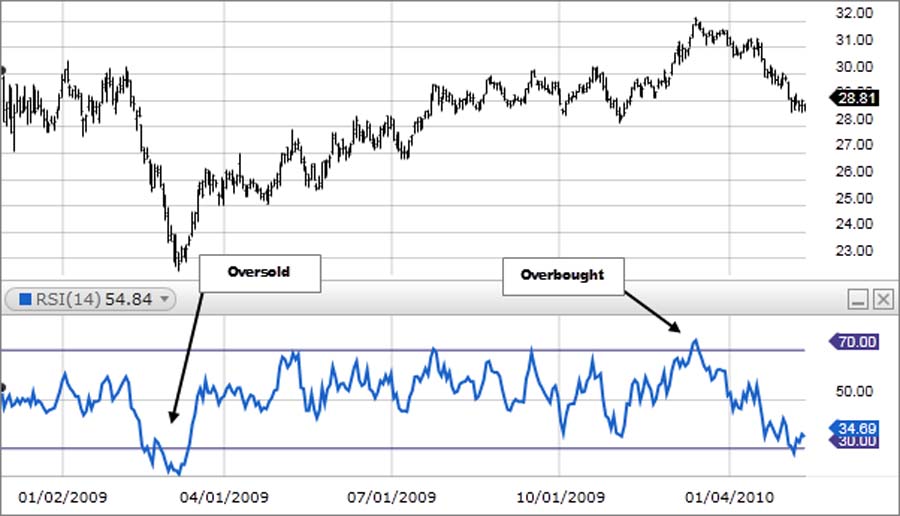
- RSI Calculation: The RSI is calculated using the following formula:
RSI = 100 – [100 / (1 + RS)], where RS is the average gain of up periods divided by the average loss of down periods over a certain time frame (typically 14 periods). - Settings and Adjustments: While the default period is 14, traders can adjust the period to make the indicator more or less responsive to price changes. Shorter periods make the RSI more volatile, while longer periods smooth out the indicator’s movements.
- Interpretation:
- An RSI value above 70 suggests that the market is overbought, signaling a potential reversal or pullback.
- A value below 30 indicates that the market may be oversold, signaling a potential buying opportunity.
Pro Tip: The RSI is particularly effective when used in combination with other indicators or price action analysis. Advanced traders often use RSI divergence (when the price moves in one direction and the RSI moves in another) to anticipate market reversals.
2. Moving Average Convergence Divergence (MACD)
The Moving Average Convergence Divergence (MACD) is another popular momentum indicator that helps traders spot changes in the strength, direction, momentum, and duration of a trend.
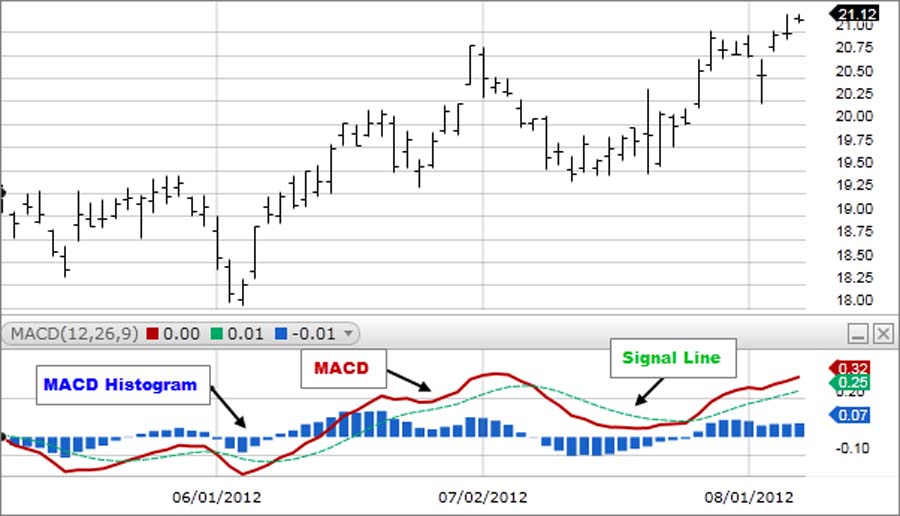
- How MACD Works: The MACD calculates the difference between two moving averages of a currency’s price—typically the 12-period and 26-period Exponential Moving Averages (EMAs). It also includes a signal line, which is a 9-period EMA of the MACD. Traders watch for crossovers between the MACD line and the signal line to identify potential buy or sell signals.
- Settings: The default settings are usually 12, 26, and 9 periods. However, more advanced traders can adjust these settings to better match their trading style.
- Interpreting the MACD:
- When the MACD crosses above the signal line, it generates a bullish signal, suggesting that it might be a good time to buy.
- When the MACD crosses below the signal line, it gives a bearish signal, suggesting that the trader might want to sell or exit a position.
Pro Tip: Many traders combine the MACD with other indicators, such as RSI or trend lines, to confirm signals before making a trade. Using multiple indicators can reduce the likelihood of false signals.
3. Stochastic Oscillator
The Stochastic Oscillator is a momentum indicator that compares the closing price of a currency pair to its price range over a specified period. It’s particularly useful in identifying overbought and oversold conditions in a ranging market.
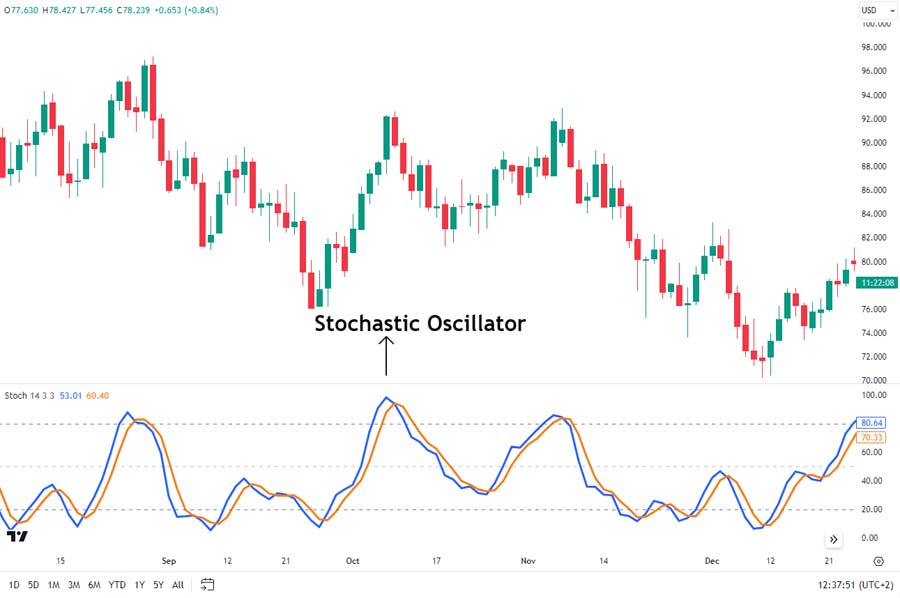
- How It Works: The Stochastic Oscillator is calculated using the formula:
%K = (Current Close – Lowest Low) / (Highest High – Lowest Low) * 100
%D = 3-period moving average of %K - Settings: The most common settings for the Stochastic Oscillator are 14, 3, and 3 periods, but traders can adjust these to suit their strategy.
- Interpretation:
- Readings above 80 typically indicate overbought conditions, signaling a potential selling opportunity.
- Readings below 20 suggest oversold conditions, signaling a potential buying opportunity.
The Stochastic Oscillator is particularly effective in sideways or ranging markets, where it helps traders identify reversal points at the top and bottom of a trading range.
4. Commodity Channel Index (CCI)
The Commodity Channel Index (CCI) is another momentum-based indicator that measures how far the current price is from its average over a specified period. Although originally developed for commodities, the CCI has become widely used in forex trading.
- How It Works: The CCI measures the deviation of the current price from the average price over a certain period. A high positive reading indicates that the price is well above the average and could be overbought, while a low negative reading suggests that the price is well below the average and could be oversold.
- Settings: The CCI is usually calculated using 20 periods, but traders can adjust this based on their preferences.
- Interpretation:
- A reading above +100 indicates overbought conditions, suggesting a potential sell signal.
- A reading below -100 indicates oversold conditions, suggesting a potential buy signal.
The CCI is especially useful for spotting divergences between price action and momentum, helping traders anticipate potential reversals.
Trading Strategies Using Momentum Indicators

Once you’ve chosen the momentum indicators that best suit your trading style, the next step is to develop a strategy around them. Momentum indicators can help traders identify trends, spot reversals, and determine when the market is overbought or oversold. Here are a few common strategies:
1. RSI Overbought/Oversold Strategy
- Entry Signal: Enter a trade when the RSI crosses below 30, indicating oversold conditions. This could signal a potential buying opportunity.
- Exit Signal: Exit the trade when the RSI crosses above 70, indicating overbought conditions. This could signal a potential reversal or pullback.
2. MACD Crossover Strategy
- Entry Signal: Enter a trade when the MACD line crosses above the signal line, indicating a potential bullish trend.
- Exit Signal: Exit the trade when the MACD line crosses below the signal line, indicating a potential bearish trend.
3. Stochastic Oscillator Strategy
- Entry Signal: Enter a trade when the Stochastic Oscillator falls below 20 (oversold) and then rises above it, signaling a potential buying opportunity.
- Exit Signal: Exit the trade when the Stochastic Oscillator rises above 80 (overbought) and then falls below it, signaling a potential selling opportunity.
4. CCI Divergence Strategy
- Entry Signal: Enter a trade when there is a bullish divergence between the CCI and the price action. This happens when prices are making new lows, but the CCI is moving higher.
- Exit Signal: Exit the trade when there is a bearish divergence between the CCI and the price action, indicating a potential reversal.
Pro Tip: While momentum indicators are powerful, they work best when used in conjunction with other technical tools such as trend lines, moving averages, or Fibonacci retracements.
Interpreting Momentum Indicator Signals
Interpreting momentum indicator signals is crucial for turning market observations into profitable trades. Understanding how to interpret highs, lows, crossovers, and divergences can help you maximize your trading opportunities.
Highs and Lows
Momentum indicators will often create peaks and troughs as the price moves. Monitoring these can help you understand whether the current trend is losing strength or gaining momentum.
- Highs: When a momentum indicator reaches a high, it could indicate that the trend is reaching its peak, and a reversal may be imminent.
- Lows: When a momentum indicator reaches a low, it suggests that the trend could be about to reverse upward, signaling a buying opportunity.
Crossovers
Many momentum indicators, like the MACD and Stochastic Oscillator, rely on crossover signals to indicate changes in trend direction. These crossovers occur when the indicator line crosses over a signal line or moves from negative to positive territory.
- Bullish Crossover: When the indicator crosses above the signal line, it suggests upward momentum and could signal a buying opportunity.
- Bearish Crossover: When the indicator crosses below the signal line, it suggests downward momentum and could signal a selling opportunity.
Divergence
Divergence occurs when the price is moving in one direction, but the momentum indicator is moving in the opposite direction. This can be a powerful signal of a potential trend reversal.
- Bullish Divergence: Occurs when the price makes a lower low, but the momentum indicator makes a higher low. This suggests that the downtrend is losing strength, and an upward reversal may occur.
- Bearish Divergence: Occurs when the price makes a higher high, but the momentum indicator makes a lower high. This suggests that the uptrend is losing strength, and a downward reversal may occur.
Pro Tip: Divergence is one of the most reliable signals in forex trading but should always be confirmed with other indicators or analysis tools.
Practical Tips for Using Momentum Indicators in Forex Trading
Here are some practical tips for getting the most out of your momentum indicators in forex trading:
- Use Demo Accounts: Before implementing any new strategy, practice using momentum indicators on a demo account. This allows you to test different settings and strategies without risking real money.
- Adjust Indicator Settings: Most momentum indicators allow for adjustable settings, such as period length. Tailor these settings to suit your trading style and the current market conditions.
- Combine with Other Indicators: Momentum indicators are best used in combination with other technical tools. For example, combining the RSI with moving averages or support and resistance levels can provide more reliable signals.
- Consider Market Conditions: The effectiveness of momentum indicators can vary depending on market conditions. In trending markets, momentum indicators work well, but they may provide false signals in range-bound markets.
Patience and careful analysis are key when using momentum indicators. Don’t rush into trades based solely on one indicator.
Common Mistakes to Avoid When Using Momentum Indicators
While momentum indicators are invaluable tools, traders often make common mistakes that can reduce their effectiveness. Here are a few to watch out for:
- Over-Reliance on a Single Indicator: One of the biggest mistakes traders make is relying too heavily on a single momentum indicator without confirming signals from other sources. Momentum indicators are powerful, but they are not infallible.
- Ignoring Market Volatility: Momentum indicators may produce false signals during periods of high volatility. Always consider the broader market context when interpreting indicator signals.
- Using Default Settings Blindly: Many traders use the default settings for their momentum indicators without considering adjustments for their specific trading strategy. Take the time to experiment with different period lengths and settings to find what works best for you.
Remember, no single indicator or strategy guarantees success in forex trading. Always use a combination of tools and stay informed about market conditions.
Opofinance Services: A Trusted ASIC-Regulated Broker
When trading with momentum indicators in forex, it’s important to choose a trusted broker. Opofinance is a reliable and ASIC-regulated forex broker that offers an advanced trading platform and a range of services to help traders succeed. They are officially featured on the MT5 brokers list, which means they support MetaTrader 5, a platform known for its advanced charting and analysis tools, including momentum indicators.

Additionally, Opofinance offers a social trading service, where traders can follow and replicate the trades of experienced forex traders. This feature is especially helpful for beginners looking to learn from more experienced traders while honing their skills.
Opofinance also provides safe and convenient deposit and withdrawal methods, ensuring that your funds are secure and easily accessible. If you’re looking for a regulated and reliable broker to enhance your forex trading experience, Opofinance is an excellent choice.
Conclusion
Momentum indicators are essential tools in forex trading, providing traders with valuable insights into the strength and direction of price movements. Whether you prefer to use the RSI, MACD, Stochastic Oscillator, or CCI, these indicators can help you identify key entry and exit points, confirm trends, and anticipate potential reversals.
By adjusting your momentum indicator settings and combining them with other technical analysis tools, you can develop a more robust and effective trading strategy. Remember to practice with demo accounts and avoid common mistakes like over-relying on a single indicator.
Key Takeaways
- Momentum indicators measure the speed and strength of price movements.
- Key indicators include RSI, MACD, Stochastic Oscillator, and CCI.
- Adjust settings to match your trading style and market conditions.
- Use momentum indicators in conjunction with other technical tools for more reliable signals.
- Avoid common mistakes such as over-reliance on a single indicator or ignoring market context.
Can momentum indicators be used for short-term and long-term trading?
Yes, momentum indicators can be used for both short-term and long-term trading. For short-term trades, you can use lower period settings to get more sensitive signals, while for long-term trades, higher period settings can help smooth out the price movements and avoid false signals.
How do I know when to adjust my momentum indicator settings?
You should adjust your settings based on market conditions and your trading style. In highly volatile markets, you might want to shorten the period length to capture quick price movements, while in trending markets, a longer period might help you stay in the trade longer.
What is the difference between leading and lagging momentum indicators?
Leading indicators, like the Stochastic Oscillator, give signals before a new trend or reversal happens. Lagging indicators, such as the MACD, confirm the strength of a trend after it has already begun. Both types of indicators can be useful depending on your strategy.


