Imagine spotting a market turning point before it takes off, giving you a prime opportunity to ride the trend early. This is precisely what the Morning Star candlestick pattern offers—a powerful signal of bullish reversal that can transform your trading strategy.

Whether you’re a seasoned trader or just starting, understanding the Morning Star pattern can give you an edge in identifying price shifts with precision. This article dives deep into the Morning Star candlestick pattern meaning, its anatomy, and how to trade it effectively, including real-world examples and actionable strategies.
And here’s the best part: By combining this pattern with the right technical tools and insights, you can reduce your risks and increase the probability of success. In this guide, we’ll also touch on how a regulated forex broker, like Opofinance, can elevate your trading experience with advanced tools and secure services.
Keep reading to uncover the secrets of mastering this pattern and take your trading skills to the next level!
What is the Morning Star Candlestick Pattern?

Explore the significance of the Morning Star candlestick pattern in identifying market reversals.
Overview of the Morning Star Candlestick Pattern Meaning
The Morning Star candlestick pattern is a widely recognized three-candle reversal pattern that signals the potential for a shift from a bearish trend to a bullish one. This pattern is often observed after a sustained downtrend and represents the exhaustion of selling pressure followed by a resurgence of buying interest. For traders and technical analysts, spotting this pattern can indicate an opportune moment to enter a long position or consider reducing short positions, especially as it suggests that bearish momentum may be reaching its end.
This pattern’s significance lies in its simplicity and reliability, making it a fundamental part of Japanese candlestick charting and highly valued in forex, stock, and commodities trading. The Morning Star candlestick pattern serves as a visual cue for potential reversals, signaling that the market sentiment could be shifting. Its formation consists of three distinct candles, each telling a unique story of market sentiment and momentum.
Read More: Evening Star Candlestick Pattern
Structure of the Morning Star Pattern

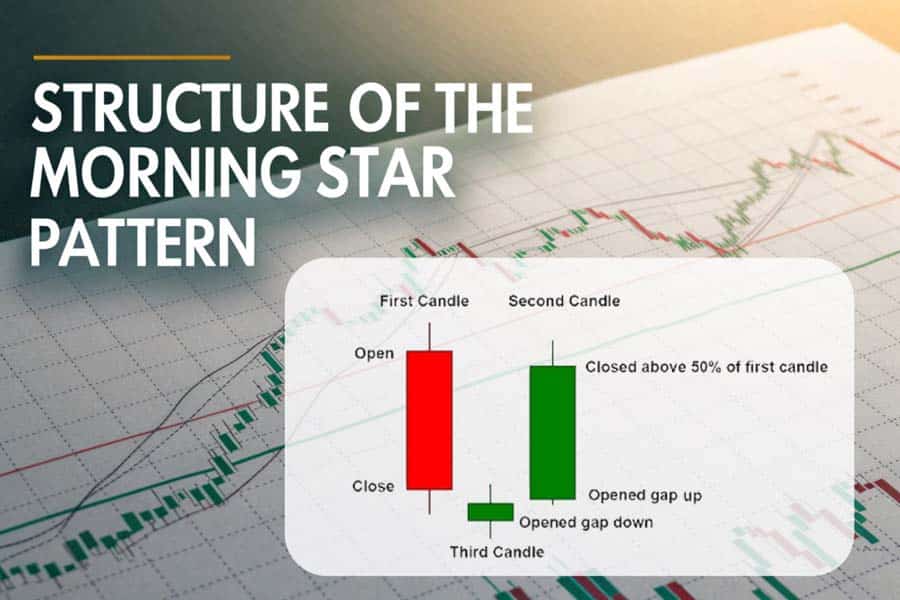
The Morning Star pattern is composed of three consecutive candles that reveal a gradual shift in the balance between buyers and sellers. Each of these candles plays a crucial role in the interpretation of the pattern:
- First Candle (Large Bearish Candle): This initial bearish candle confirms the ongoing downtrend, often closing near its low, which reflects strong selling pressure. This candle sets the stage for the potential reversal by indicating that sellers are in control of the market.
- Second Candle (Indecision or Small Body): The second candle is typically a small-bodied candle, often a Doji, spinning top, or a similar formation that represents indecision. This candle’s position and structure are essential as it reflects a pause in the selling momentum and hints at a balance of forces between buyers and sellers. The market is in a state of indecision, which often serves as a prelude to a reversal.
- Third Candle (Strong Bullish Candle): The third candle is the most critical element of the Morning Star candle pattern. It should be a long bullish candle that closes well above the midpoint of the first candle, confirming a shift in market sentiment toward the upside. This bullish candle shows that buyers have taken control, signaling that a reversal may be underway. Ideally, this candle should have a strong body with minimal upper shadows, indicating sustained buying pressure.
Morning Star Candlestick Pattern Example
To illustrate the Morning Star candlestick pattern meaning, consider the following scenario:
Imagine a forex pair trending downwards, with several red (bearish) candles indicating strong selling pressure. After a few days of decline, a large bearish candle forms, reinforcing the downtrend. The next day, however, a small-bodied candle, such as a Doji, appears. This second candle is a visual representation of indecision, suggesting that sellers are beginning to lose momentum. Finally, on the third day, a long bullish candle emerges, closing above the midpoint of the first candle, signaling a shift in sentiment. This three-candle sequence completes the Morning Star pattern and hints that an upward reversal may be imminent.
Importance of the Morning Star Candlestick Pattern
The Morning Star candlestick pattern is revered among traders for its reliability in forecasting bullish reversals, especially in downtrending markets. Unlike some single-candle patterns, the Morning Star pattern’s three-candle formation provides a multi-step verification, giving traders a higher level of confidence in potential reversals. For instance, the second candle’s indecision acts as a buffer, hinting that the selling pressure is weakening, which is then confirmed by the bullish third candle.
This pattern is particularly useful in forex trading, where rapid shifts in sentiment are common due to macroeconomic factors, geopolitical events, and sudden news releases. Spotting the Morning Star candlestick in these fast-paced markets allows traders to anticipate reversals before they become apparent in traditional indicators. This early recognition gives traders an edge, allowing for timely entries that maximize profit potential.
Read More: Shooting Star Candlestick Pattern
Anatomy of the Morning Star Pattern
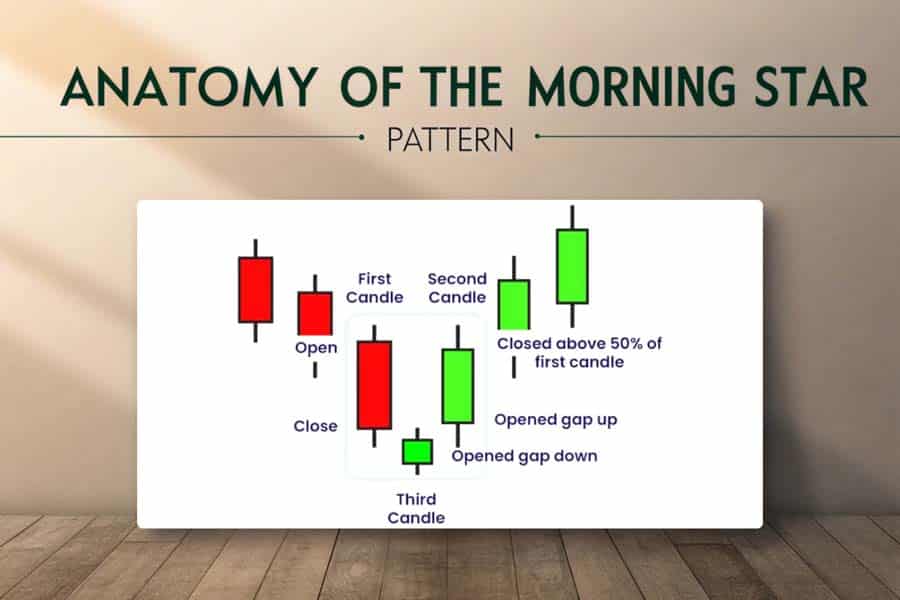
The Morning Star candlestick pattern is a classic three-candle reversal pattern that’s essential for traders to understand due to its unique structure and high accuracy in predicting bullish reversals. Here’s a closer look at the anatomy of this pattern, highlighting each candle’s role and how they work together to indicate a potential shift from a downtrend to an uptrend. Understanding each element can help traders identify the pattern accurately and utilize it to optimize their trading decisions.

Understand each component of the Morning Star pattern and its role in trading.
First Candle: The Bearish Candle
The first component of the Morning Star pattern is a long bearish (red) candle. This candle forms at the end of a downtrend and reflects strong selling momentum, as sellers push the price lower. Its length is significant, as a longer body suggests a solid bearish trend with consistent selling pressure. This bearish candle sets the tone for the overall downtrend, showing that sellers are firmly in control.
- Characteristics: This candle is usually large, with a close near its low, indicating robust bearish sentiment.
- Significance: The first candle reinforces the downtrend and signals that the selling momentum is still strong, setting up the conditions for a potential reversal.
Second Candle: The Indecision Candle
The second candle is a small-bodied candle that often appears as a Doji, spinning top, or a small real-bodied candle. Its role is crucial, as it represents a moment of indecision in the market, where neither buyers nor sellers hold a clear advantage. This candle may gap down from the first candle’s close, creating a visual separation that adds to the pattern’s reliability. The smaller body signifies that the aggressive selling has paused, and there’s a potential shift in control.
- Characteristics: The second candle has a small or negligible body, and it may or may not have wicks on either side. A Doji or spinning top is common here, suggesting balance between buyers and sellers.
- Significance: This candle represents the market’s hesitation and signals a potential shift in sentiment, as selling pressure begins to weaken and buyers start to appear.
Third Candle: The Bullish Confirmation Candle
The final and most crucial component of the Morning Star candlestick pattern is a long bullish (green) candle. This candle closes above the midpoint of the first bearish candle, which is essential for confirming the pattern’s validity. The bullish candle indicates a strong shift in sentiment, with buyers stepping in and driving prices higher, effectively overpowering the previous selling pressure. Its strength signifies that buyers are gaining control and a potential reversal is in progress.
- Characteristics: The third candle should be large and bullish, ideally with minimal shadows, as this shows sustained buying momentum. It closes significantly higher than the second candle and often above the midpoint of the first bearish candle.
- Significance: This candle confirms the reversal, providing traders with a clear signal that an uptrend may follow. The close above the midpoint of the first candle is vital as it reflects a complete turnaround in market sentiment.
The Role of Gaps in the Morning Star Pattern
One of the key elements that make the Morning Star pattern effective is the presence of gaps, particularly between the first and second candles. Gaps can vary based on the market and timeframe, but they often increase the pattern’s reliability:
- Bearish Gap: Often, there is a small gap down between the close of the first candle and the open of the second candle. This gap underscores the selling momentum, adding a sense of urgency to the initial bearish sentiment.
- Bullish Gap: In some cases, there’s a gap up between the close of the second candle and the open of the third candle, indicating renewed buying interest and adding to the momentum of the reversal.
While gaps are more common in stock and commodities markets due to market closing times, in the 24-hour forex market, a gap may appear due to significant news or events. When gaps are present, they act as confirmation for traders, enhancing the strength and reliability of the Morning Star candle pattern.
Key Elements for Identifying a Morning Star Pattern
- Preceding Downtrend: The Morning Star pattern must appear at the end of a downtrend. If there’s no clear downtrend, the pattern is less likely to signal a strong reversal.
- Candle Characteristics: Each candle in the pattern has distinct traits, with the first being bearish, the second showing indecision, and the third being strongly bullish.
- Volume Analysis: Although not always necessary, a spike in volume during the formation of the third candle can add confirmation that a reversal is underway.
- Time Frame Consideration: The Morning Star is most reliable on longer timeframes, such as daily or weekly charts, as these provide stronger signals and reduce the likelihood of false breakouts.
Example of Morning Star Pattern Interpretation
Imagine the Morning Star pattern appears on a forex chart after a prolonged downtrend. The first candle shows a steep drop, reflecting sustained selling pressure. The second candle is a Doji, indicating indecision, as both buyers and sellers are cautious. The third candle then emerges as a strong bullish candle, closing well above the midpoint of the first candle, suggesting a reversal.
This shift across the three candles demonstrates the anatomy of the Morning Star candlestick pattern effectively. By understanding each component and the overall structure, traders can better assess market sentiment and make informed trading decisions.
The Morning Star pattern’s unique three-step formation provides a powerful tool for identifying potential reversals, making it an invaluable part of any technical trader’s toolkit.
Optimal Conditions for the Morning Star Pattern

Learn about the ideal market conditions that enhance the reliability of the Morning Star pattern.
Essential Market Conditions
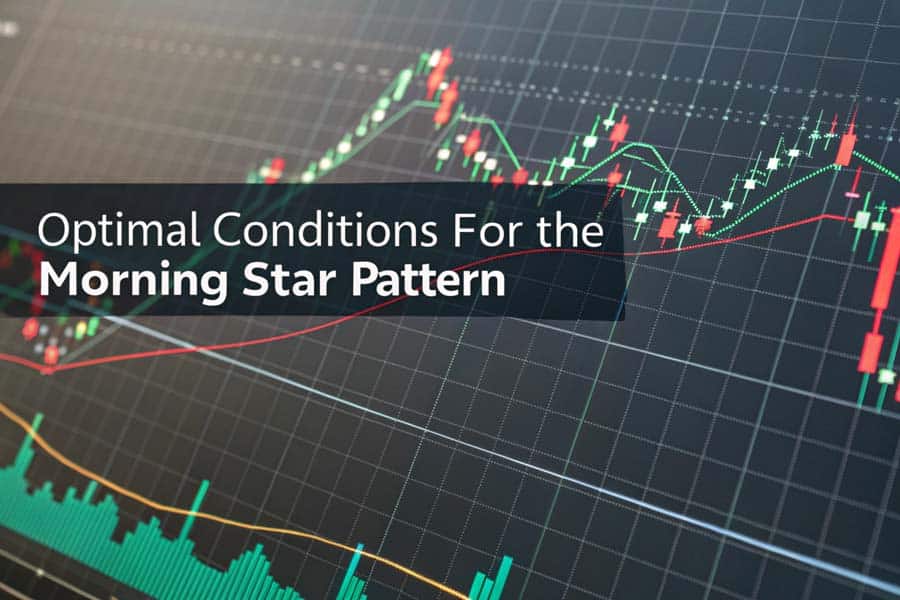
The Morning Star pattern gains more significance under specific market conditions:
- A Strong Downtrend: The Morning Star pattern is most effective when it appears at the bottom of a pronounced downtrend. This prior downtrend is essential, as it increases the likelihood that the pattern represents a genuine reversal.
- High Volume on the Third Candle: Volume serves as a powerful confirmation for the Morning Star pattern. When the third candle forms with significant trading volume, it indicates that buyers are entering the market with conviction, enhancing the pattern’s reliability.
- Higher Time Frames: While the Morning Star pattern can appear on any time frame, it is most reliable on daily or weekly charts. Longer time frames reduce the influence of market noise, providing a clearer indication of a potential trend reversal.
By focusing on these conditions, traders can increase the likelihood that the Morning Star pattern will accurately signal a shift in momentum.
How to Spot the Morning Star Pattern with a Step-by-Step Approach
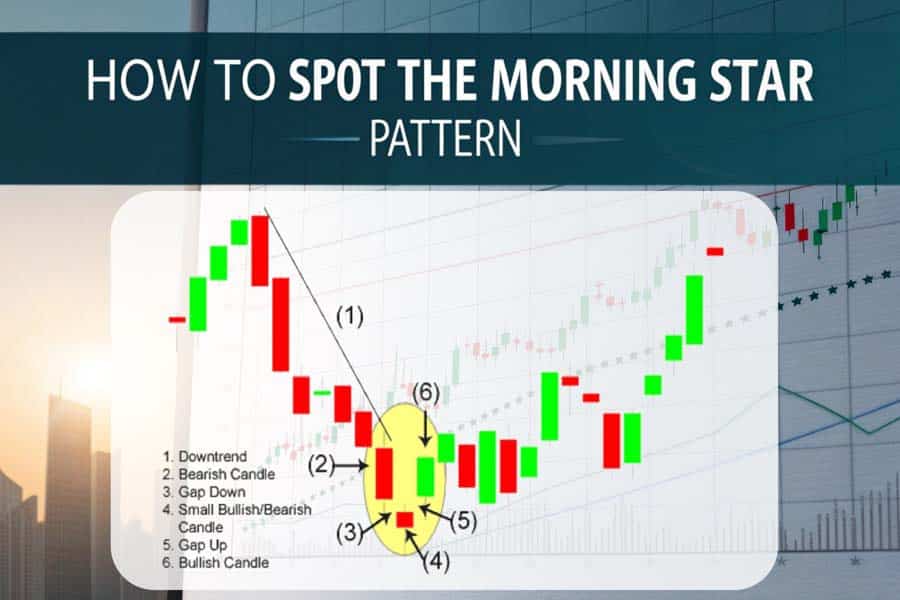
Identifying the Morning Star candlestick pattern on a price chart can signal a valuable bullish reversal opportunity. With a clear method, traders can accurately pinpoint this pattern and determine ideal entry points for trades. Here’s a straightforward guide to identifying the Morning Star pattern effectively, emphasizing each candle’s unique role and adding confirmation tools for enhanced reliability.

Follow these steps to accurately identify and trade using the Morning Star pattern.
Step 1: Confirm an Existing Downtrend
The Morning Star candlestick pattern is a reversal pattern that typically appears at the end of a downtrend. Begin by confirming that the market is in a clear downward trajectory, marked by lower highs and lower lows. If the market is sideways or in an uptrend, the Morning Star is less significant as it relies on a preceding bearish trend to signify reversal.
- Tip: Focus on a daily or weekly chart to establish the trend direction. Smaller timeframes can often lead to false signals, reducing the pattern’s reliability.
Step 2: Identify the First Bearish Candle
The first candle in the Morning Star pattern should be a large bearish candle, showing that sellers have driven the price lower. This candle represents strong selling momentum, which is necessary for the subsequent pattern formation.
- Key Points: This bearish candle should have a full body and close near its low, indicating that sellers were in control up to the close.
- Bonus Insight: High trading volume on this candle can emphasize the downtrend strength and set the stage for a more reliable reversal.
Step 3: Spot the Middle Indecision Candle
The second candle is a small-bodied candle, typically a Doji or a spinning top, that reflects indecision in the market. Here, buyers begin to enter cautiously, and sellers hesitate, causing the market to pause. This candle signals a shift in momentum as the selling pressure starts to weaken.
- Key Points: The middle candle should have a small body, indicating a stalemate between buyers and sellers. It typically gaps down from the previous candle’s close.
- Why It’s Important: This candle signals a transition, alerting traders that the prior downtrend might be losing strength and setting the stage for a potential upward move.
Step 4: Look for the Bullish Confirmation Candle
The third candle is the most critical in confirming the Morning Star pattern. It is a bullish (green) candle that opens below the second candle and then rises to close above the midpoint of the first bearish candle. This shows that buyers have taken control, marking a potential trend reversal.
- Key Points: This bullish candle should have a long body with a close well above the first candle’s midpoint to confirm a reversal.
- Confirmation Tip: If this candle also shows an increase in volume, it signals strong buying interest, supporting the validity of the pattern.
Step 5: Add Confirmation with Technical Indicators
Using additional indicators can strengthen the confidence in the Morning Star candlestick pattern as a reliable bullish reversal. Here are a few helpful tools:
- Volume Analysis: An increase in trading volume on the third candle further confirms that buyers are driving the reversal.
- Moving Averages: If the pattern occurs above a key moving average (e.g., the 50-day or 200-day), it often signals added support for the reversal.
- Relative Strength Index (RSI): When the RSI is below 30 (indicating oversold conditions) and begins to rise as the Morning Star forms, it provides additional confirmation of a bullish shift.
Step 6: Validate on Higher Time Frames
Morning Star patterns on higher timeframes, such as daily or weekly charts, often have a stronger impact and are more dependable for trend reversals than patterns seen on lower timeframes. This approach helps avoid false signals and provides a clearer overall market picture.
- Pro Tip: When a Morning Star pattern appears on both the daily and weekly timeframes, it is often a stronger and more reliable reversal signal.
Example: Spotting a Morning Star Pattern in Real-Time
Let’s break down an example. On a daily chart in a well-defined downtrend, you observe a large bearish candle, confirming selling pressure. The next candle is a small Doji, suggesting indecision and a pause in the downtrend. Finally, a long bullish candle forms, closing above the midpoint of the first bearish candle and accompanied by an increase in volume. This formation aligns with the Morning Star candlestick pattern and signals a potential bullish reversal, offering a high-probability trade opportunity.
The process of identifying the Morning Star pattern benefits from a disciplined approach, focusing on the structure and confirmation signals. By recognizing each candle’s significance and combining it with volume and indicators, traders can spot this reversal pattern with confidence and take advantage of potential trend changes.
Effective Trading Strategies Using the Morning Star Pattern

Unlock smart trading strategies that leverage the Morning Star pattern for maximum profit potential.
Entering a Trade
Once the Morning Star pattern is confirmed by the close of the third candle, traders may consider entering a long position. The entry point is typically just above the high of the third candle, ensuring that the reversal is firmly underway before committing to the trade.
Stop-Loss and Take-Profit Strategies
- Stop-Loss Placement: A recommended stop-loss level is just below the low of the second candle, as this level represents the recent market low and can serve as a reasonable risk threshold.
- Take-Profit Strategy: Using recent resistance levels as take-profit targets allows traders to capture gains efficiently. A trailing stop may also be applied to lock in profits if the trend continues beyond the anticipated level.
These strategies help manage risk and optimize potential returns when trading the Morning Star pattern.
Adapting to Market Dynamics
To further increase the effectiveness of the Morning Star pattern, adapt your strategy to the current market environment. In highly volatile or trending markets, pairing the Morning Star with other indicators (such as MACD) can improve your chances of a successful trade by confirming the trend’s strength.
Opofinance Services: A Trusted ASIC-Regulated Broker for Forex Trading
When trading patterns like the Morning Star, having a reliable broker is essential. Opofinance, an ASIC-regulated forex broker, offers a secure and supportive trading environment for traders at all levels. Known for its inclusion in the MT5 brokers list, Opofinance ensures that traders have access to industry-leading tools and analytics on the MetaTrader 5 platform, making technical analysis more streamlined and accessible.

Opofinance also features safe and convenient deposit and withdrawal methods, ensuring that traders can manage their funds with ease. Additionally, Opofinance’s social trading service provides traders with the opportunity to learn from experienced investors, enhancing their strategies by observing real-time trading decisions made by experts. This feature can be particularly useful for beginners looking to understand market patterns like the Morning Star.
With Opofinance’s robust offerings, traders can focus on improving their trading strategy with confidence, knowing they are backed by a secure and regulated platform.
Conclusion: Mastering the Morning Star Pattern for Reversals
The Morning Star candlestick pattern is a potent tool in any trader’s arsenal for identifying bullish reversals. By recognizing the three-candle formation, confirming market conditions, and using additional indicators, traders can capitalize on trend shifts with more certainty. The effectiveness of this pattern increases when applied in trending markets and with the support of a regulated broker like Opofinance, which offers top-tier trading resources and financial security.
Whether you are a novice or seasoned trader, mastering the Morning Star pattern can lead to more confident and successful trading decisions, adding a valuable dimension to your technical analysis approach.
Key Takeaways
- Morning Star Pattern: A three-candle bullish reversal signal used to identify potential market upswings.
- Conditions: Most effective in downtrending markets with high volume on the third candle and confirmation from indicators like RSI.
- Trading Strategy: Enter long positions after the third candle with a stop-loss below the second candle; take profit at resistance levels.
- Opofinance: A trusted ASIC-regulated broker supporting traders with MT5 access, safe transaction methods, and social trading services for learning and strategy development.
What makes the Morning Star pattern a reliable reversal indicator?
The Morning Star pattern effectively signals a shift from bearish to bullish sentiment, especially when confirmed with high volume and technical indicators like RSI or MACD.
Can the Morning Star pattern be used on any chart timeframe?
While it can appear on any timeframe, it is most reliable on daily or weekly charts where the signal strength is less likely to be influenced by short-term volatility.
How does Opofinance support technical trading strategies?
Opofinance provides advanced tools on the MT5 platform, social trading options for learning from expert traders, and reliable deposits and withdrawals, which enhances the overall trading experience.


