

In the quest for market-beating performance, traders relentlessly search for the most accurate leading indicator. While no single tool is a flawless crystal ball, the consensus among seasoned traders is that the Relative Strength Index (RSI) is exceptionally reliable, especially when used to spot divergences before a price reversal. However, the true secret to accuracy isn’t finding one “magic” indicator. It’s about understanding how to combine several of the best leading indicators to confirm signals—a strategy this guide will explore in depth. We’ll move beyond a simple list to give you a framework for using these tools, whether you are trading with an online forex broker or in other markets.
Key Takeaways:
- No “Magic” Indicator Exists: The core message is that no single indicator is 100% accurate. The most accurate leading indicator for one trader might not be for another; success comes from strategy and confirmation.
- The Power of Confluence: Professional traders gain an edge by seeking “confluence,” where multiple, non-correlated indicators point to the same conclusion before entering a trade.
- Divergence is Key: For many of the best leading indicators like RSI, OBV, and the Stochastic Oscillator, the most potent signal is divergence—when the indicator’s direction disagrees with the price trend.
- Indicators are Tools, Not Systems: Leading indicators provide clues, not certainties. They must be integrated into a complete trading plan that includes risk management, market analysis, and a clear understanding of market conditions.
- The Top 5 Indicators: The most widely respected leading indicators for active traders are the Relative Strength Index (RSI), On-Balance Volume (OBV), Stochastic Oscillator, Bollinger Bands, and Fibonacci Retracement.
What is a Leading Indicator?
So, what exactly is a leading indicator? Think of it as a forward-looking signal. It’s a technical analysis tool designed to anticipate future price movements before they happen. Unlike their counterparts, lagging indicators, which confirm trends that are already underway, leading indicators provide predictive clues. They often achieve this by measuring the momentum, volume, or volatility of price action.
For instance, if momentum is slowing down even as the price is hitting new highs, a leading indicator might signal that the trend is running out of steam and a reversal could be on the horizon. This predictive nature is what makes them so appealing; they offer the chance to get in early on a new trend or exit a fading one before the crowd. However, this forecasting ability comes with a significant trade-off: they are not always right and can give false signals. The pursuit of the most accurate leading indicator is really a quest to find a tool that provides a reliable edge over time, not a guarantee on any single trade.
Read More: Most Effective Forex Trading Indicators
Leading vs. Lagging Indicators
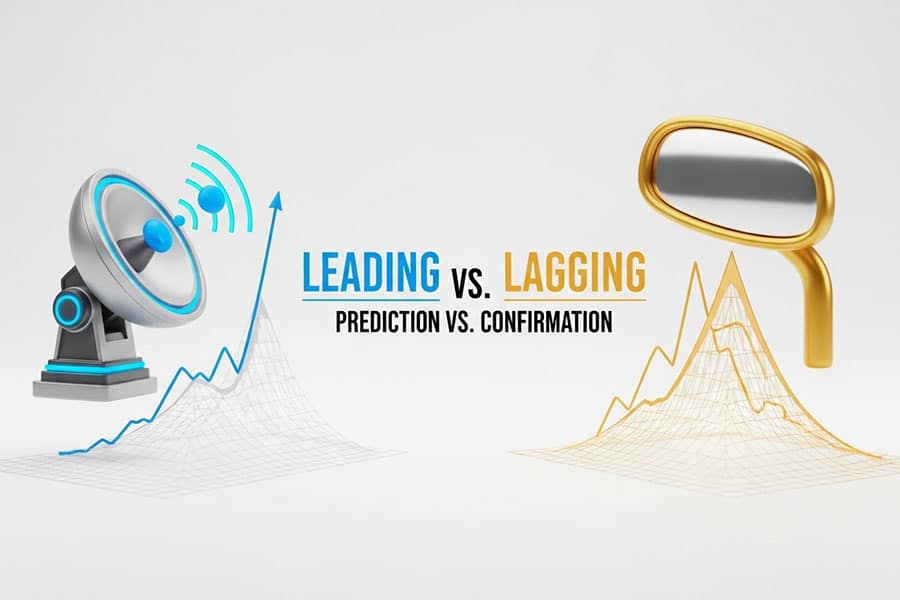
Understanding the distinction between leading and lagging indicators is fundamental to using them effectively. It’s not about one being better than the other; they serve different, complementary purposes. The debate over leading vs lagging indicators is a common one among new traders, but experienced practitioners know that both are essential components of a well-rounded technical analysis toolkit. One provides foresight, while the other provides hindsight and confirmation.
What Leading Indicators Tell You
Leading indicators are all about anticipation. They attempt to forecast where the price is headed next. By analyzing factors like momentum and volume, they can signal that a market is overbought (due for a drop) or oversold (due for a rally) before the price has actually turned. This is their primary strength—giving you a potential head start. The challenge lies in their propensity for “whipsaws” or false signals, especially in choppy or sideways markets. A signal might suggest a reversal that never materializes, leading to a losing trade if acted upon in isolation. This is why finding the most accurate leading indicator is less about a single tool and more about a robust strategy.
What Lagging Indicators Tell You
Lagging indicators, as the name implies, follow the price action. They confirm what has already happened. The most common examples are moving averages and the MACD (Moving Average Convergence Divergence). When a short-term moving average crosses above a long-term one, it doesn’t predict a new uptrend; it confirms that one has already begun. Their strength is their reliability; because they wait for confirmation, they generate fewer false signals than leading indicators. The downside is their tardiness. By the time a lagging indicator confirms a trend, a significant portion of the price move may have already occurred, potentially reducing the profit potential.
| Type | What it Signals | Example | Pros | Cons |
| Leading | Future price movements, potential reversals, overbought/oversold conditions. | RSI, Stochastic Oscillator, OBV | Provides early entry/exit signals. Can increase profit potential. | Prone to false signals (whipsaws). Less reliable in non-trending markets. |
| Lagging | Confirmation of an existing trend’s strength and direction. | Moving Averages, MACD | More reliable, fewer false signals. Good for trend-following strategies. | Signal comes late, potentially missing the initial part of a move. |
The 5 Most Reliable Leading Indicators
After sifting through countless options, we’ve compiled a list of what are widely considered the best leading indicators used by active traders. These tools have stood the test of time due to their utility and relative reliability. Remember, the goal is not to find the single most accurate leading indicator that works 100% of the time, but to understand these tools so you can build a strategy around their strengths.
1. Relative Strength Index (RSI)
The RSI is a momentum oscillator that measures the speed and change of price movements on a scale of 0 to 100. It is, without a doubt, a top contender for the title of the most reliable leading indicator, but its true power is often misunderstood by novice traders.
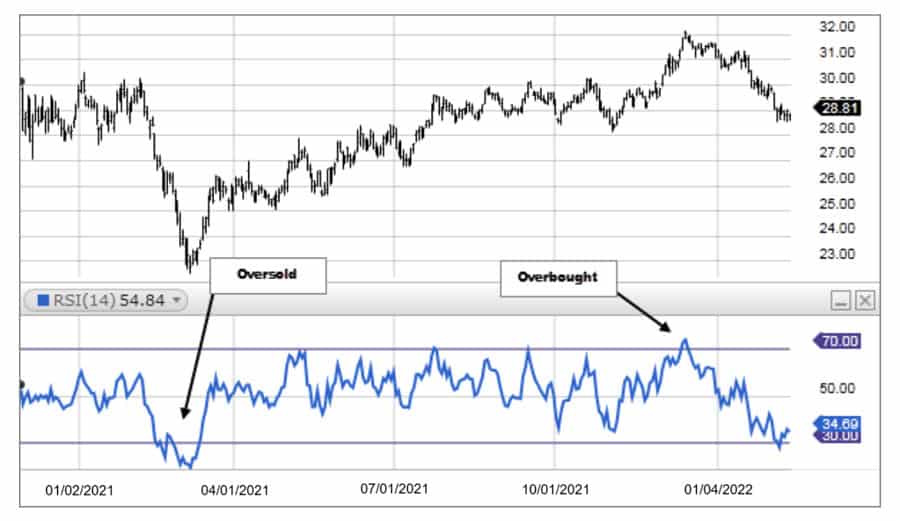
- How it works: The RSI calculates the ratio of average gains to average losses over a specific period, typically 14. This generates a line that oscillates between 0 and 100.
- What to look for: Most traders know the basics: a reading above 70 suggests an asset is overbought and may be primed for a price decline, while a reading below 30 suggests it is oversold and could be ready for a rally. However, the most powerful signal from the RSI is divergence. Bullish divergence occurs when the price makes a lower low, but the RSI makes a higher low, signaling that downside momentum is waning and a reversal to the upside could be imminent. Conversely, bearish divergence—when the price makes a higher high but the RSI makes a lower high—is a strong leading signal of a potential top.
- Strengths & Weaknesses: Its primary strength is its effectiveness in identifying potential reversals through divergence. It’s a versatile tool that works across many markets and timeframes. Its main weakness is that in a strong, sustained trend, the RSI can remain in overbought or oversold territory for an extended period, giving premature or false reversal signals.
2. On-Balance Volume (OBV)
OBV is a momentum indicator that uses volume flow to predict price changes. It’s often referred to as the “smart money” indicator because it attempts to detect accumulation (buying) and distribution (selling) by institutional traders. For many, OBV is a candidate for the most accurate leading indicator when it comes to confirming trend strength.
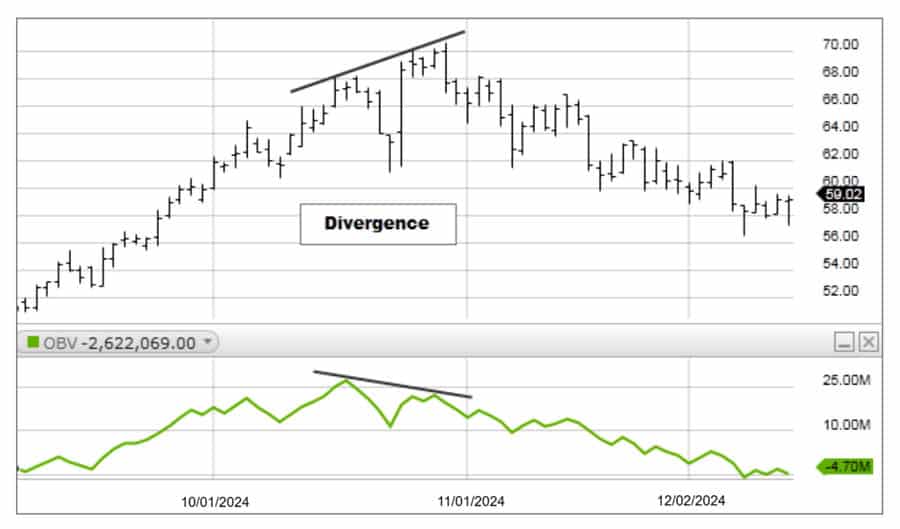
- How it works: OBV is a running total of volume. On up days (when the price closes higher), the day’s volume is added to the OBV total. On down days, the day’s volume is subtracted. The idea is that volume precedes price.
- What to look for: The actual value of the OBV isn’t important; its direction is. The most powerful signal is divergence between the price and the OBV line. If the price is rising but the OBV is flat or falling, it suggests that volume is not supporting the rally, and it may soon fail. This is bearish divergence. Conversely, if the price is falling but the OBV is starting to trend upwards, it indicates that smart money is accumulating positions, and the price may soon follow. This is a classic bullish divergence and a powerful leading signal.
- Strengths & Weaknesses: OBV’s strength is its simplicity and its powerful divergence signals. It provides a clear look at whether volume is confirming the price trend. Its weakness is that a single large volume spike (perhaps from a news event) can distort the indicator for a long time. It also doesn’t have overbought/oversold levels, making it less useful in range-bound markets.
Read More: fibonacci retracement in forex
3. Stochastic Oscillator
The Stochastic Oscillator is another momentum-based leading indicator that compares a particular closing price of an asset to a range of its prices over a certain period of time. It’s particularly popular for identifying potential reversal points in both trending and range-bound markets, making it one of the best leading indicators for its versatility.
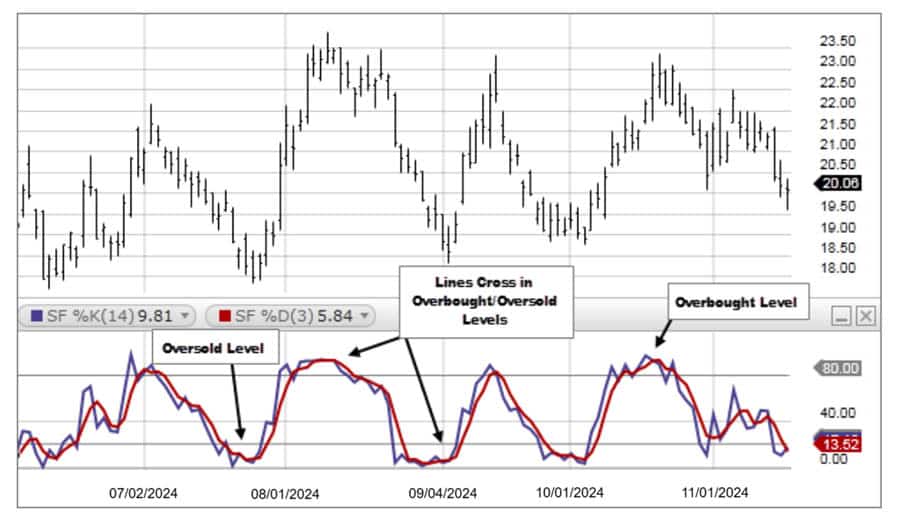
- How it works: The indicator is based on the idea that in an uptrend, prices tend to close near their highs, and in a downtrend, they tend to close near their lows. As momentum slows, the closing price starts to pull away from the high or low, signaling a potential reversal. It consists of two lines, %K and %D, and oscillates between 0 and 100.
- What to look for: Similar to the RSI, levels above 80 are considered overbought, and levels below 20 are oversold. A primary signal is the crossover of the %K and %D lines within these territories. A crossover down in the overbought zone is a sell signal, while a crossover up in the oversold zone is a buy signal. Even more potent is divergence. If the price is making a new high but the Stochastic is making a lower high, it signals weakening upside momentum and is a strong bearish leading signal.
- Strengths & Weaknesses: The Stochastic is excellent for pinpointing entry and exit points in oscillating markets. Its signals are frequent, which can be both a pro and a con. The main weakness is that its speed makes it prone to generating many false signals (“whipsaws”) in volatile conditions. It requires careful filtering and confirmation.
4. Bollinger Bands
Developed by John Bollinger, Bollinger Bands are a volatility indicator. While they are often used as a lagging indicator to confirm trend, they have powerful leading characteristics that can signal reversals. They consist of a middle band (a simple moving average) and two outer bands representing standard deviations away from the middle band.
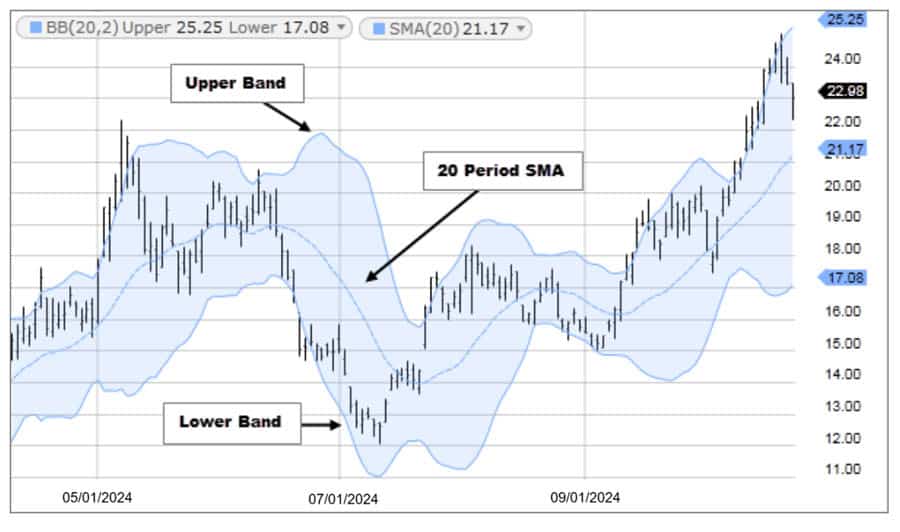
- How it works: The bands widen when market volatility increases and narrow when volatility decreases. This provides a dynamic view of the market’s state.
- What to look for: The leading signals come from how the price interacts with the outer bands. When the price touches one of the outer bands, it doesn’t automatically mean a reversal is coming. However, a touch of the upper band followed by a reversal candle can signal a potential top. A touch of the lower band followed by a bullish candle can signal a bottom. A “walk the band” scenario, where price consistently hugs one of the outer bands, indicates a very strong trend. The end of that walk is often a leading signal that the trend is exhausted. Perhaps the strongest signal is a “Bollinger Squeeze,” where the bands get very narrow, signaling low volatility. This often precedes a period of high volatility—a massive price breakout in either direction.
- Strengths & Weaknesses: Bollinger Bands are excellent for gauging volatility and identifying potential support and resistance levels dynamically. They are highly adaptable. Their weakness is that they don’t, by themselves, indicate direction. A touch of a band is just an alert; it requires confirmation from price action or another indicator to become a tradable signal.
5. Fibonacci Retracement
Unlike the other indicators on this list, Fibonacci Retracement is not an oscillator that moves with price. It is a manual tool that traders draw on a chart to identify potential support and resistance levels where a price reversal might occur. It’s a unique but indispensable tool, and many consider it the most accurate leading indicator for plotting precise entry and exit points.
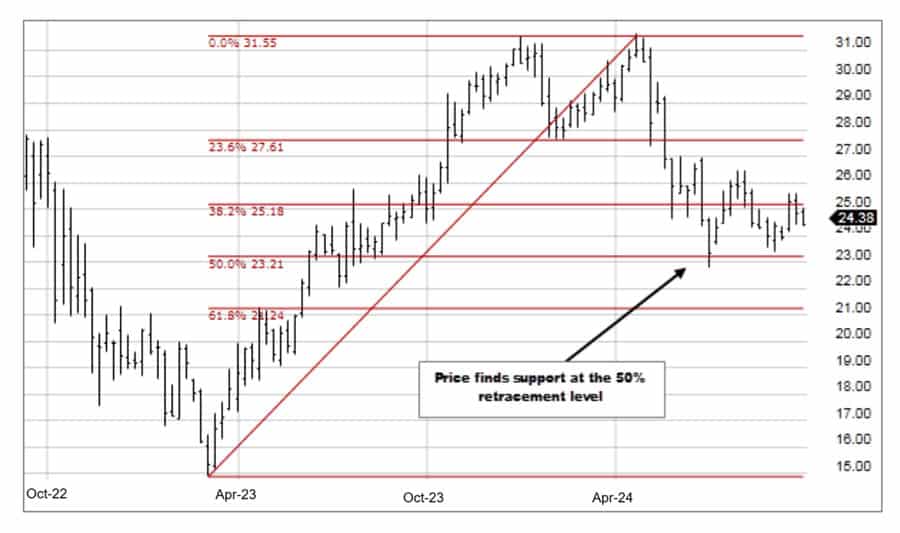
- How it works: After a significant price move (a swing high to a swing low, or vice versa), traders apply the Fibonacci levels. The tool plots horizontal lines at key Fibonacci ratios: 23.6%, 38.2%, 50%, 61.8%, and 78.6%. These levels represent potential areas where the price, after pulling back, might reverse and resume the original trend.
- What to look for: You are looking for price to respect these levels. For example, in an uptrend, the price might rally, then pull back to the 61.8% retracement level. If it finds support there and bounces, it’s a strong leading signal to enter a long trade, anticipating a continuation of the uptrend. The 61.8% level, often called the “golden ratio,” is watched particularly closely by traders. The price action around these levels is the key—a bounce is a signal, a slice through it is not.
- Strengths & Weaknesses: Fibonacci Retracement is incredibly effective at identifying hidden support and resistance levels that aren’t obvious otherwise. It provides clear price targets for entries and stops. The main weakness is its subjectivity. Different traders might choose different swing highs and lows to draw the tool from, leading to different levels. It requires practice and works best when confirmed by other signals.
Read More: Forex Trading Tools
Achieve Accuracy with Confluence
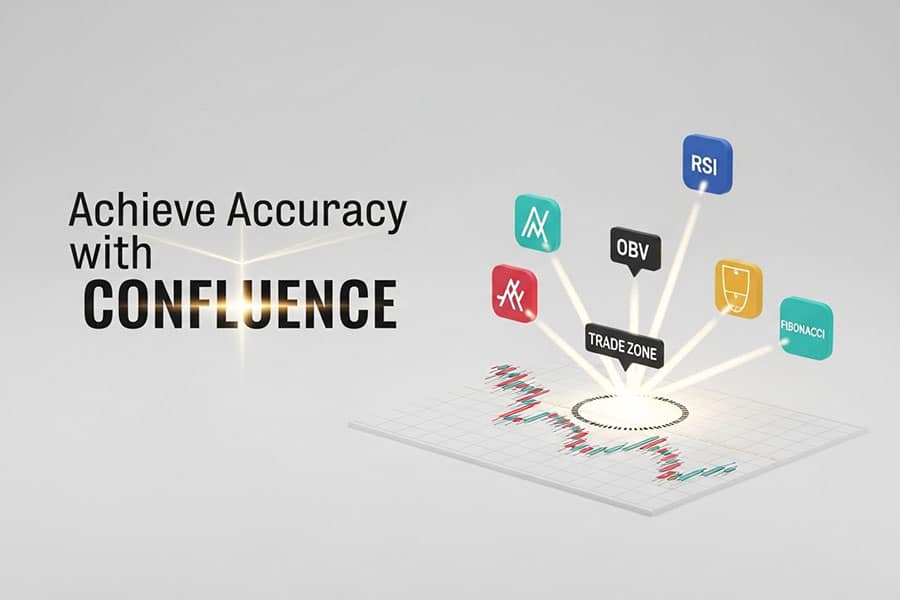
Here’s the most crucial part of this guide and the secret weapon of professional traders: confluence. Searching for the single most accurate leading indicator is a fool’s errand. True accuracy comes from combining signals. Confluence is the practice of looking for multiple, non-correlated technical signals to align and point to the same outcome. When two or three different indicators, each measuring a different aspect of the market (like momentum, volume, and volatility), all give you a buy signal at the same time, the probability of that trade being successful increases dramatically.
Why Using a Single Indicator Fails
Relying on just one indicator is like trying to navigate with only a compass. It tells you direction, but it doesn’t tell you about the terrain, obstacles, or weather ahead. The RSI might be in oversold territory, screaming “buy,” but the overarching trend could be powerfully bearish, and the price might continue to plummet. The Stochastic might give a buy crossover, but volume might be non-existent, suggesting there’s no conviction behind the move. Using a single indicator leaves you vulnerable to its inherent weaknesses and the specific market conditions where it performs poorly. This is why the journey to find the most reliable leading indicator must end with the realization that teamwork is key.
A Powerful Combo: RSI and OBV
Let’s walk through a practical example of confluence. A powerful combination is using the RSI for momentum and the OBV for volume confirmation. Imagine a stock has been in a downtrend.
- The Setup: The price makes a new low, continuing the downtrend. Many traders might be scared to buy.
- Signal 1 (RSI): You look at your RSI and notice that while the price just made a lower low, the RSI has made a higher low. This is classic bullish divergence. It’s your first clue that the downward momentum is fading. This is a potential signal from what many consider the most accurate leading indicator for momentum.
- Signal 2 (OBV): Now, you check the OBV for confirmation. You notice that the OBV line has also been trending upwards over the last few price swings, even as the price was falling. This suggests that “smart money” has been quietly accumulating shares.
- The Confluence Signal: You now have two powerful, non-correlated leading indicators telling you the same story. The RSI says momentum is shifting, and the OBV says volume is supporting an upside move. The confluence of these two signals provides a much higher-probability entry point for a long trade than either signal would alone.
This method turns the search for the most accurate leading indicator into a more robust process of signal verification.
Another Winning Trio
For an even more robust signal, you could combine the Stochastic Oscillator, Bollinger Bands, and Volume.
- The Setup: An asset’s price has been trending down and touches the lower Bollinger Band.
- Signal 1 (Bollinger Bands): The price touching the lower band is an alert. It suggests the price is oversold relative to recent volatility.
- Signal 2 (Stochastic Oscillator): You look at the Stochastic and see it is in oversold territory (below 20) and has just had a bullish crossover, with the %K line crossing above the %D line.
- Signal 3 (Volume): At the same time, you notice a significant spike in buying volume, confirming that there is real buying pressure at this level.
With these three signals aligning, a trader can enter a long position with much greater confidence. This layered approach is the hallmark of a professional strategy, moving far beyond a simple reliance on a single, supposedly most reliable leading indicator.
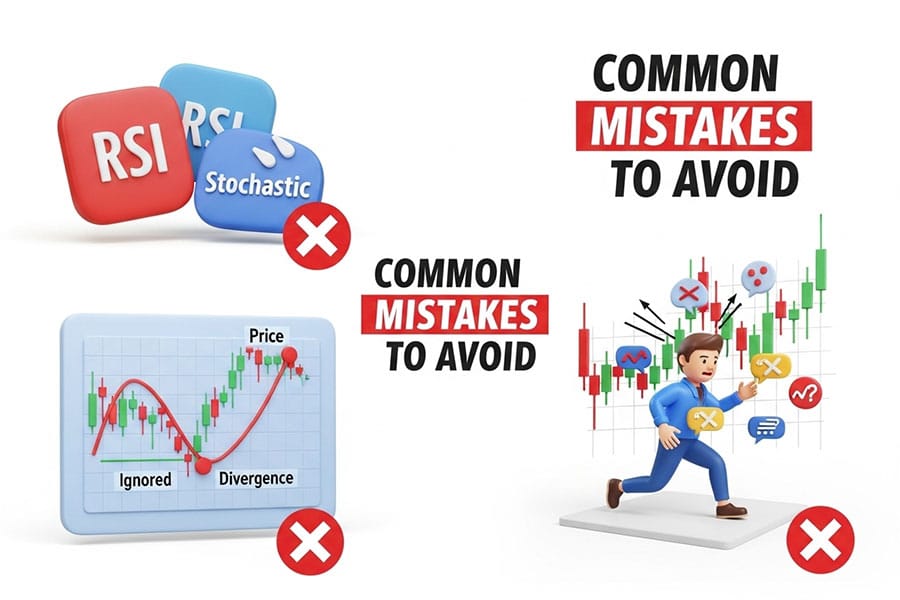
Common Mistakes to Avoid
Using these powerful tools effectively also means knowing the common pitfalls. From my experience, traders often get tripped up by the same few mistakes when they first start using leading indicators. Avoiding these will save you a lot of frustration and capital. The belief in a single most accurate leading indicator is often the first mistake that leads to others.
- Ignoring Divergence: Many traders only focus on the overbought/oversold levels of indicators like RSI and Stochastics. As we’ve discussed, the most potent signals often come from divergence. Ignoring it is leaving the best feature of the tool unused.
- Not Adjusting for Market Conditions: An indicator that works beautifully in a ranging market (like the Stochastic Oscillator) might get you crushed in a strong trending market. You must assess the overall market structure first and then choose the appropriate tool. No indicator works in all conditions.
- Chasing Every Signal: Leading indicators, especially faster ones like the Stochastic, can produce a lot of signals. Acting on every single one is a recipe for overtrading and being “whipsawed” to death. Patience and waiting for high-quality, confirmed setups is critical.
- Forgetting Risk Management: This is the cardinal sin of trading. No matter how perfect a setup looks, and no matter how many indicators align, any trade can fail. Always use a stop-loss. Your risk management strategy is more important than any indicator, even the most accurate leading indicator.
- Using Correlated Indicators: A common mistake is seeking “confluence” from two indicators that measure the same thing. For example, using the RSI and the Stochastic Oscillator together for confirmation is redundant. Both are momentum oscillators. If one is overbought, the other is likely to be as well. True confluence comes from combining indicators that measure different things, like momentum, volume, and volatility.
Which Indicator is Best for You?
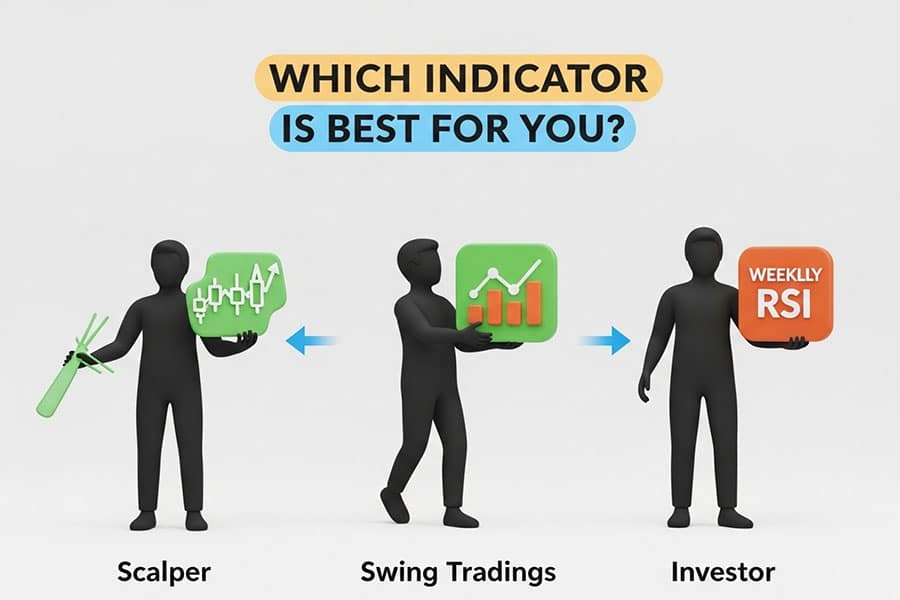
Ultimately, the question of “which is the most accurate leading indicator?” has a personal answer. The best indicator for you depends entirely on your trading style, the market you trade (stocks, forex, crypto), and your preferred timeframe. A scalper on a 1-minute chart will have very different needs than a swing trader on a daily chart. The key is not to find a magic bullet but to find a tool that resonates with you.
Pick one or two from this list, study them deeply, and practice with them on a demo account. Learn their nuances and their weaknesses. The process of backtesting and practice will reveal which indicator, or combination of indicators, is the most reliable leading indicator for your specific strategy. Your skill in using the tool is far more important than the tool itself.
Opofinance Services
To effectively use the best leading indicators, you need a broker with powerful tools and a secure environment. As an ASIC-regulated broker, Opofinance provides the robust platform traders need to succeed.
- Advanced Trading Platforms: Choose from industry-leading platforms including MT4, MT5, cTrader, and the proprietary OpoTrade app, ensuring you have the right environment for your strategy.
- Innovative AI Tools: Gain a unique edge with cutting-edge AI technology. Utilize the AI Market Analyzer for deep insights, the AI Coach to refine your strategy, and AI Support for instant assistance.
- Social & Prop Trading: Join a community of traders with social trading features, or take on the challenge of proprietary trading to manage larger capital.
- Secure & Flexible Transactions: Experience peace of mind with safe and convenient deposit and withdrawal methods. Opofinance embraces modern finance by supporting crypto payments, all with zero fees charged by the broker.
Ready to elevate your trading with superior tools and security? Explore what Opofinance has to offer today!
The Bottom Line
In the final analysis, the search for the single most accurate leading indicator is a journey that should lead a trader to a more profound conclusion: there isn’t one. The most reliable path to predictive accuracy in trading is through the skillful combination of indicators, a strategy known as confluence. By confirming signals from tools that measure different market dynamics—like momentum, volume, and volatility—traders can significantly increase their odds. Mastery of a few chosen indicators, combined with disciplined risk management, is the true secret to gaining a predictive edge.
Can an indicator be both leading and lagging?
Yes, some indicators, like Bollinger Bands or the Ichimoku Cloud, have both leading and lagging components. For example, the Bollinger Bands themselves react to past volatility (lagging), but how price interacts with them can provide leading signals about potential reversals.
How does market psychology relate to leading indicators?
Leading indicators are essentially quantifications of market psychology. An overbought RSI reading reflects excessive optimism or greed, while divergence can show a subtle shift in conviction before it’s obvious in the price. They attempt to measure the ebb and flow of fear and greed.
Are leading indicators useful for long-term investors?
While primarily used by short- to medium-term traders, they can be useful for long-term investors. A weekly or monthly RSI divergence, for instance, can signal a major, multi-year top or bottom in a market, helping an investor time a major entry or exit.
What is the best timeframe to use for a leading indicator?
There is no single “best” timeframe. It should align with your trading style. A common professional technique is to use multiple time frame analysis: find a signal on your primary chart (e.g., 4-hour), then zoom in to a shorter timeframe (e.g., 15-minute) to fine-tune your entry.
Do leading indicators work in cryptocurrency markets?
Absolutely. Because crypto markets are driven heavily by speculation and momentum, leading indicators like RSI, OBV, and Bollinger Bands are extremely popular and effective for analyzing their volatility and potential trend reversals.


